
As of 04/30/2026
Indus: 49,652 +790.33 +1.6%
Trans: 20,794 +262.22 +1.3%
Utils: 1,165 +22.58 +2.0%
Nasdaq: 24,892 +219.07 +0.9%
S&P 500: 7,209 +73.06 +1.0%
|
YTD
+3.3%
+19.8%
+9.1%
+7.1%
+5.3%
|
|
As of 04/30/2026
Indus: 49,652 +790.33 +1.6%
Trans: 20,794 +262.22 +1.3%
Utils: 1,165 +22.58 +2.0%
Nasdaq: 24,892 +219.07 +0.9%
S&P 500: 7,209 +73.06 +1.0%
|
YTD
+3.3%
+19.8%
+9.1%
+7.1%
+5.3%
| |
|
| ||
$ $ $
Here's a symbol list of 145 chart and candlestick patterns (13 "investment grade" candle patterns) found in today's securities using my version of Patternz: ANF, ABM, ADBE, AFL, AA, AEP, ATR, ANET, ASH, AIZ, AVY, AZTA, BSET, BAX, BA, BKNG, BCO, BR, CBT, CPB, COR, CENX, CHKP, CHD, CSCO, CLF, CAG, CONN, COST, COTY, CCRN, DECK, DSGR, DOV, EOG, EQT, EG, EXPD, FLEX, FMC, FCX, FDP, GME, GPS, GD, GPRO, GES, HE, HQY, HSII, HP, HOV, HWM, INCY, KELYA, KMT, LAMR, LEG, LNC, MAN, MKTX, MA, MDT, META, MGEE, MU, MOS, MUR, MYGN, NBR, NFG, NFLX, NI, OMI, PANW, PKE, PATK, PDCO, PEN, PETS, PCG, PINC, PRU, PSTG, QTWO, KWR, RTX, REGN, RLI, RCKY, CRM, SAIC, SKYW, SCCO, SWX, SR, SXI, SCS, SNPS, TDG, TZOO, TWLO, UHAL, UIS, UPS, V, WSM, WOLF, WWW, IYC, FDN, FXI, ICF, IEO, EWH, EIS, EZA, EWY, THD, TUR, EWU, DBA, PBE, ROBO, XLF, XRT, UNG, MGK, VONG. Click this link for details (pattern type, start and end dates).
For a list of small patterns (those a few days wide) click this link.
$ $ $
You can find setups based on a Fibonacci retrace by clicking on the link.
The following patterns were found manually, not using Patternz. Mr. Bulkowski has excluded any securities he owns from appearing in the list. However, he may add any of the securities listed to his portfolio at any time, just as you can.
In the table below, the red and green colors are based on the historical breakout direction for the associated chart pattern. If a high and tight flag appears, the start and end dates highlight the flagpole only and not the flag.
For details about the chart patterns, click here.
-- Thomas Bulkowski, author: Invest for Two-Comma Wealth (#Ad)
![]()
| Symbol | Chart Pattern | Bullish Bearish | Start | End | Industry |
| DDD | Pipe top | 06/03/2024 | 06/10/2024 | Electronics | |
| AMGN | Double Bottom, Adam and Eve | 05/30/2024 | 06/13/2024 | Biotechnology | |
| AGO | Broadening bottom | 05/15/2024 | 06/27/2024 | Insurance (Life) | |
| AZTA | Double Top, Adam and Eve | 06/12/2024 | 06/24/2024 | Semiconductor Cap Equip. | |
| BA | Double Bottom, Adam and Adam | 06/20/2024 | 06/25/2024 | Aerospace/Defense | |
| BR | Double Bottom, Adam and Eve | 05/30/2024 | 06/14/2024 | Information Services | |
| CALM | Double Bottom, Eve and Adam | 06/10/2024 | 06/21/2024 | Food Processing | |
| COR | Ugly double bottom | 05/29/2024 | 06/12/2024 | Biotechnology | |
| CGNX | Pipe bottom | 06/03/2024 | 06/10/2024 | Precision Instrument | |
| CONN | Dead-cat bounce | 06/24/2024 | 06/27/2024 | Retail (Special Lines) | |
| FANG | Double Bottom, Adam and Adam | 06/04/2024 | 06/17/2024 | Petroleum (Producing) | |
| ^DJT | Broadening bottom | 05/29/2024 | 06/26/2024 | None | |
| DUK | Double Top, Adam and Adam | 05/21/2024 | 06/04/2024 | Electric Utility (East) | |
| EMR | Broadening top, right-angled and ascending | 06/06/2024 | 06/27/2024 | Computers and Peripherals | |
| EOG | Double Bottom, Adam and Adam | 06/04/2024 | 06/14/2024 | Natural Gas (Distributor) | |
| EXPD | Three Rising Valleys | 05/01/2024 | 06/14/2024 | Air Transport | |
| FICO | Ugly double bottom | 04/26/2024 | 05/31/2024 | IT Services | |
| FLS | Broadening wedge, descending | 05/22/2024 | 06/24/2024 | Machinery | |
| HTLD | Ugly double bottom | 04/30/2024 | 05/29/2024 | Trucking/Transp. Leasing | |
| KFRC | Head-and-shoulders bottom | 05/30/2024 | 06/17/2024 | Human Resources | |
| LEN | Double Top, Eve and Adam | 06/03/2024 | 06/12/2024 | Homebuilding | |
| L | Double Bottom, Eve and Eve | 05/29/2024 | 06/14/2024 | Insurance (Prop/Casualty) | |
| MHO | Broadening bottom | 05/23/2024 | 06/21/2024 | Homebuilding | |
| MA | Double Bottom, Eve and Eve | 06/03/2024 | 06/13/2024 | Financial Services | |
| MOS | Pipe bottom | 06/10/2024 | 06/17/2024 | Chemical (Diversified) | |
| NBR | Pipe bottom | 06/10/2024 | 06/17/2024 | Oilfield Svcs/Equipment | |
| NTNX | Double Bottom, Eve and Eve | 06/07/2024 | 06/20/2024 | E-Commerce | |
| OTEX | Pipe bottom | 06/03/2024 | 06/10/2024 | E-Commerce | |
| PAYX | Double Top, Adam and Adam | 05/22/2024 | 06/24/2024 | IT Services | |
| PNW | Double Top, Eve and Eve | 05/21/2024 | 05/31/2024 | Electric Utility (West) | |
| PGR | Multi-peaks | 03/18/2024 | 06/27/2024 | Insurance (Prop/Casualty) | |
| PSTG | Pipe top | 06/10/2024 | 06/17/2024 | Computers and Peripherals | |
| RL | Head-and-shoulders top | 05/31/2024 | 06/25/2024 | Apparel | |
| RTX | Head-and-shoulders top | 05/23/2024 | 06/24/2024 | Aerospace/Defense | |
| RGS | Flag, high and tight | 06/07/2024 | 06/27/2024 | Toiletries/Cosmetics | |
| R | Broadening bottom | 05/28/2024 | 06/12/2024 | Trucking/Transp. Leasing | |
| CRM | Ugly double bottom | 05/30/2024 | 06/17/2024 | E-Commerce | |
| SLB | Double Bottom, Eve and Adam | 06/06/2024 | 06/14/2024 | Oilfield Svcs/Equipment | |
| SEE | Head-and-shoulders top | 05/17/2024 | 06/12/2024 | Packaging and Container | |
| SEIC | Double Bottom, Adam and Adam | 06/10/2024 | 06/17/2024 | IT Services | |
| NOW | Pipe bottom | 05/28/2024 | 06/03/2024 | IT Services | |
| SKX | Double Top, Adam and Eve | 06/12/2024 | 06/25/2024 | Shoe | |
| SCS | Double Bottom, Adam and Adam | 06/10/2024 | 06/20/2024 | Furn/Home Furnishings | |
| WPM | Triangle, descending | 06/04/2024 | 06/27/2024 | Metals and Mining (Div.) | |
| WDAY | Double Bottom, Adam and Eve | 05/30/2024 | 06/13/2024 | Computer Software and Svcs |
![]()
$ $ $
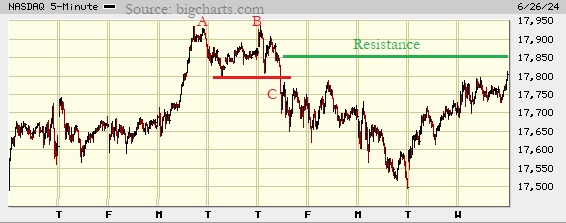
I show a picture of the Nasdaq composite on the 5-minute scale.
At AB, a chart pattern called a double top forms. It confirms as a valid chart pattern when the index closes below the lowest valley between the two peaks. That happens at C.
Other than that pattern, the chart is a yawn. Not much is happening except the index is climbing to overhead resistance which I show as a green line. The line is really an area or zone with the line being near the center of that congestion. As the index rises, look for it to stall or even reverse near that line.
$ $ $
Here's a symbol list of 147 chart and candlestick patterns (13 "investment grade" candle patterns) found in today's securities using my version of Patternz: ANF, ADTN, APD, AA, AEE, AEP, AIG, AMWD, APH, ANIK, ATR, ASH, AIZ, AXS, BSET, BECN, BBY, BMRN, BCO, BR, COR, CENX, CI, CLNE, CLF, CNA, CNO, CONN, COP, CSGS, ^DJT, D, EIX, ELV, EOG, EQT, EXPI, FDX, FE, FISV, FMC, FNV, GES, HSIC, HON, HOV, JBHT, ILMN, INFN, TILE, IPI, JKHY, JNJ, K, LZB, LEG, LNC, L, M, MAN, MRO, MTRX, META, MGEE, MLKN, MOS, MUR, NBR, NI, JWN, NVDA, ORI, ORCL, PATK, PDCO, PETS, PNW, PPL, PFG, PRU, PSTG, KWR, RGA, RLI, RCKY, CRM, SBH, SCCO, SPSC, SCS, SUM, TRGP, TFX, TPX, TDC, TEVA, TREX, UNH, UNM, VC, WOLF, WWW, WDAY, IYC, IYE, IEZ, FXI, ICF, IYH, IEV, MXI, ILF, SLV, IEO, IYF, EWQ, EWH, EWI, EWY, EWP, EWL, EWU, DBA, PHO, XLY, XLE, XLF, GLD, XLV, XHB, XLB, XLU, UNG, VHT, VAW. Click this link for details (pattern type, start and end dates).
For a list of small patterns (those a few days wide) click this link.
$ $ $
The following table shows where Fibonacci retrace values of the day's high-low range are plus pivot points, calculated on the Nasdaq composite, sorted by value. When several are near each other (small differences), the area might act as support or resistance.
-- Thomas Bulkowski, author: Invest for Two-Comma Wealth (#Ad)
![]()
| © 2024 ThePatternSite.com Metric | Value | Diff | Close (within 10% of the high-low range for the day)? |
| Monthly S2 | 15,904.58 | ||
| Monthly S1 | 16,854.87 | 950.29 | |
| Monthly Pivot | 17,395.83 | 540.96 | |
| Weekly S2 | 17,471.29 | 75.46 | |
| Weekly S1 | 17,638.22 | 166.94 | |
| Daily S2 | 17,642.11 | 3.89 | Yes! The Daily S2 is close to the Weekly S1. |
| Low | 17,687.07 | 44.96 | |
| Open | 17,697.27 | 10.20 | Yes! The Open is close to the Low. |
| Daily S1 | 17,723.64 | 26.37 | |
| 61.8% Down from Intraday High | 17,735.38 | 11.75 | Yes! The 61.8% Down from Intraday High is close to the Daily S1. |
| 50% Down from Intraday High | 17,750.31 | 14.93 | |
| 38.2% Down from Intraday High | 17,765.23 | 14.92 | |
| Daily Pivot | 17,768.59 | 3.36 | Yes! The Daily Pivot is close to the 38.2% Down from Intraday High. |
| Weekly Pivot | 17,787.51 | 18.91 | |
| Close | 17,805.16 | 17.65 | |
| High | 17,813.55 | 8.39 | Yes! The High is close to the Close. |
| Daily R1 | 17,850.12 | 36.57 | |
| Daily R2 | 17,895.07 | 44.96 | |
| Weekly R1 | 17,954.44 | 59.37 | |
| Weekly R2 | 18,103.73 | 149.28 | |
| Monthly R1 | 18,346.12 | 242.39 | |
| Monthly R2 | 18,887.08 | 540.96 |
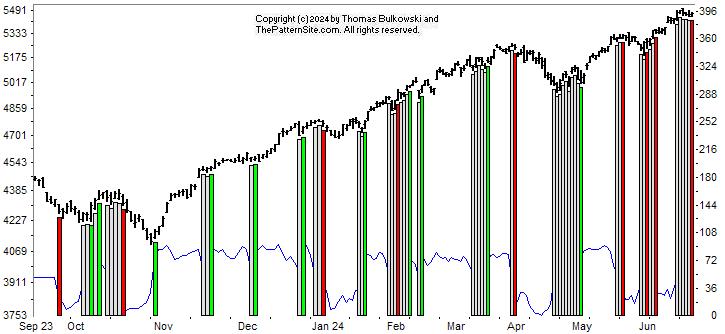
This is a picture of the chart pattern indicator on the daily scale. The indicator is the line chart below a chart of the S&P 500 composite.
The chart shows indecision, I think (![]() that's a joke). The CPI has been cycling between neutral and bearish for about a month now.
During that time, the index has climbed.
that's a joke). The CPI has been cycling between neutral and bearish for about a month now.
During that time, the index has climbed.
The latest reading is bearish but a strong up move could make the signal disappear (which can happen for 7 days).
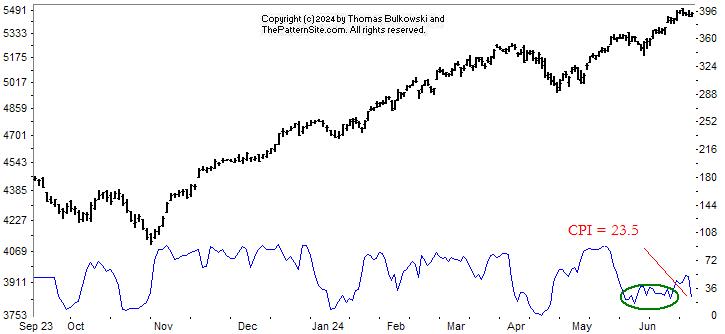
Here's another view of the CPI. Bearish is a reading of 35 or below, with the current reading of 23.5.
Circled in green is where the indicator has remained low for an extended time. As you can see from the rest of the chart, it has not been that low for that long.
I'm not sure what it all means. I'd like to warn of a retrace coming but the index continues to climb. Go figure. (That's called bearish divergence).
$ $ $
Here's a symbol list of 169 chart and candlestick patterns (13 "investment grade" candle patterns) found in today's securities using my version of Patternz: DDD, ANF, AXDX, ACIW, ADTN, APD, ALK, AA, AEP, AIG, AMWD, AMGN, APOG, ASH, AIZ, AVNT, AXS, BBY, BRC, BCO, BR, BG, COR, CENX, CI, CLX, CNA, CNO, CRH, CW, D, DOV, DRQ, ELV, EME, EFX, FISV, FMC, GME, GNW, GMS, GPRO, HLIT, HL, HSII, HSIC, HNI, HD, HON, HOV, HURC, IDA, NSP, IBKR, TILE, IPG, IPI, JNJ, KBH, KMT, LZB, LEG, LNC, L, MLM, MAS, MTRX, MLKN, MOS, MUR, MYGN, NBR, ^IXIC, NEU, JWN, NOC, NVDA, ORI, OTEX, OR, PATK, PDCO, PCTY, PPG, PINC, PFG, PGR, PRU, PEG, PSTG, QCOM, RL, RTX, RGS, RGA, RLI, RCKY, RGLD, SAIC, SMG, SEIC, SLGN, SKX, SCCO, SWX, SPSC, SCS, TPR, TFX, TPX, TDC, TEVA, TSCO, RIG, TREX, UGI, UIS, UPS, UNH, UNM, V, VC, WERN, WU, WMB, WSM, WOLF, WWW, WDAY, IYM, IYK, IDU, FXI, ICF, IYH, IHF, MXI, ILF, SLV, EWH, EIS, EWJ, EWW, PHO, XLY, XLV, XHB, XLB, XLK, VHT, VAW, MGK. Click this link for details (pattern type, start and end dates).
For a list of small patterns (those a few days wide) click this link.
-- Thomas Bulkowski, author: Invest for Two-Comma Wealth (#Ad)
![]()
$ $ $
I show another slider trading quiz featuring Three rising valleys.
$ $ $
Here's a symbol list of 115 chart and candlestick patterns (13 "investment grade" candle patterns) found in today's securities using my version of Patternz: DDD, ANF, ADTN, AFL, AMZN, AMAT, ACGL, ATO, AVY, BMI, BERY, BIO, BA, BKNG, BRKR, BBW, CALM, CAL, CRL, CI, CINF, CGNX, CTSH, CMTL, CRH, CROX, D, EMN, EXC, EZPW, FARO, FLS, GFS, HBI, HIG, HE, HD, HURC, ILMN, INFN, NSP, IIIN, ITGR, INTC, IPI, KBH, KELYA, MCHX, MTRX, MCO, MYGN, NJR, NEE, NI, NOC, NUS, ORI, OTEX, OR, OMI, PKG, PYPL, PNW, PPG, PFG, PRU, QCOM, RTX, RGLD, RES, SO, SCS, TGT, TFX, TXN, TSCO, TZOO, TG, SLCA, WERN, WLK, WWW, ITA, IYC, IYE, FXI, BOTZ, ICF, IYH, IGE, IEO, EWA, ECH, EIS, THD, IBB, DBA, PBE, PXJ, PHO, ROBO, XLY, XLP, XLE, XRT, USO, VHT, VIS. Click this link for details (pattern type, start and end dates).
For a list of small patterns (those a few days wide) click this link.
$ $ $
The following table shows where Fibonacci retrace values of the day's high-low range are plus pivot points, calculated on the Dow industrials, sorted by value. When several are near each other (small differences), the area might act as support or resistance.
-- Thomas Bulkowski, author: Invest for Two-Comma Wealth (#Ad)
![]()
| © 2024 ThePatternSite.com Metric | Value | Diff | Close (within 10% of the high-low range for the day)? |
| Monthly S2 | 37,086.75 | ||
| Weekly S2 | 38,208.21 | 1,121.46 | |
| Monthly S1 | 38,248.98 | 40.77 | |
| Weekly S1 | 38,809.71 | 560.73 | |
| Daily S2 | 39,002.24 | 192.52 | |
| Weekly Pivot | 39,033.45 | 31.21 | Yes! The Weekly Pivot is close to the Daily S2. |
| Monthly Pivot | 39,163.19 | 129.75 | |
| Low | 39,184.49 | 21.30 | Yes! The Low is close to the Monthly Pivot. |
| Open | 39,184.49 | 0.00 | Yes! The Open is close to the Low. |
| Daily S1 | 39,206.72 | 22.23 | Yes! The Daily S1 is close to the Open. |
| 61.8% Down from Intraday High | 39,332.23 | 125.50 | |
| 50% Down from Intraday High | 39,377.86 | 45.63 | |
| Daily Pivot | 39,388.98 | 11.12 | Yes! The Daily Pivot is close to the 50% Down from Intraday High. |
| Close | 39,411.21 | 22.23 | Yes! The Close is close to the Daily Pivot. |
| 38.2% Down from Intraday High | 39,423.50 | 12.29 | Yes! The 38.2% Down from Intraday High is close to the Close. |
| High | 39,571.23 | 147.73 | |
| Daily R1 | 39,593.46 | 22.23 | Yes! The Daily R1 is close to the High. |
| Weekly R1 | 39,634.95 | 41.48 | |
| Daily R2 | 39,775.71 | 140.77 | |
| Weekly R2 | 39,858.68 | 82.96 | |
| Monthly R1 | 40,325.42 | 466.75 | |
| Monthly R2 | 41,239.63 | 914.21 |
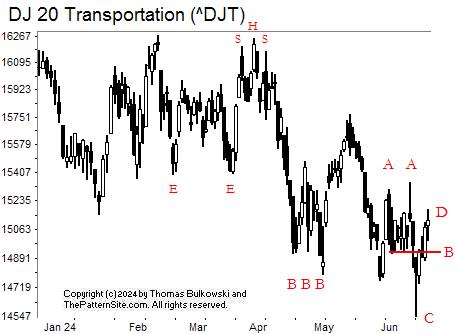
This is a busy pic of the Dow transports on the daily scale.
Starting from the left, we see a confirmed double bottom at EE. The index didn't climb far enough after the upward breakout before it reversed at a head-and-shoulders top.
I show that with S for the shoulders and H for the head. The index tumbled substantially after this pattern, bottoming at a triple bottom, shown here as BBB. Recovery led the index higher but not as high as the measure rule suggested. (Measure rule: the height of the pattern added to the top of it gives an upward breakout target).
The index made a twin-peak pattern that I call an Adam & Adam double top, shown here as AA. The pattern confirmed at B when the index closed below the lowest valley between the two peaks.
The index bottomed at C and pulled back to D. According to my book, Encyclopedia of Chart Patterns, 3rd Edition, price resumes dropping 54% of the time. So a resumption of the downtrend is the way to bet.
![]()
The following is a brief review of how the markets performed over time. The numbers refer to the close-to-close move in the Dow industrials.
No options expire this week.
![]()
The following is based on an SFO article in December 2004 by John Seekinger, titled, "Take a two-dimensional approach." He offers these tips.
| Index | S2 | S1 | Pivot | R1 | R2 |
| Dow Industrials (^DJI): Daily | 38,961 | 39,056 | 39,156 | 39,251 | 39,352 |
| Weekly | 38,121 | 38,636 | 38,946 | 39,461 | 39,772 |
| Monthly | 37,000 | 38,075 | 39,076 | 40,152 | 41,153 |
| S&P500 (^GSPC): Daily | 5,439 | 5,452 | 5,465 | 5,478 | 5,491 |
| Weekly | 5,378 | 5,422 | 5,464 | 5,507 | 5,549 |
| Monthly | 5,073 | 5,269 | 5,387 | 5,583 | 5,701 |
| Nasdaq (^IXIC): Daily | 17,532 | 17,611 | 17,699 | 17,778 | 17,866 |
| Weekly | 17,433 | 17,561 | 17,749 | 17,877 | 18,065 |
| Monthly | 15,866 | 16,778 | 17,357 | 18,269 | 18,848 |
Here are the formulas:
![]()
Earnings season is over.
Here's a symbol list of 150 chart and candlestick patterns (13 "investment grade" candle patterns) found in today's securities using my version of Patternz: DDD, ANF, ADTN, AEIS, AES, AA, AEE, AFG, AR, APOG, ADM, AGO, BECN, BMRN, BA, BMY, BRKR, CDNS, CAL, CPB, CLS, CNP, CI, CSCO, CLNE, CNA, CNO, CGNX, CMTL, COST, CCRN, D, EG, EVRG, EXC, EZPW, FDS, FLEX, FLS, GILD, GPN, GS, GES, HLIT, HSII, HOLX, HOV, ILMN, PODD, IPAR, INTU, JNJ, KELYA, KLAC, KSS, LHX, LRCX, LLY, RAMP, LPLA, MAN, MCHX, MKTX, MDT, MRK, MGEE, MU, MYGN, ^IXIC, NUS, NVDA, OXY, OTEX, PKG, PANW, PTEN, PYPL, PETS, PCG, PNW, PLXS, PPG, PPL, PRU, PEG, PSTG, RLI, ROP, ^GSPC, SAND, SLB, SWX, SWN, SR, SNPS, TRGP, TECH, TPX, TDC, TXN, TSCO, RIG, SLCA, UIS, VLO, VECO, VC, WPM, WMB, WSC, WOLF, WWD, IYC, IDU, FTEC, QQQ, IXN, SOXX, IHI, EWH, EIS, EWJ, EZA, THD, TUR, QLD, IBB, DBA, PBE, PJP, SSO, ROBO, SPY, XAR, XLK, XLU, USO, SMH, VHT, MGK. Click this link for details (pattern type, start and end dates).
For a list of small patterns (those a few days wide) click this link.
The below industries were the best (rank 1) or worst performing of those I follow.
|
-- Thomas Bulkowski, author: Invest for Two-Comma Wealth and the novel (fiction), Training "Miles" (#Ad)
![]()
$ $ $
Here's a symbol list of 138 chart and candlestick patterns (13 "investment grade" candle patterns) found in today's securities using my version of Patternz: DDD, ABT, ANF, ACN, ACIW, AMD, ATSG, ALB, APH, APOG, AGO, AVA, BAX, BECN, BERY, BA, CDNS, CAL, CLS, CNO, CGNX, CTSH, COST, CRH, CROX, CCRN, CMI, DVN, ^DJT, WIRE, EPAM, EXPI, EZPW, FLEX, FORM, FCX, GMS, GS, GPRO, GES, HIG, HQY, HOLX, HOV, HWM, ILMN, INFN, ITGR, JKHY, JAZZ, KELYA, KLAC, LRCX, LEG, LLY, MTSI, MCHX, MKTX, MTRN, MDT, MU, MCO, MOS, MYGN, ^IXIC, NFG, NFLX, NEU, NOC, NUS, NVDA, OMCL, ASGN, ON, OTEX, PKG, PDCO, PCTY, PYPL, PSTG, ^GSPC, SBH, SKYW, SCS, SSYS, SNPS, TPX, TMO, TSCO, RIG, VFC, VECO, WMT, WMB, WOLF, WWD, FTEC, QTEC, FXL, FXI, BOTZ, QQQ, IHF, IYZ, MXI, IXN, SOXX, ITB, EWO, ECH, EIS, EWI, EZA, EWT, EWU, QLD, DBA, PEJ, PJP, SSO, GLD, SPY, XLK, USO, SMH, MGK, VONG. Click this link for details (pattern type, start and end dates).
For a list of small patterns (those a few days wide) click this link.
$ $ $
You can find setups based on a Fibonacci retrace by clicking on the link.
The following patterns were found manually, not using Patternz. Mr. Bulkowski has excluded any securities he owns from appearing in the list. However, he may add any of the securities listed to his portfolio at any time, just as you can.
In the table below, the red and green colors are based on the historical breakout direction for the associated chart pattern. If a high and tight flag appears, the start and end dates highlight the flagpole only and not the flag.
For details about the chart patterns, click here.
-- Thomas Bulkowski, author: Invest for Two-Comma Wealth (#Ad)
![]()
| Symbol | Chart Pattern | Bullish Bearish | Start | End | Industry |
| ACN | Double Bottom, Eve and Eve | 05/31/2024 | 06/14/2024 | IT Services | |
| ACIW | Broadening bottom | 05/29/2024 | 06/20/2024 | IT Services | |
| ADBE | Pipe bottom | 05/28/2024 | 06/03/2024 | Computer Software and Svcs | |
| AR | Head-and-shoulders top | 05/20/2024 | 06/12/2024 | Natural Gas (Diversified) | |
| ARW | Double Top, Eve and Eve | 05/23/2024 | 06/12/2024 | Electronics | |
| BCPC | Triangle, symmetrical | 06/05/2024 | 06/20/2024 | Chemical (Specialty) | |
| BSET | Pipe top | 05/28/2024 | 06/03/2024 | Furn/Home Furnishings | |
| BA | Pipe top | 06/03/2024 | 06/10/2024 | Aerospace/Defense | |
| BBW | Broadening top | 03/18/2024 | 04/30/2024 | Retail (Special Lines) | |
| CACI | Triple bottom | 05/30/2024 | 06/10/2024 | IT Services | |
| CALM | Double Top, Adam and Eve | 05/22/2024 | 06/03/2024 | Food Processing | |
| CLS | Pipe bottom | 06/03/2024 | 06/10/2024 | Electronics | |
| CNX | Double Top, Adam and Adam | 06/03/2024 | 06/12/2024 | Natural Gas (Diversified) | |
| CTSH | Double Bottom, Adam and Adam | 05/30/2024 | 06/17/2024 | IT Services | |
| CMTL | Flag, high and tight | 04/23/2024 | 06/18/2024 | Telecom. Equipment | |
| CONN | Head-and-shoulders top | 05/09/2024 | 06/03/2024 | Retail (Special Lines) | |
| CTS | Triple top | 05/22/2024 | 06/05/2024 | Electronics | |
| DECK | Pipe top | 05/28/2024 | 06/03/2024 | Shoe | |
| ^DJT | Double Top, Adam and Adam | 06/03/2024 | 06/12/2024 | None | |
| ^DJI | Double Top, Adam and Adam | 06/07/2024 | 06/12/2024 | None | |
| DTE | Head-and-shoulders top | 05/10/2024 | 06/03/2024 | Electric Utility (Central) | |
| EIX | Double Top, Eve and Eve | 05/21/2024 | 06/03/2024 | Electric Utility (West) | |
| FICO | Double Bottom, Eve and Eve | 05/31/2024 | 06/11/2024 | IT Services | |
| IT | Pipe bottom | 05/28/2024 | 06/03/2024 | IT Services | |
| GILD | Double Bottom, Adam and Eve | 05/31/2024 | 06/18/2024 | Biotechnology | |
| GL | Pipe top | 05/06/2024 | 05/13/2024 | Insurance (Life) | |
| GGG | Head-and-shoulders complex bottom | 05/29/2024 | 06/14/2024 | Machinery | |
| HURC | Broadening top, right-angled and descending | 05/06/2024 | 06/03/2024 | Machinery | |
| JAZZ | Double Bottom, Adam and Eve | 05/02/2024 | 05/29/2024 | Biotechnology | |
| LH | Triple bottom | 05/31/2024 | 06/13/2024 | Medical Services | |
| MHO | Pipe top | 05/13/2024 | 05/20/2024 | Homebuilding | |
| MTSI | Pipe bottom | 04/15/2024 | 04/22/2024 | Semiconductor | |
| MKTX | Diamond bottom | 05/31/2024 | 06/20/2024 | Securities Brokerage | |
| MDT | Pipe top | 05/13/2024 | 05/20/2024 | Medical Supplies | |
| MCO | Ugly double bottom | 05/02/2024 | 05/31/2024 | Information Services | |
| NFLX | Diamond top | 05/21/2024 | 06/11/2024 | Internet | |
| NWL | Double Top, Adam and Adam | 06/03/2024 | 06/12/2024 | Household Products | |
| OXY | Double Bottom, Eve and Eve | 06/04/2024 | 06/14/2024 | Petroleum (Producing) | |
| ON | Double Top, Adam and Adam | 05/22/2024 | 06/12/2024 | Semiconductor | |
| PYPL | Head-and-shoulders top | 03/27/2024 | 06/07/2024 | Financial Services | |
| DGX | Head-and-shoulders top | 04/29/2024 | 06/06/2024 | Medical Services | |
| RRC | Head-and-shoulders top | 04/25/2024 | 06/12/2024 | Petroleum (Producing) | |
| RJF | Double Top, Adam and Eve | 04/24/2024 | 05/15/2024 | Securities Brokerage | |
| SRE | Triangle, symmetrical | 05/21/2024 | 06/17/2024 | Electric Utility (West) | |
| SWN | Double Top, Eve and Adam | 05/16/2024 | 06/03/2024 | Natural Gas (Diversified) | |
| TFX | Double Top, Eve and Eve | 05/15/2024 | 06/06/2024 | Diversified Co. | |
| TSCO | Pipe bottom | 06/03/2024 | 06/10/2024 | Retail Building Supply | |
| V | Triangle, symmetrical | 05/03/2024 | 06/20/2024 | Financial Services | |
| WWW | Horn top | 05/13/2024 | 05/28/2024 | Shoe | |
| IGV | Pipe bottom | 05/28/2024 | 06/03/2024 | Computer Software and Svcs |
![]()
$ $ $
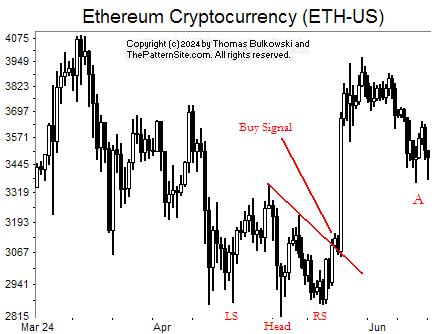
I show a picture of Ethereum (ETH-USD) on the daily scale.
A head-and-shoulders bottom chart pattern happened in April-May and the resulting rise was nice to see.
After that, the currency peaked and has retraced to A. 'A' shows a potential double bottom chart pattern. It becomes valid when the currency closes above the peak between the two valleys. If that happens, then expect the currency to rise even farther, say, to 3800 (or higher).
$ $ $
Here's a symbol list of 129 chart and candlestick patterns (13 "investment grade" candle patterns) found in today's securities using my version of Patternz: DDD, ABT, ANF, ABM, ALKS, DOX, ACGL, AWI, ARW, AVY, AVNT, AZTA, BMI, BALL, BA, BRC, BFH, BCO, CAL, CE, CLS, CNP, CVX, CTAS, CLF, CNX, CGNX, CTSH, CMCO, CMTL, ED, CXW, CCRN, CMI, CW, D, EBAY, ECL, EIX, ELV, EZPW, FICO, FARO, FE, FLS, GIS, GILD, GPN, GFS, GGG, GES, HBI, HLIT, HIG, HOLX, HD, HOV, JBHT, ILMN, ITGR, JAZZ, LNC, LPLA, LXU, MTSI, M, MGY, MDT, MU, MCO, NFLX, NEE, NOVT, NUS, ASGN, OTEX, PDCO, PYPL, PNW, QCOM, RJF, SAIA, SAIC, SEIC, SIGI, TPX, TTD, TJX, TSCO, TDG, TG, TREX, UPS, VLO, WU, WMB, ITA, IDU, FTEC, QQQ, IHF, IAT, MXI, SLV, EWK, EWQ, EZA, EWL, EWT, QLD, PPA, ROBO, XLI, XAR, XLK, XLU, UNG, VIS, MGK, VONG. Click this link for details (pattern type, start and end dates).
For a list of small patterns (those a few days wide) click this link.
$ $ $
The following table shows where Fibonacci retrace values of the day's high-low range are plus pivot points, calculated on the Nasdaq composite, sorted by value. When several are near each other (small differences), the area might act as support or resistance.
-- Thomas Bulkowski, author: Invest for Two-Comma Wealth (#Ad)
![]()
| © 2024 ThePatternSite.com Metric | Value | Diff | Close (within 10% of the high-low range for the day)? |
| Monthly S2 | 15,850.90 | ||
| Monthly S1 | 16,856.57 | 1,005.66 | |
| Weekly S2 | 16,869.33 | 12.76 | |
| Monthly Pivot | 17,299.18 | 429.85 | |
| Weekly S1 | 17,365.78 | 66.60 | |
| Weekly Pivot | 17,553.79 | 188.01 | |
| Daily S2 | 17,756.24 | 202.45 | |
| Low | 17,796.88 | 40.64 | |
| Daily S1 | 17,809.23 | 12.35 | |
| 61.8% Down from Intraday High | 17,832.65 | 23.42 | |
| 50% Down from Intraday High | 17,843.70 | 11.05 | |
| Daily Pivot | 17,849.88 | 6.18 | Yes! The Daily Pivot is close to the 50% Down from Intraday High. |
| 38.2% Down from Intraday High | 17,854.75 | 4.87 | Yes! The 38.2% Down from Intraday High is close to the Daily Pivot. |
| Open | 17,856.76 | 2.01 | Yes! The Open is close to the 38.2% Down from Intraday High. |
| Close | 17,862.23 | 5.47 | Yes! The Close is close to the Open. |
| High | 17,890.52 | 28.29 | |
| Daily R1 | 17,902.87 | 12.35 | |
| Daily R2 | 17,943.52 | 40.64 | |
| Weekly R1 | 18,050.24 | 106.72 | |
| Weekly R2 | 18,238.25 | 188.01 | |
| Monthly R1 | 18,304.85 | 66.60 | |
| Monthly R2 | 18,747.46 | 442.62 |

I uploaded new versions of the book (paperback and e-book) with proofreading and formatting errors corrected. The new version should appear at Amazon.com by this Saturday, June 22. I also shoved the e-book in Kindle Select or whatever they call it, so some of you can download it for free. Otherwise, the cost is $3.99 for the e-book and $9.99 for the print version.
Here's what I wrote about Training "Miles" (#ad) on Amazon:
It’s hard growing up male, especially with twenty-four sisters!
Miles is a crystal ball, the runt of the litter. He wants to be good and protect others from harm.
Sister Sindy has other ideas. She’s the family bully.
When Miles leaves the family to help an autistic girl, will Sindy help too, or will she cost him his life?
Find out by reading this heartwarming—and fast paced—novel about the life of crystal balls that will delight you as often as it will brings tears.
This book is suitable for young adults—and older—who believe in possibilities.
One reader wrote, "It did not disappoint. I read the entire book in one sitting." -- DJB

Invest for Two-Comma Wealth (#ad) is available too, from Amazon.com at the link.
I self-published this book (instead of using a traditional publisher), which is why the book is available in print form for $20 instead of $60.
Invest for Two-Comma Wealth ($1,000,000) is an entry-level yet comprehensive book about investing in the securities markets to grow your net worth. From annuities, bonds, and CDs, to common stocks, meme stocks, and cryptocurrency, the book explains each topic in an easy-to-understand manner.
It teaches you about scams, and how to avoid them, including those “free” lunch seminars. It explains why owning your home may not be a good investment and buying gold coins with huge sales charges put you at a disadvantage.
Use the information in this book to invest for the long term and discover that one day you’ve joined the two-comma club.
Price $20, print only, 300+ pages. This will not be available as an e-book.
![]()
$ $ $
I show another slider trading quiz featuring inverted and descending scallops.
$ $ $
Here's a symbol list of 125 chart and candlestick patterns (13 "investment grade" candle patterns) found in today's securities using my version of Patternz: DDD, ADBE, AES, AMZN, AEP, AXP, ANIK, AR, AON, AGO, ADSK, AVY, AVNT, BSET, BBY, BFH, CENX, CINF, CTAS, CNO, CNX, CGNX, CTSH, GLW, CRH, CROX, CCRN, CSGS, D, DTE, EBAY, EIX, EVH, EZPW, FE, FLEX, FCX, IT, GNW, GMS, GES, THG, HIG, HE, HQY, HOLX, HUN, IDA, IDXX, INCY, INFN, IIIN, INTU, JKHY, K, LEG, LLY, L, LOW, MTSI, MANH, MAN, MTRN, MDT, MGEE, MS, NFLX, NTAP, NWL, NEE, NKE, NUS, ORI, OLN, ASGN, ON, ORCL, OMI, PFE, PCG, PPL, PGR, RNG, RCKY, ROG, SBH, NOW, SLGN, SWN, TTD, TSCO, V, WSO, WWW, WWD, XEL, IAI, IYC, IDU, QTEC, IGV, ECH, EWJ, EWM, EWT, THD, PEJ, ROBO, XLY, XLU, UNG, VAW. Click this link for details (pattern type, start and end dates).
For a list of small patterns (those a few days wide) click this link.
$ $ $
The following table shows where Fibonacci retrace values of the day's high-low range are plus pivot points, calculated on the Dow industrials, sorted by value. When several are near each other (small differences), the area might act as support or resistance.
-- Thomas Bulkowski, author: Invest for Two-Comma Wealth (#Ad)
![]()
| © 2024 ThePatternSite.com Metric | Value | Diff | Close (within 10% of the high-low range for the day)? |
| Monthly S2 | 36,875.71 | ||
| Monthly S1 | 37,826.91 | 951.19 | |
| Weekly S2 | 37,920.33 | 93.42 | |
| Daily S2 | 38,275.38 | 355.05 | |
| Weekly S1 | 38,349.21 | 73.84 | |
| Low | 38,431.95 | 82.73 | |
| Daily S1 | 38,526.74 | 94.79 | |
| Open | 38,565.18 | 38.44 | Yes! The Open is close to the Daily S1. |
| 61.8% Down from Intraday High | 38,587.78 | 22.60 | Yes! The 61.8% Down from Intraday High is close to the Open. |
| 50% Down from Intraday High | 38,635.91 | 48.13 | |
| Daily Pivot | 38,683.31 | 47.39 | |
| 38.2% Down from Intraday High | 38,684.05 | 0.74 | Yes! The 38.2% Down from Intraday High is close to the Daily Pivot. |
| Weekly Pivot | 38,734.74 | 50.69 | |
| Close | 38,778.10 | 43.36 | |
| High | 38,839.88 | 61.78 | |
| Daily R1 | 38,934.67 | 94.79 | |
| Monthly Pivot | 38,952.15 | 17.48 | Yes! The Monthly Pivot is close to the Daily R1. |
| Daily R2 | 39,091.24 | 139.09 | |
| Weekly R1 | 39,163.63 | 72.39 | |
| Weekly R2 | 39,549.15 | 385.52 | |
| Monthly R1 | 39,903.35 | 354.20 | |
| Monthly R2 | 41,028.59 | 1,125.25 |
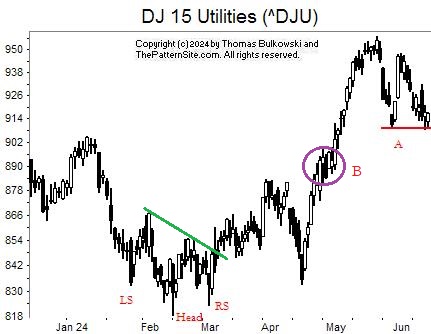
I show the Dow utilities on the daily scale, but there's not a lot going on.
Earlier in the year we see a head-and-shoulders bottom chart pattern, marked as LS (left shoulder), head, and RS (right shoulder). It confirms as a valid chart pattern when price closes above the green neckline in March.
After that, price takes its time before it starts a strong uptrend in April, peaking in May.
Now, the index is resting on support, which I show as a horizontal red line. I don't know if this support will hold or not (meaning if the index will bounce higher or just plunge through). I don't have a lot of confidence that it'll bounce. I expect a drop.
If it does plunge through, then look for it to find support at the violet circle, at B.
![]()
The following is a brief review of how the markets performed over time. The numbers refer to the close-to-close move in the Dow industrials.
Many options expire this week, so traders will be looking to close out their positions, and that suggests increased volatility (large daily price swings).
![]()
The following is based on an SFO article in December 2004 by John Seekinger, titled, "Take a two-dimensional approach." He offers these tips.
| Index | S2 | S1 | Pivot | R1 | R2 |
| Dow Industrials (^DJI): Daily | 38,207 | 38,398 | 38,497 | 38,688 | 38,786 |
| Weekly | 37,857 | 38,223 | 38,672 | 39,038 | 39,486 |
| Monthly | 36,813 | 37,701 | 38,889 | 39,777 | 40,966 |
| S&P500 (^GSPC): Daily | 5,394 | 5,413 | 5,423 | 5,441 | 5,451 |
| Weekly | 5,282 | 5,357 | 5,402 | 5,477 | 5,522 |
| Monthly | 5,101 | 5,266 | 5,357 | 5,522 | 5,612 |
| Nasdaq (^IXIC): Daily | 17,555 | 17,622 | 17,658 | 17,725 | 17,760 |
| Weekly | 16,812 | 17,250 | 17,496 | 17,935 | 18,180 |
| Monthly | 15,793 | 16,741 | 17,241 | 18,189 | 18,690 |
Here are the formulas:
![]()
Earnings season is over.
Here's a symbol list of 180 chart and candlestick patterns (13 "investment grade" candle patterns) found in today's securities using my version of Patternz: DDD, ADBE, AES, ATSG, ALRM, AA, AEE, AEP, ANIK, AR, ATR, AVNT, AVA, BSET, BIG, CPB, COR, CENX, CDAY, CHD, CIEN, CI, CTAS, CNA, CNO, CTSH, CMCO, ED, COST, CTS, DSGR, D, DRQ, DUK, BOOM, EIX, EPAM, EQT, EVH, EXPI, EZPW, FAST, FCX, FDP, IT, GNW, GILD, GFS, GL, GS, GOOGL, GPRO, GGG, GES, THG, HAYN, HELE, HP, HNI, HOLX, HWM, HURC, IDA, ITW, INFN, IPAR, IPI, ISRG, JBLU, K, KMT, LZB, LANC, LEG, LNC, RAMP, LXU, MCHX, MTRN, MGEE, MS, NFLX, NTGR, NWL, NEE, NWPX, ORCL, PATK, PETS, PFE, POR, PPL, PEG, PSTG, RJF, RLI, ROL, RES, R, SAIA, SBH, SEIC, NOW, SLGN, SWN, SR, SXI, TPR, TGT, RIG, TZOO, UHAL, VRTX, WU, WWW, ITA, IAI, FTEC, FXI, BOTZ, QQQ, IEV, IGV, MXI, IXN, IYF, EWO, EWK, ECH, EWQ, EWG, EWH, EIS, EWI, EWM, EPP, EWS, EZA, EWP, EWD, EWU, QLD, PPA, PEJ, PXJ, PJP, ROBO, GLD, XLB, XRT, XAR, XLK, UNG, VAW, MGK, VONG. Click this link for details (pattern type, start and end dates).
For a list of small patterns (those a few days wide) click this link.
The below industries were the best (rank 1) or worst performing of those I follow.
|
-- Thomas Bulkowski, author: Invest for Two-Comma Wealth and the novel (fiction), Training "Miles" (#Ad)
![]()
$ $ $
Here's a symbol list of 133 chart and candlestick patterns (13 "investment grade" candle patterns) found in today's securities using my version of Patternz: DDD, ABT, AXDX, ADBE, AES, ATSG, AMZN, AEE, AMGN, ANIK, AR, ANET, ASH, AVA, BALL, BSET, BIG, BMY, BG, CDAY, CVX, CIEN, CNA, CL, ED, COST, CROX, CCK, DHR, DDS, DSGR, D, EIX, EPAM, EQT, EVH, EXPI, XOM, EZPW, FISV, FCX, FDP, IT, GIS, GNW, GILD, GL, GPRO, GFF, GES, HE, HP, HSIC, IDA, ITW, INFN, NSP, INTC, IPI, JKHY, JAZZ, JBLU, K, KMB, LEG, RAMP, LXU, MRO, MLM, MAS, MTDR, MRK, MRCY, MSFT, MS, MUR, NBR, NFG, NFLX, NTGR, NTAP, NJR, NEE, NVDA, OXY, OTEX, ORCL, OMI, PANW, PFE, QTWO, RRC, RJF, RGS, RES, SAIA, NOW, SMAR, SCCO, SWN, SPSC, SSYS, TGT, VLO, WERN, WU, WWW, FDN, QTEC, FXI, BOTZ, IHF, IGV, SLV, IHI, TUR, PPA, PEJ, XLU, UNG. Click this link for details (pattern type, start and end dates).
For a list of small patterns (those a few days wide) click this link.
$ $ $
You can find setups based on a Fibonacci retrace by clicking on the link.
The following patterns were found manually, not using Patternz. Mr. Bulkowski has excluded any securities he owns from appearing in the list. However, he may add any of the securities listed to his portfolio at any time, just as you can.
In the table below, the red and green colors are based on the historical breakout direction for the associated chart pattern. If a high and tight flag appears, the start and end dates highlight the flagpole only and not the flag.
For details about the chart patterns, click here.
-- Thomas Bulkowski, author: Invest for Two-Comma Wealth (#Ad) ![]()
![]()
| Symbol | Chart Pattern | Bullish Bearish | Start | End | Industry |
| AXP | Head-and-shoulders top | 04/24/2024 | 06/03/2024 | Financial Services | |
| AFG | Double Top, Adam and Adam | 05/31/2024 | 06/07/2024 | Insurance (Prop/Casualty) | |
| ARCB | Double Bottom, Adam and Adam | 05/29/2024 | 06/06/2024 | Trucking/Transp. Leasing | |
| ADM | Diamond top | 05/17/2024 | 06/11/2024 | Food Processing | |
| ANET | Double Bottom, Adam and Eve | 05/23/2024 | 06/03/2024 | E-Commerce | |
| AVNT | Broadening bottom | 05/29/2024 | 06/13/2024 | Chemical (Specialty) | |
| AZTA | Head-and-shoulders bottom | 04/18/2024 | 05/24/2024 | Semiconductor Cap Equip. | |
| BRC | Double Top, Eve and Eve | 05/23/2024 | 05/31/2024 | Chemical (Diversified) | |
| BFH | Diamond top | 05/03/2024 | 06/06/2024 | Information Services | |
| CENX | Double Top, Adam and Eve | 05/21/2024 | 05/31/2024 | Metals and Mining (Div.) | |
| CHKP | Double Bottom, Adam and Adam | 05/14/2024 | 05/31/2024 | E-Commerce | |
| CAG | Double Top, Eve and Eve | 04/05/2024 | 04/25/2024 | Food Processing | |
| CXW | Dead-cat bounce | 06/11/2024 | 06/11/2024 | Industrial Services | |
| CCK | Double Top, Adam and Eve | 04/30/2024 | 05/21/2024 | Packaging and Container | |
| D | Double Top, Eve and Eve | 05/21/2024 | 06/03/2024 | Electric Utility (East) | |
| EXP | Falling wedge | 05/21/2024 | 06/11/2024 | Cement and Aggregates | |
| EFX | Double Bottom, Eve and Eve | 05/31/2024 | 06/11/2024 | Information Services | |
| FARO | Broadening bottom | 04/23/2024 | 05/09/2024 | Precision Instrument | |
| FDX | Rectangle bottom | 05/29/2024 | 06/13/2024 | Air Transport | |
| FORM | Double Bottom, Adam and Adam | 06/04/2024 | 06/10/2024 | Semiconductor | |
| FWRD | Flag, high and tight | 05/21/2024 | 06/11/2024 | Trucking/Transp. Leasing | |
| GD | Head-and-shoulders top | 05/21/2024 | 06/06/2024 | Aerospace/Defense | |
| GE | Double Top, Eve and Eve | 05/07/2024 | 05/24/2024 | Diversified Co. | |
| HAYN | Triangle, symmetrical | 05/15/2024 | 06/10/2024 | Building Materials | |
| HNI | Double Top, Adam and Adam | 05/15/2024 | 06/03/2024 | Furn/Home Furnishings | |
| HD | Double Bottom, Eve and Eve | 05/29/2024 | 06/07/2024 | Retail Building Supply | |
| TILE | Pipe top | 05/28/2024 | 06/03/2024 | Furn/Home Furnishings | |
| IPG | Head-and-shoulders top | 04/24/2024 | 06/03/2024 | Advertising | |
| LEG | Pipe bottom | 05/20/2024 | 05/28/2024 | Furn/Home Furnishings | |
| MCHX | Triangle, ascending | 03/15/2024 | 06/05/2024 | Advertising | |
| MLI | Head-and-shoulders complex top | 04/24/2024 | 06/03/2024 | Metal Fabricating | |
| NEE | Pipe top | 05/28/2024 | 06/03/2024 | Electric Utility (East) | |
| OMC | Triple top | 03/28/2024 | 05/15/2024 | Advertising | |
| ORCL | Pipe bottom | 05/28/2024 | 06/03/2024 | Computer Software and Svcs | |
| OUT | Falling wedge | 05/01/2024 | 06/11/2024 | Advertising | |
| OXM | Horn bottom | 04/01/2024 | 04/15/2024 | Apparel | |
| PDCO | Diamond bottom | 04/23/2024 | 05/16/2024 | Medical Supplies | |
| PETS | Broadening top, right-angled and ascending | 05/28/2024 | 06/13/2024 | Medical Services | |
| PFE | Double Top, Adam and Eve | 05/22/2024 | 06/04/2024 | Drug | |
| PRU | Double Top, Eve and Eve | 05/17/2024 | 06/03/2024 | Insurance (Life) | |
| RLI | Triple top | 05/07/2024 | 05/17/2024 | Insurance (Prop/Casualty) | |
| SMTC | Dead-cat bounce | 06/07/2024 | 06/07/2024 | Semiconductor Cap Equip. | |
| SWX | Head-and-shoulders top | 05/10/2024 | 06/03/2024 | Natural Gas (Distributor) | |
| TTD | Broadening top | 05/20/2024 | 06/13/2024 | Advertising | |
| TKR | Double Top, Adam and Eve | 04/30/2024 | 05/15/2024 | Metal Fabricating | |
| TDG | Triple top | 05/28/2024 | 06/06/2024 | Aerospace/Defense | |
| UNM | Double Top, Eve and Adam | 04/02/2024 | 06/03/2024 | Insurance (Diversified) | |
| WERN | Broadening top, right-angled and ascending | 05/21/2024 | 06/12/2024 | Trucking/Transp. Leasing | |
| WMB | Rising wedge | 05/24/2024 | 06/13/2024 | Natural Gas (Distributor) |
![]()
Since I post this the night before, check how the futures are trading before market open. Large moves can affect the opening direction.
$ $ $
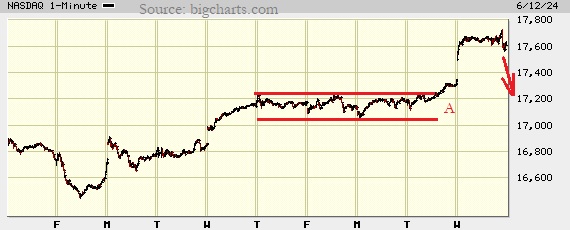
I show a picture of the Nasdaq composite on the 5-minute scale.
At A, a long rectangle top appears. The word on the street says that inflation is slowing. That pushed higher the Nasdaq on the open (Today, Wednesday).
However, I expect the index to drift back lower to the A region. That's based on a measured move up chart pattern.
When the pattern completes, the stock will return to A (the corrective phase) 57% of the time, according to my research and reported in my book, Encyclopedia of Chart Patterns, 3rd Edition (#ad).
$ $ $
Here's a symbol list of 243 chart and candlestick patterns (13 "investment grade" candle patterns) found in today's securities using my version of Patternz: DDD, ABM, ADBE, ADTN, AES, ALB, ALKS, ALL, AMZN, AMED, AEE, AEP, AME, APH, ANIK, AR, AON, APOG, AMAT, ARCB, ASH, AGO, AVA, AZTA, BSET, BECN, BBY, BIO, BKH, BA, BRC, BFH, BCO, BMY, CDNS, CX, CVX, CI, CTAS, CSCO, CLNE, CLX, CNO, ED, CAG, COP, COST, CRH, CROX, CCK, CSGS, ^DJU, ^DJT, D, DRQ, DUK, EMN, ECL, ELV, EQT, EVH, EXC, XOM, EZPW, FARO, FDX, FIS, FMC, FTNT, FDP, IT, GIS, GNW, GILD, GS, GGG, HBI, HE, HQY, HP, HSIC, HOLX, HD, DHI, HUN, IDA, IDXX, ILMN, INFN, ITGR, INTC, IPAR, TILE, ISRG, KBH, K, KMB, KLAC, LRCX, LANC, LEN, LNC, MTSI, M, MAN, MRO, MA, MTDR, MRK, MGEE, MU, MSFT, MCO, MOS, ^IXIC, NFG, NJR, NEE, NKE, NI, NUS, OXY, OMC, ON, ORCL, OXM, PYPL, PFE, PCG, PFG, PG, PEG, QTWO, QCOM, RRC, RJF, RGA, RCKY, R, ^GSPC, SAIA, SBH, SAIC, NOW, SLGN, SMAR, SO, SWX, SWN, SR, SXI, SSYS, TDC, TOL, TZOO, UIS, UPS, UNM, VLO, VMI, VECO, VEEV, V, WRB, WERN, WU, WOLF, WDAY, IYK, IYC, IYE, IEZ, IHE, IDU, FTEC, QTEC, FXL, QQQ, ICF, IYZ, IGV, MXI, IXN, ILF, SOXX, IGE, IEO, IYF, EWC, ECH, EWY, EWT, QLD, IBB, PBE, PJP, SSO, XLP, XLE, XRT, SPY, XLK, XLU, UNG, SMH, VHT, MGK, VONG. Click this link for details (pattern type, start and end dates).
For a list of small patterns (those a few days wide) click this link.
$ $ $
The following table shows where Fibonacci retrace values of the day's high-low range are plus pivot points, calculated on the Nasdaq composite, sorted by value. When several are near each other (small differences), the area might act as support or resistance.
-- Thomas Bulkowski, author: Invest for Two-Comma Wealth(#Ad) ![]()
![]()
| © 2024 ThePatternSite.com Metric | Value | Diff | Close (within 10% of the high-low range for the day)? |
| Monthly S2 | 15,803.45 | ||
| Weekly S2 | 16,574.23 | 770.79 | |
| Monthly S1 | 16,705.94 | 131.71 | |
| Monthly Pivot | 16,970.84 | 264.89 | |
| Weekly S1 | 17,091.34 | 120.50 | |
| Weekly Pivot | 17,163.53 | 72.20 | |
| Daily S2 | 17,373.41 | 209.87 | |
| Low | 17,490.64 | 117.23 | |
| Daily S1 | 17,490.92 | 0.28 | Yes! The Daily S1 is close to the Low. |
| Open | 17,502.15 | 11.23 | Yes! The Open is close to the Daily S1. |
| 61.8% Down from Intraday High | 17,580.31 | 78.16 | |
| 50% Down from Intraday High | 17,608.02 | 27.70 | |
| Daily Pivot | 17,608.16 | 0.14 | Yes! The Daily Pivot is close to the 50% Down from Intraday High. |
| Close | 17,608.44 | 0.28 | Yes! The Close is close to the Daily Pivot. |
| 38.2% Down from Intraday High | 17,635.71 | 27.28 | |
| Weekly R1 | 17,680.64 | 44.92 | |
| High | 17,725.39 | 44.75 | |
| Daily R1 | 17,725.67 | 0.28 | Yes! The Daily R1 is close to the High. |
| Weekly R2 | 17,752.83 | 27.16 | |
| Daily R2 | 17,842.91 | 90.07 | |
| Monthly R1 | 17,873.33 | 30.43 | |
| Monthly R2 | 18,138.23 | 264.89 |
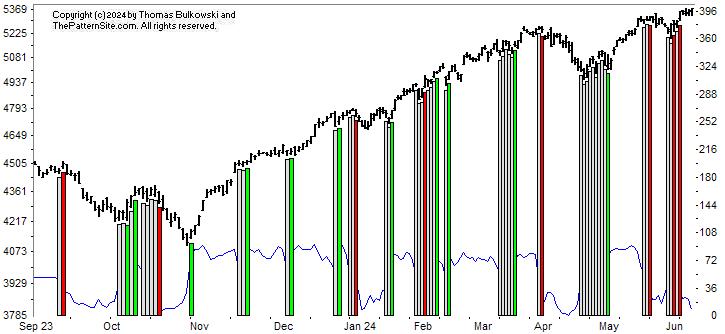
This is a picture of the chart pattern indicator on the daily scale. The indicator is the blue line below a chart of the S&P 500 composite.
The chart on the far right shows a series of bearish-neutral bands, as if the indicator can't make up its mind which way to go.
Even as the CPI shouts a warning, the index continues rising (albeit with a small dip between). I can't recall seeing this many red-white bands so close together.
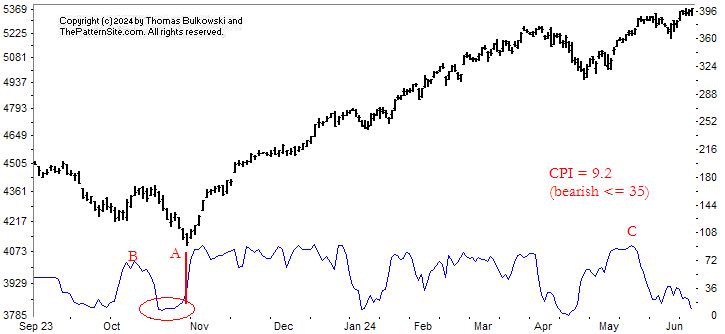
The current CPI reading is 9.2, which is bearish. Last week, it was 7.1, so it's less bearish this week than last.
I like to look back to see if a similar setup occurred. It hasn't done much good with the CPI chart, but I do it anyway.
At B, the indicator takes a dive that's similar to what happened at C. After spending several days (a week or two, really) near 0, the indicator shot up to A. And the index followed, beginning a move upward to the April high. Will that happen again? Probably not but it bears watching.
$ $ $
I added trading lessons to head-and-shoulder bottoms (both simple and complex patterns).
$ $ $
Here's a symbol list of 173 chart and candlestick patterns (13 "investment grade" candle patterns) found in today's securities using my version of Patternz: DDD, ABT, ABM, ADBE, AMD, AES, ALRM, AA, ALGT, APH, ANIK, ANET, ASH, AGO, AZTA, BSET, BKH, BOOT, BFH, CBT, CENX, CLNE, CLF, CNO, CXW, CSGP, CROX, CCRN, CCK, DFS, BOOM, EIX, EL, EVH, XOM, FARO, FISV, FCX, FDP, GME, GPS, IT, GD, GL, GPRO, THG, HSIC, IDA, IEX, ITW, TILE, IPG, IRM, JAZZ, KSS, LZB, LEG, LMT, MAS, MTRN, MRK, MGEE, MSFT, MS, MOS, MLI, MUR, NEE, JWN, NWPX, OMC, ASGN, OTEX, ORCL, PDCO, PAYX, PYPL, PETS, PFE, PNW, PFG, PEG, DGX, RLI, RHI, R, SAIA, SBH, NOW, STR, SCCO, SSYS, TPX, TER, TXN, TXT, TDG, TG, TREX, UNM, MDRX, WU, WOLF, WWW, ITA, IYM, IAI, IYK, QTEC, FXI, IAT, IYZ, IEV, IGV, MXI, ILF, SLV, IGE, IYF, EWA, EWO, EWK, EWZ, EWC, ECH, EEM, EWQ, EWG, EWH, EWI, EWJ, EWM, EPP, EWS, EZA, EWP, EWD, EWL, THD, TUR, EWU, PPA, DBA, ROBO, XLB, XRT, UNG, VAW. Click this link for details (pattern type, start and end dates).
For a list of small patterns (those a few days wide) click this link.
-- Thomas Bulkowski, author: Invest for Two-Comma Wealth(#Ad) ![]()
![]()
$ $ $
I show another slider trading quiz featuring inverted and ascending scallop.
$ $ $
Here's a symbol list of 179 chart and candlestick patterns (13 "investment grade" candle patterns) found in today's securities using my version of Patternz: ANF, ACIW, ADTN, AES, ALKS, ALGT, AMZN, AEO, APH, AAPL, AMAT, ATR, ARCB, AWI, ARW, AVNT, AVA, BMI, BCPC, BSET, BMRN, BKH, BRC, CE, CLS, CENX, CI, CLF, CNO, CGNX, CTSH, CONN, CXW, COTY, CRH, CCK, CTS, ^DJI, D, EIX, ELV, EL, EVRG, EZPW, FARO, FDX, FLEX, FMC, FORM, FWRD, FDP, GD, GPRO, HLIT, HTLD, HL, HELE, HSIC, HNI, HUN, IDA, IDXX, INTC, IPAR, IPG, ISRG, K, KMT, KFRC, KLAC, KSS, LZB, LRCX, LEG, RAMP, LMT, MRTN, MTRN, MTRX, MRK, MGEE, MSFT, MLKN, MS, MOS, MLI, MYGN, NWPX, NTNX, NVDA, OMC, OXM, PKE, PDCO, PETS, PFE, PNW, POR, PINC, RL, RLI, ROST, R, SAIA, SBH, SCHW, SMG, SIGI, NOW, STR, SKX, LUV, SXI, SUM, TPX, TDC, TER, TXN, TKR, TG, TREX, SLCA, UIS, UNM, VECO, VEEV, WSO, WWW, IYC, IEZ, DDM, FDN, QTEC, QQQ, IYZ, IEV, MXI, ILF, SOXX, SLV, EWK, EWZ, EWQ, EWG, EIS, EWI, EWP, THD, TUR, IBB, PXJ, XLB, XRT, XLU, SMH, VAW, VONG. Click this link for details (pattern type, start and end dates).
For a list of small patterns (those a few days wide) click this link.
$ $ $
The following table shows where Fibonacci retrace values of the day's high-low range are plus pivot points, calculated on the Dow industrials, sorted by value. When several are near each other (small differences), the area might act as support or resistance.
-- Thomas Bulkowski, author: Invest for Two-Comma Wealth(#Ad) ![]()
![]()
| © 2024 ThePatternSite.com Metric | Value | Diff | Close (within 10% of the high-low range for the day)? |
| Monthly S2 | 36,905.69 | ||
| Weekly S2 | 37,882.15 | 976.46 | |
| Monthly S1 | 37,886.87 | 4.71 | Yes! The Monthly S1 is close to the Weekly S2. |
| Weekly S1 | 38,375.10 | 488.23 | |
| Daily S2 | 38,591.38 | 216.28 | |
| Low | 38,665.45 | 74.07 | |
| Daily S1 | 38,729.71 | 64.26 | |
| Weekly Pivot | 38,740.16 | 10.46 | Yes! The Weekly Pivot is close to the Daily S1. |
| 61.8% Down from Intraday High | 38,746.59 | 6.43 | Yes! The 61.8% Down from Intraday High is close to the Weekly Pivot. |
| 50% Down from Intraday High | 38,771.66 | 25.07 | |
| Open | 38,784.90 | 13.24 | Yes! The Open is close to the 50% Down from Intraday High. |
| 38.2% Down from Intraday High | 38,796.72 | 11.82 | Yes! The 38.2% Down from Intraday High is close to the Open. |
| Daily Pivot | 38,803.79 | 7.07 | Yes! The Daily Pivot is close to the 38.2% Down from Intraday High. |
| Close | 38,868.04 | 64.25 | |
| High | 38,877.86 | 9.82 | Yes! The High is close to the Close. |
| Daily R1 | 38,942.12 | 64.26 | |
| Monthly Pivot | 38,982.13 | 40.02 | |
| Daily R2 | 39,016.19 | 34.06 | |
| Weekly R1 | 39,233.11 | 216.91 | |
| Weekly R2 | 39,598.17 | 365.07 | |
| Monthly R1 | 39,963.30 | 365.13 | |
| Monthly R2 | 41,058.57 | 1,095.27 |
$ $ $
I show another slider trading quiz featuring inverted and ascending scallop.
$ $ $
Here's a symbol list of 179 chart and candlestick patterns (13 "investment grade" candle patterns) found in today's securities using my version of Patternz: ANF, ACIW, ADTN, AES, ALKS, ALGT, AMZN, AEO, APH, AAPL, AMAT, ATR, ARCB, AWI, ARW, AVNT, AVA, BMI, BCPC, BSET, BMRN, BKH, BRC, CE, CLS, CENX, CI, CLF, CNO, CGNX, CTSH, CONN, CXW, COTY, CRH, CCK, CTS, ^DJI, D, EIX, ELV, EL, EVRG, EZPW, FARO, FDX, FLEX, FMC, FORM, FWRD, FDP, GD, GPRO, HLIT, HTLD, HL, HELE, HSIC, HNI, HUN, IDA, IDXX, INTC, IPAR, IPG, ISRG, K, KMT, KFRC, KLAC, KSS, LZB, LRCX, LEG, RAMP, LMT, MRTN, MTRN, MTRX, MRK, MGEE, MSFT, MLKN, MS, MOS, MLI, MYGN, NWPX, NTNX, NVDA, OMC, OXM, PKE, PDCO, PETS, PFE, PNW, POR, PINC, RL, RLI, ROST, R, SAIA, SBH, SCHW, SMG, SIGI, NOW, STR, SKX, LUV, SXI, SUM, TPX, TDC, TER, TXN, TKR, TG, TREX, SLCA, UIS, UNM, VECO, VEEV, WSO, WWW, IYC, IEZ, DDM, FDN, QTEC, QQQ, IYZ, IEV, MXI, ILF, SOXX, SLV, EWK, EWZ, EWQ, EWG, EIS, EWI, EWP, THD, TUR, IBB, PXJ, XLB, XRT, XLU, SMH, VAW, VONG. Click this link for details (pattern type, start and end dates).
For a list of small patterns (those a few days wide) click this link.
$ $ $
The following table shows where Fibonacci retrace values of the day's high-low range are plus pivot points, calculated on the Dow industrials, sorted by value. When several are near each other (small differences), the area might act as support or resistance.
-- Thomas Bulkowski, author: Invest for Two-Comma Wealth(#Ad) ![]()
![]()
| © 2024 ThePatternSite.com Metric | Value | Diff | Close (within 10% of the high-low range for the day)? |
| Monthly S2 | 36,905.69 | ||
| Weekly S2 | 37,882.15 | 976.46 | |
| Monthly S1 | 37,886.87 | 4.71 | Yes! The Monthly S1 is close to the Weekly S2. |
| Weekly S1 | 38,375.10 | 488.23 | |
| Daily S2 | 38,591.38 | 216.28 | |
| Low | 38,665.45 | 74.07 | |
| Daily S1 | 38,729.71 | 64.26 | |
| Weekly Pivot | 38,740.16 | 10.46 | Yes! The Weekly Pivot is close to the Daily S1. |
| 61.8% Down from Intraday High | 38,746.59 | 6.43 | Yes! The 61.8% Down from Intraday High is close to the Weekly Pivot. |
| 50% Down from Intraday High | 38,771.66 | 25.07 | |
| Open | 38,784.90 | 13.24 | Yes! The Open is close to the 50% Down from Intraday High. |
| 38.2% Down from Intraday High | 38,796.72 | 11.82 | Yes! The 38.2% Down from Intraday High is close to the Open. |
| Daily Pivot | 38,803.79 | 7.07 | Yes! The Daily Pivot is close to the 38.2% Down from Intraday High. |
| Close | 38,868.04 | 64.25 | |
| High | 38,877.86 | 9.82 | Yes! The High is close to the Close. |
| Daily R1 | 38,942.12 | 64.26 | |
| Monthly Pivot | 38,982.13 | 40.02 | |
| Daily R2 | 39,016.19 | 34.06 | |
| Weekly R1 | 39,233.11 | 216.91 | |
| Weekly R2 | 39,598.17 | 365.07 | |
| Monthly R1 | 39,963.30 | 365.13 | |
| Monthly R2 | 41,058.57 | 1,095.27 |
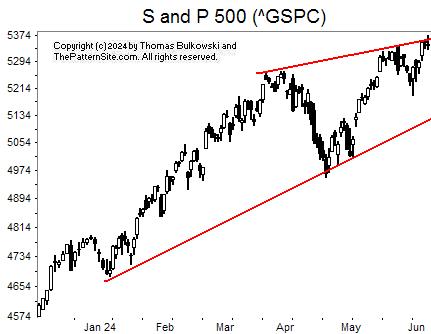
I don't have much to say about this pic of the S&P 500 index.
I drew some trendlines, making a "best fit" (meaning they cut through some prices). The resulting two lines form a rising wedge. Those breakout downward 60% of the time, according to my tests.
The target for the extent of the drop, is the bottom of the pattern. In this case, that's the April valley, at about 4,950.
Because price is hovering near the top of the pattern, expect an upward breakout, but remember that the top red trendline shows resistance. It's already repelled an advance and it could do it again. The CPI suggests the markets will turn down.
That's it. Have a good weekend. June 19 is a market holiday...
![]()
The following is a brief review of how the markets performed over time. The numbers refer to the close-to-close move in the Dow industrials.
No options expire this week.
![]()
The following is based on an SFO article in December 2004 by John Seekinger, titled, "Take a two-dimensional approach." He offers these tips.
| Index | S2 | S1 | Pivot | R1 | R2 |
| Dow Industrials (^DJI): Daily | 38,532 | 38,665 | 38,885 | 39,019 | 39,239 |
| Weekly | 37,859 | 38,329 | 38,717 | 39,187 | 39,575 |
| Monthly | 36,883 | 37,841 | 38,959 | 39,917 | 41,036 |
| S&P500 (^GSPC): Daily | 5,307 | 5,327 | 5,351 | 5,371 | 5,395 |
| Weekly | 5,178 | 5,263 | 5,319 | 5,403 | 5,460 |
| Monthly | 5,001 | 5,174 | 5,274 | 5,448 | 5,548 |
| Nasdaq (^IXIC): Daily | 17,012 | 17,072 | 17,151 | 17,212 | 17,290 |
| Weekly | 16,416 | 16,774 | 17,005 | 17,364 | 17,594 |
| Monthly | 15,645 | 16,389 | 16,812 | 17,556 | 17,980 |
Here are the formulas:
![]()
Earnings season is over.
Here's a symbol list of 127 chart and candlestick patterns (13 "investment grade" candle patterns) found in today's securities using my version of Patternz: AXDX, AES, AA, ALGT, AMWD, APH, ANIK, ATR, ADP, AVA, BZH, BIG, BKH, BOOT, BSX, CLS, CENX, CHD, CIEN, CI, CLF, CMCO, ED, CONN, CCRN, DECK, DVN, DFS, ^DJU, D, DTE, EMN, ELV, EL, EVRG, FICO, FIS, FLS, FCX, GME, GD, GOOGL, GGG, HSII, HELE, HNI, DHI, IDA, INCY, INFN, TILE, JKHY, JAZZ, KBH, KSS, LZB, LEG, LMT, MCHX, MAS, MDT, MRK, MRCY, META, MSFT, MCO, MS, MLI, NFLX, NWPX, OUT, OXM, PYPL, PEN, PHM, RL, RNG, RHI, RCKY, RES, SAIA, SAND, SLB, SEIC, SMTC, SKX, SWX, SWN, SCS, SSYS, TGT, TPX, TXN, TKR, TDG, MDRX, WMT, WERN, WWW, IYK, IEZ, SLV, EWW, EWS, EZA, THD, TUR, XHB, XLB. Click this link for details (pattern type, start and end dates).
For a list of small patterns (those a few days wide) click this link.
The below industries were the best (rank 1) or worst performing of those I follow.
|
-- Thomas Bulkowski, author: Invest for Two-Comma Wealth(#Ad) ![]()
![]()
$ $ $
Here's a symbol list of 97 chart and candlestick patterns (13 "investment grade" candle patterns) found in today's securities using my version of Patternz: ADTN, ALK, ALGT, AIG, APH, ANIK, ATR, ARCB, AVA, BZH, BIG, BKH, BSX, BR, BBW, CLS, CVX, CLX, ED, CONN, CTS, CW, DECK, DSGR, ECL, EMR, FLS, FRD, GME, GPN, HSIC, HOLX, HON, HURC, KBH, KELYA, KSS, LHX, LEG, MTSI, MCHX, MKTX, MCO, NBR, OGE, ORI, OMI, OXM, PDCO, PYPL, PG, DGX, RL, RCKY, SAIA, SAND, SKYW, SWN, TPX, TEVA, TXN, TXT, TKR, TDG, UGI, MDRX, WRB, WMT, WWW, IYK, IYC, IYZ, IYF, IHI, EWA, EWO, ECH, EEM, EIS, EWM, EWW, EWY, EWL, PEJ, XLY, XLP, XAR. Click this link for details (pattern type, start and end dates).
For a list of small patterns (those a few days wide) click this link.
$ $ $
You can find setups based on a Fibonacci retrace by clicking on the link.
The following patterns were found manually, not using Patternz. Mr. Bulkowski has excluded any securities he owns from appearing in the list. However, he may add any of the securities listed to his portfolio at any time, just as you can.
In the table below, the red and green colors are based on the historical breakout direction for the associated chart pattern. If a high and tight flag appears, the start and end dates highlight the flagpole only and not the flag.
For details about the chart patterns, click here.
-- Thomas Bulkowski, author: Invest for Two-Comma Wealth (#Ad) ![]()
![]()
| Symbol | Chart Pattern | Bullish Bearish | Start | End | Industry |
| ALRM | Double Top, Eve and Adam | 05/07/2024 | 05/16/2024 | Computer Software and Svcs | |
| ALGT | Pipe bottom | 05/20/2024 | 05/28/2024 | Air Transport | |
| AIG | Double Top, Eve and Eve | 05/07/2024 | 05/17/2024 | Insurance (Prop/Casualty) | |
| AR | Broadening top, right-angled and ascending | 05/06/2024 | 06/06/2024 | Natural Gas (Diversified) | |
| AAPL | Ugly double bottom | 04/19/2024 | 05/23/2024 | Computers and Peripherals | |
| AWI | Triangle, descending | 05/01/2024 | 06/06/2024 | Building Materials | |
| AVA | Double Top, Adam and Eve | 05/01/2024 | 05/13/2024 | Electric Utility (West) | |
| AXS | Broadening wedge, ascending | 05/13/2024 | 06/05/2024 | Insurance (Prop/Casualty) | |
| BSET | Ugly double bottom | 04/18/2024 | 05/16/2024 | Furn/Home Furnishings | |
| BIG | Dead-cat bounce | 06/06/2024 | 06/06/2024 | Retail Store | |
| CBT | Triple top | 05/07/2024 | 05/21/2024 | Chemical (Diversified) | |
| CAL | Head-and-shoulders top | 04/29/2024 | 05/28/2024 | Shoe | |
| CE | Double Top, Eve and Adam | 03/28/2024 | 05/09/2024 | Chemical (Basic) | |
| CIEN | Scallop, ascending and inverted | 04/22/2024 | 06/04/2024 | Telecom. Equipment | |
| CR | Double Top, Eve and Eve | 05/15/2024 | 06/03/2024 | Diversified Co. | |
| CSGS | Double Top, Eve and Eve | 05/15/2024 | 05/30/2024 | IT Services | |
| CW | Double Top, Eve and Adam | 05/21/2024 | 06/03/2024 | Machinery | |
| EMN | Triangle, symmetrical | 04/04/2024 | 06/06/2024 | Chemical (Diversified) | |
| GIS | Double Top, Eve and Eve | 04/25/2024 | 05/21/2024 | Food Processing | |
| GMS | Double Top, Eve and Adam | 05/07/2024 | 05/15/2024 | Cement and Aggregates | |
| HQY | Double Bottom, Adam and Adam | 05/15/2024 | 05/29/2024 | Healthcare Information | |
| HUM | Ugly double bottom | 05/01/2024 | 05/29/2024 | Medical Services | |
| INCY | Double Bottom, Eve and Eve | 05/16/2024 | 05/29/2024 | Drug | |
| KALU | Head-and-shoulders top | 05/06/2024 | 05/31/2024 | Metals and Mining (Div.) | |
| M | Broadening top | 05/03/2024 | 06/05/2024 | Retail Store | |
| MTRX | Ugly double bottom | 05/09/2024 | 05/28/2024 | Oilfield Svcs/Equipment | |
| MU | Broadening top | 05/15/2024 | 06/06/2024 | Semiconductor | |
| ON | Diamond top | 05/15/2024 | 06/06/2024 | Semiconductor | |
| PKG | Roof, inverted | 05/17/2024 | 06/06/2024 | Packaging and Container | |
| PEG | Diamond top | 05/15/2024 | 06/06/2024 | Electric Utility (East) | |
| RGA | Head-and-shoulders complex top | 05/10/2024 | 05/31/2024 | Insurance (Life) | |
| SAIA | Pipe bottom | 05/20/2024 | 05/28/2024 | Trucking/Transp. Leasing | |
| SBH | Ugly double bottom | 05/09/2024 | 05/21/2024 | Toiletries/Cosmetics | |
| NOW | Pipe top | 05/13/2024 | 05/20/2024 | IT Services | |
| SLGN | Triangle, symmetrical | 03/06/2024 | 06/06/2024 | Packaging and Container | |
| SCS | Double Top, Adam and Eve | 05/16/2024 | 06/03/2024 | Furn/Home Furnishings | |
| TPR | Ugly double bottom | 05/09/2024 | 05/29/2024 | Apparel | |
| TXT | Head-and-shoulders top | 05/10/2024 | 06/03/2024 | Diversified Co. | |
| UGI | Double Bottom, Adam and Adam | 05/02/2024 | 05/24/2024 | Natural Gas (Distributor) | |
| WLK | Triple top | 05/20/2024 | 06/03/2024 | Chemical (Basic) | |
| WPM | Head-and-shoulders top | 05/10/2024 | 05/28/2024 | Metals and Mining (Div.) | |
| ITB | Diamond bottom | 05/24/2024 | 06/06/2024 | Homebuilding | |
| IHI | Triangle, symmetrical | 04/09/2024 | 06/06/2024 | Medical Supplies |
![]()
Since I post this the night before, check how the futures are trading before market open. Large moves can affect the opening direction.
$ $ $
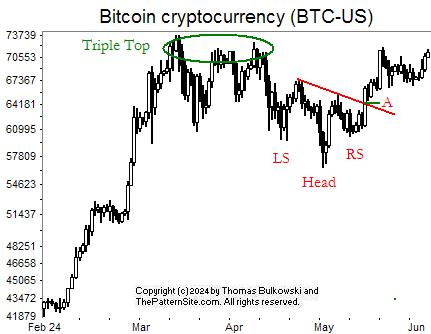
I show a picture of bitcoin (btc-usd) on the daily scale.
Circled in green is a nice looking triple top. This is a typical image of a triple top, with the middle peak often (but not always) below the other two. It confirms as a valid triple top when the currency closed below the lowest valley between the three peaks. It looks like that happened in early May.
In this example, the drop after confirmation didn't amount to much.
Recently, we see another nice looking pattern: a head-and-shoulders bottom. The two shoulders should bottom at about the same price and be similar distances from the head, which they are.
At A, the pattern confirms as valid and the currency rises, just as it's supposed to.
However, look for overhead resistance setup by the triple top to impede an upward move. It might not, but that's the way to bet.
$ $ $
I added trading lessons to Big Ws
$ $ $
Here's a symbol list of 109 chart and candlestick patterns (13 "investment grade" candle patterns) found in today's securities using my version of Patternz: ACN, ADTN, ALK, ALGT, ALL, AMED, AEE, AIG, AMN, APH, ADM, ASH, AGO, BCPC, BZH, BR, CLS, CDAY, CF, CRL, CVX, CIEN, CINF, CSCO, CLF, DECK, XRAY, EMN, EVH, FLS, FMC, HNI, DHI, HWM, HUN, ILMN, IIIN, IRM, JNJ, KALU, KBH, KELYA, KSS, LHX, LEG, MGY, MAN, MCHX, MKTX, MAS, MTDR, MTRN, META, MSFT, MUR, NBR, ^IXIC, NOV, NVDA, OGE, ORI, OMCL, ORCL, PEN, PETS, PINC, DGX, RMBS, RLI, RHI, ROL, R, SAIA, NOW, SHW, SMAR, SO, SSYS, TGT, TXN, TXT, TTD, TRV, WRB, WWW, IYC, IEZ, BOTZ, IEV, SOXX, EWA, EWK, ECH, EIS, EZA, PBE, PEJ, SMH, MGK, VONG. Click this link for details (pattern type, start and end dates).
For a list of small patterns (those a few days wide) click this link.
$ $ $
The following table shows where Fibonacci retrace values of the day's high-low range are plus pivot points, calculated on the Nasdaq composite, sorted by value. When several are near each other (small differences), the area might act as support or resistance.
-- Thomas Bulkowski, author: Invest for Two-Comma Wealth(#Ad) ![]()
![]()
| © 2024 ThePatternSite.com Metric | Value | Diff | Close (within 10% of the high-low range for the day)? |
| Monthly S2 | 15,117.71 | ||
| Monthly S1 | 16,152.81 | 1,035.09 | |
| Weekly S2 | 16,301.58 | 148.77 | |
| Monthly Pivot | 16,592.73 | 291.15 | |
| Weekly S1 | 16,744.74 | 152.01 | |
| Daily S2 | 16,878.10 | 133.36 | |
| Weekly Pivot | 16,888.70 | 10.60 | Yes! The Weekly Pivot is close to the Daily S2. |
| Low | 16,955.56 | 66.86 | |
| Open | 16,974.48 | 18.92 | Yes! The Open is close to the Low. |
| Daily S1 | 17,033.00 | 58.52 | |
| 61.8% Down from Intraday High | 17,044.32 | 11.32 | Yes! The 61.8% Down from Intraday High is close to the Daily S1. |
| 50% Down from Intraday High | 17,071.74 | 27.42 | |
| 38.2% Down from Intraday High | 17,099.16 | 27.42 | |
| Daily Pivot | 17,110.46 | 11.30 | Yes! The Daily Pivot is close to the 38.2% Down from Intraday High. |
| Close | 17,187.90 | 77.44 | |
| High | 17,187.92 | 0.02 | Yes! The High is close to the Close. |
| Daily R1 | 17,265.36 | 77.44 | |
| Weekly R1 | 17,331.86 | 66.50 | |
| Daily R2 | 17,342.82 | 10.96 | Yes! The Daily R2 is close to the Weekly R1. |
| Weekly R2 | 17,475.82 | 133.00 | |
| Monthly R1 | 17,627.83 | 152.01 | |
| Monthly R2 | 18,067.75 | 439.93 |
This is a picture of the chart pattern indicator on the daily scale. The indicator is the line chart below a chart of the S&P 500 composite.
The most recent signal is bearish, as shown by the vertical red bar on the far right of the chart. The only other place where we see a bearish-neutral-bearish switch is at the far left of the chart (August/September).
That three signal combination warned of market weakness (ending just before November). The markets were rattled for over a month. Will that happen this time?
Probably not. Why? See next chart.
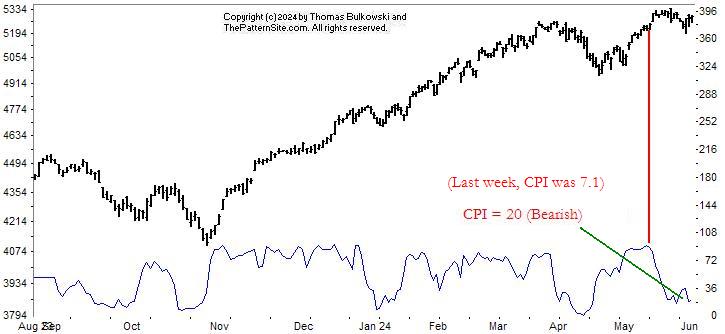
Here's the same chart except I erased the vertical bars. Last week, the CPI registered 7.1 and this week, it's 20.
The CPI is still bearish, but the market is not as weak as it was seven days ago. Another consideration is that it's not October. September and October are weak months, however, the summer isn't known as a strong period either...
I am still concerned with the index forming a head-and-shoulders top, with the index dropping now to form a right armpit (the valley between the head and right shoulder). What we can say for sure, is that the market direction is unsettled.
$ $ $
Here's a symbol list of 173 chart and candlestick patterns (13 "investment grade" candle patterns) found in today's securities using my version of Patternz: DDD, ADTN, AMD, ATSG, ALRM, ALKS, ALGT, ALL, AEE, AEP, AIG, APH, AR, APOG, ARCB, ARW, ASH, AVNT, BZH, BKH, BFH, BR, BBW, BLDR, CBT, CE, COR, CENX, CVX, CTAS, CSCO, CLNE, CLF, CAG, CR, CRH, CSGS, CMI, XRAY, DVN, DSGR, ^DJI, DRQ, DTE, EMN, EFX, EG, EXPI, XOM, FLS, FMC, FRD, GGG, HE, HTLD, HNI, HOLX, HON, HWM, HUN, HURC, IIIN, ITGR, KBH, K, KMT, KSS, KLIC, LEG, LEN, LXU, MGY, MTDR, MTRN, MTRX, MLKN, MS, MLI, MUR, NBR, NOV, NTGR, NKE, NI, NWPX, OXY, ORI, OLN, OTEX, PATK, PTEN, PNW, PPL, PGR, PHM, KWR, RL, RRC, RGS, RLI, ROL, RGLD, RES, R, SAIA, SRE, SLGN, SCCO, SR, SXI, SCS, TGT, TXN, TKR, TOL, RIG, VRTX, WU, WLK, WWW, WWD, XEL, ITA, IYM, IAI, IYC, IEZ, ICF, IHF, IAT, MXI, SLV, IEO, EWK, EWL, TUR, PXJ, PJP, XHB, XLI, XLB, USO, VAW. Click this link for details (pattern type, start and end dates).
For a list of small patterns (those a few days wide) click this link.
-- Thomas Bulkowski, author: Invest for Two-Comma Wealth(#Ad) ![]()
![]()
$ $ $
I show another slider trading quiz featuring descending scallops.
$ $ $
Here's a symbol list of 201 chart and candlestick patterns (13 "investment grade" candle patterns) found in today's securities using my version of Patternz: MMM, AXDX, ACIW, AYI, AMD, AES, AXP, AMWD, AME, APH, ANIK, AR, APA, ARCB, ASH, AVNT, BSET, BBY, BIIB, BOOT, BFH, BLDR, BG, CBT, CE, CX, CIEN, CLNE, CGNX, CXW, COTY, CR, CRH, CCRN, CSGS, CMI, DDS, DSGR, DOV, DRQ, DTE, DUK, EMN, EME, EMR, EPAM, EFX, EG, EXPI, EZPW, FARO, FLS, FMC, FTNT, FTV, GME, GE, GL, GMS, GGG, HBI, HE, HAYN, HD, HUN, IDXX, INFN, IIIN, INTU, IRM, KALU, KBH, KMT, KFRC, KMB, KLAC, KLIC, LAMR, LEN, LXU, MHO, M, MGY, MANH, MTDR, MTRX, MDT, MRK, MLI, NBR, NOV, NTGR, NWL, NI, NWPX, ORI, OLN, OTEX, OUT, PATK, PTEN, PEN, PETS, PHM, KWR, RL, RRC, RJF, RNG, RLI, RHI, ROST, RES, R, SAIA, SBH, SLB, SAIC, NOW, SHW, STR, SKYW, SMAR, LUV, SWN, SXI, SCS, TPR, TRGP, TECH, TDOC, TDY, TFX, TKR, TOL, RIG, TREX, TWLO, UGI, VEEV, V, VMC, WU, WLK, WPM, WSM, WWD, IAI, IYC, IYE, IEZ, IHE, IDU, FXI, ICF, IAT, IYZ, IXC, MXI, ILF, IGE, IEO, EWO, EIS, EWJ, EWW, EWD, EWL, PBE, PXJ, PJP, XHB, XLI, XRT, USO, SMH, VIS. Click this link for details (pattern type, start and end dates).
For a list of small patterns (those a few days wide) click this link.
$ $ $
The following table shows where Fibonacci retrace values of the day's high-low range are plus pivot points, calculated on the Dow industrials, sorted by value. When several are near each other (small differences), the area might act as support or resistance.
-- Thomas Bulkowski, author: Invest for Two-Comma Wealth(#Ad) ![]()
![]()
| © 2024 ThePatternSite.com Metric | Value | Diff | Close (within 10% of the high-low range for the day)? |
| Monthly S2 | 36,512.80 | ||
| Weekly S2 | 37,505.63 | 992.83 | |
| Monthly S1 | 37,541.91 | 36.29 | Yes! The Monthly S1 is close to the Weekly S2. |
| Daily S2 | 38,029.56 | 487.65 | |
| Weekly S1 | 38,038.33 | 8.77 | Yes! The Weekly S1 is close to the Daily S2. |
| Low | 38,247.22 | 208.89 | |
| Daily S1 | 38,300.30 | 53.08 | |
| 61.8% Down from Intraday High | 38,433.79 | 133.49 | |
| 50% Down from Intraday High | 38,491.41 | 57.63 | |
| Daily Pivot | 38,517.95 | 26.54 | Yes! The Daily Pivot is close to the 50% Down from Intraday High. |
| Weekly Pivot | 38,533.66 | 15.71 | Yes! The Weekly Pivot is close to the Daily Pivot. |
| 38.2% Down from Intraday High | 38,549.05 | 15.39 | Yes! The 38.2% Down from Intraday High is close to the Weekly Pivot. |
| Close | 38,571.03 | 21.98 | Yes! The Close is close to the 38.2% Down from Intraday High. |
| Open | 38,709.99 | 138.96 | |
| High | 38,735.61 | 25.62 | Yes! The High is close to the Open. |
| Daily R1 | 38,788.69 | 53.08 | |
| Monthly Pivot | 38,809.66 | 20.97 | Yes! The Monthly Pivot is close to the Daily R1. |
| Daily R2 | 39,006.34 | 196.69 | |
| Weekly R1 | 39,066.36 | 60.02 | |
| Weekly R2 | 39,561.69 | 495.33 | |
| Monthly R1 | 39,838.77 | 277.08 | |
| Monthly R2 | 41,106.52 | 1,267.74 |
Here's the updated 2024 market forecast, presented in slider format.
$ $ $
![]()
The following is a brief review of how the markets performed over time. The numbers refer to the close-to-close move in the Dow industrials.
No options expire this week.
![]()
The following is based on an SFO article in December 2004 by John Seekinger, titled, "Take a two-dimensional approach." He offers these tips.
| Index | S2 | S1 | Pivot | R1 | R2 |
| Dow Industrials (^DJI): Daily | 37,872 | 38,279 | 38,499 | 38,906 | 39,127 |
| Weekly | 37,544 | 38,115 | 38,572 | 39,143 | 39,600 |
| Monthly | 36,551 | 37,619 | 38,848 | 39,916 | 41,145 |
| S&P500 (^GSPC): Daily | 5,161 | 5,219 | 5,250 | 5,308 | 5,338 |
| Weekly | 5,137 | 5,207 | 5,262 | 5,332 | 5,386 |
| Monthly | 4,879 | 5,078 | 5,210 | 5,409 | 5,541 |
| Nasdaq (^IXIC): Daily | 16,313 | 16,524 | 16,657 | 16,868 | 17,000 |
| Weekly | 16,151 | 16,443 | 16,738 | 17,030 | 17,325 |
| Monthly | 14,967 | 15,851 | 16,442 | 17,326 | 17,917 |
Here are the formulas:
![]()
Earnings season is either underway or should be starting soon. The sessions could be more volatile.
Here's a symbol list of 140 chart and candlestick patterns (13 "investment grade" candle patterns) found in today's securities using my version of Patternz: DDD, MMM, AXDX, ACN, ACIW, ADBE, ALB, ALL, AMZN, DOX, AMED, ANIK, AZTA, BIIB, BBW, BG, CAL, CPB, CNC, CDAY, CHKP, CVX, CINF, CTAS, CLNE, CONN, CRH, CTS, DRQ, DTE, DUK, BOOM, EMN, EBAY, ECL, EME, EFX, EZPW, FDS, FICO, FIVN, FLEX, FORM, FTNT, GPS, GES, HIG, HE, HQY, HSII, HUM, HUN, IDXX, ITW, INFN, IBKR, INTU, KALU, KBH, KMB, KLAC, KLIC, MHO, MLM, MDT, MSFT, MS, NI, JWN, NTNX, OXY, OMC, OUT, PANW, PKE, PTEN, PCTY, PETS, PGR, RMBS, RNG, ROK, RES, SBH, NOW, SMAR, SWN, SSYS, SUM, TFX, TDC, UPS, UNH, VEEV, V, WRB, WMT, WU, WEX, WPM, IYM, IAI, FTEC, FDN, QTEC, FXL, FXI, ICF, IYZ, MXI, IXN, ILF, ECH, EEM, EWJ, EZA, EWY, EWL, EWT, PBE, PJP, XLY, XLP, XLB, XLK, UNG, VAW, MGK. Click this link for details (pattern type, start and end dates).
For a list of small patterns (those a few days wide) click this link.
The below industries were the best (rank 1) or worst performing of those I follow.
|
-- Thomas Bulkowski, author: Invest for Two-Comma Wealth(#Ad) ![]()
![]()
Support this site! Clicking any of the books (below) takes you to
Amazon.com If you buy ANYTHING while there, they pay for the referral.
Legal notice for paid links: "As an Amazon Associate I earn from qualifying purchases."
|
My Stock Market Books
|
My Novels
Orb Foresight Rewrite Coming!
|