As of 04/24/2026
Indus: 49,231 -79.61 -0.2%
Trans: 20,892 -198.95 -0.9%
Utils: 1,155 -2.30 -0.2%
Nasdaq: 24,837 +398.10 +1.6%
S&P 500: 7,165 +56.68 +0.8%
|
YTD
+2.4%
+20.4%
+8.1%
+6.9%
+4.7%
|
|
As of 04/24/2026
Indus: 49,231 -79.61 -0.2%
Trans: 20,892 -198.95 -0.9%
Utils: 1,155 -2.30 -0.2%
Nasdaq: 24,837 +398.10 +1.6%
S&P 500: 7,165 +56.68 +0.8%
|
YTD
+2.4%
+20.4%
+8.1%
+6.9%
+4.7%
|
|
As of 04/24/2026
Indus: 49,231 -79.61 -0.2%
Trans: 20,892 -198.95 -0.9%
Utils: 1,155 -2.30 -0.2%
Nasdaq: 24,837 +398.10 +1.6%
S&P 500: 7,165 +56.68 +0.8%
|
YTD
+2.4%
+20.4%
+8.1%
+6.9%
+4.7%
| |
|
| ||
Page updated and 10 examples added 6/16/2025.
During research for my book, Encyclopedia of Chart Patterns, 3rd Edition I uncovered many facts about double tops. I discovered that twin peak patterns fail 60% of the time. That's how often price rises instead of drops. Confirmed Adam & Adam double tops fail much less, 25% of the time (which isn't small, either).
Adam is a term that describes how the top looks, in this case, a narrow, pointed top, perhaps with a one-day upward spike. Eve tops are more rounded looking and wider. If they have spikes, they tend to be more numerous and shorter. Many times the difference between Adam and Eve is the width of each over their entire height. Adam tops tend to remain narrow but Eve tops widen over their height. When trying to decide which is which, ask yourself if the two tops appear different or similar. With Adam & Adam, the two should look similar (both narrow).
|
Overall performance rank (1 is best): 19 out of 36
Break even failure rate: 25%
Average decline: 15%
Pullback rate: 64%
Percentage meeting price target: 64%
The above numbers are based on 1,114 perfect trades. See the glossary for definitions. |

Adam & Adam Double Top
|
|
| Characteristic | Discussion |
| Price trend | Upward leading to the pattern. |
| Shape | Two distinct tops that look similar, usually twin spikes poking above the surrounding price landscape. Adam tops are narrow, inverted V's. |
| Valley | The valley drop between the tops should measure at least 10%, but allow exceptions. |
| Top price | The variation between price peaks is small, usually less than 3%. The two tops should appear to peak near the same price. |
| Separation | The twin peaks are usually several weeks apart. |
| Confirmation | The double top confirms as a true double top once price closes below the valley between the two peaks. |
| Volume | Usually higher on formation of the left peak than the right, and trends downward. |
| Trading Tactic | Explanation | 
The Measure Rule |
| Measure rule | Compute the height from the highest peak (point B in the figure to the right) to the lowest valley (A) between the two peaks and then multiply it by the above 'percentage meeting price target.' Subtract the result from the breakout price (A) to get the target (C). Also, see the double top study. for a new price prediction method. | |
| Stop | Place a stop loss order a few pennies above the highest peak (point B in the figure to the right) in the double top chart pattern. If that is too far away, then consider a volatility stop. | |
| Price velocity | A study concludes that a high velocity move leading to the chart pattern results in a high velocity move after the breakout. | |
| Price reversal | Price must have something to reverse, so if the rise leading to the double top is small, expect a small decline. | |
| Confirmation | Wait for confirmation -- price to close below the valley floor (point A in the figure to the upper right). If you don't wait, there's a 60% chance that price will continue higher without confirming the double top. | |
| Trend end | If a double top appears after a long-term DECLINE, confirmation of the top may mean that the end of the decline is near (10% to 20% below and a month away). | |
| Trends | Avoid a long term trend leading to the pattern as those produce the smallest declines post breakout. | |
| Yearly high | Double tops with breakouts in the highest third of the yearly price range perform worst, but the performance difference between the other ranges is small. | |
| Pullbacks | Pullbacks hurt post breakout performance. The link to the left defines pullbacks and the following link discusses performance. |

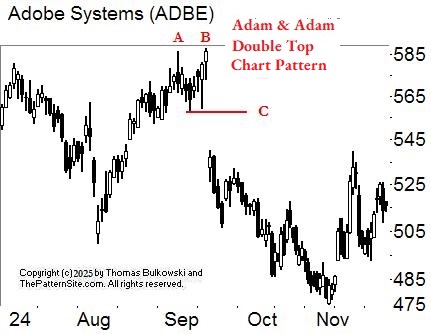
The figure to the right shows an example of an Adam & Adam double top chart pattern. The two Adam tops are narrow peaks with a good decline between them (point B) and they appear after an upward price trend. The Adam & Adam double top confirms as a valid double top when price closes below point B, shown as the horizontal blue line.
To calculate a price target, subtract the price of valley B (the lowest valley between the two Adam tops) from the higher of the Adam peaks (A). That finds the height. Multiply the height by 45% (the percentage meeting price target from Important Bull Market Results table near the top of this page) and subtract the result from B. That gives a target shown as a red horizontal line on the above chart (point C).
The following is a slide show. Click the right or left arrows, or the circles below the chart to navigate around the slides.
Peaks AB form the Adam & Adam double top. When price closes below the red line (C), it confirms the squiggles on the chart as a valid chart pattern. Point C is the lowest valley between the two peaks. In this case, price gaps lower.

Yes, this double top looks weird but few examples are perfect. The two peaks should top out at the same or similar prices but this example does not. Peaks AB are the double top. The horizontal red line is confirmation. If price doesn't close below the red line, then you don't have a valid chart pattern.

This double top AB doesn't see price drop far below confirmation, C.

Another double top AB with a pullback, D, with price eventually reaching the ultimate low at C. The ultimate low is the lowest price before the stock climbs by at least 20%. If you traded the stock perfectly, it's the price at which you'd cover your short.

AB is the double top. C is the ultimate low. This double top busts when the stock drops less than 10% below the breakout price (same as confirmation), reverses, and closes above the highest of the two peaks (B in this example). Note: the double top isn't an Adam & Adam but rather an Eve & Adam top. Did you catch the mistake?

AB is the double top. To the left of that is an example of a chart pattern called an Eve & Adam. The ultimate low is C for the first double top. D shows a nice decline after Adam & Adam (AB). There's not a lot of difference (visually) between the four peaks, so this is not an ideal example.

AB is the double top. C is the ultimate low. D is when price busts the double top. A trader would be hard pressed to make money shorting this stock. This might be an Eve & Adam double top, which highlights the problem with identification.

Another example of a double top but this appears as a retrace of the downtrend.

A pair of Adam & Adam double tops. These are classic examples, with narrow needle-like peaks. I usually ignore the meager decline between the two peaks (it's supposed to be at least 10%).

This double top (AB) didn't see price drop much (to C) before busting.
-- Thomas Bulkowski
Support this site! Clicking any of the books (below) takes you to
Amazon.com If you buy ANYTHING while there, they pay for the referral.
Legal notice for paid links: "As an Amazon Associate I earn from qualifying purchases."
|
My Stock Market Books
|
My Novels
Orb Foresight Rewrite Coming!
|
I can walk on water as long as it's frozen.![]()