As of 04/20/2026
Indus: 49,443 -4.87 0.0%
Trans: 23,322 +900.05 +4.0%
Utils: 1,152 -6.38 -0.6%
Nasdaq: 24,404 -64.09 -0.3%
S&P 500: 7,109 -16.92 -0.2%
|
YTD
+2.9%
+34.4%
+7.8%
+5.0%
+3.9%
|
|
As of 04/20/2026
Indus: 49,443 -4.87 0.0%
Trans: 23,322 +900.05 +4.0%
Utils: 1,152 -6.38 -0.6%
Nasdaq: 24,404 -64.09 -0.3%
S&P 500: 7,109 -16.92 -0.2%
|
YTD
+2.9%
+34.4%
+7.8%
+5.0%
+3.9%
|
|
As of 04/20/2026
Indus: 49,443 -4.87 0.0%
Trans: 23,322 +900.05 +4.0%
Utils: 1,152 -6.38 -0.6%
Nasdaq: 24,404 -64.09 -0.3%
S&P 500: 7,109 -16.92 -0.2%
|
YTD
+2.9%
+34.4%
+7.8%
+5.0%
+3.9%
| |
|
| ||
Updated and added 10 examples on 8/6/25.
For more information on this pattern, read Encyclopedia of Chart Patterns, 3rd Edition (#ad).
If you click on the above link and then buy the book (or anything) while at Amazon.com, the referral will help support this site. Thanks.
$ $ $
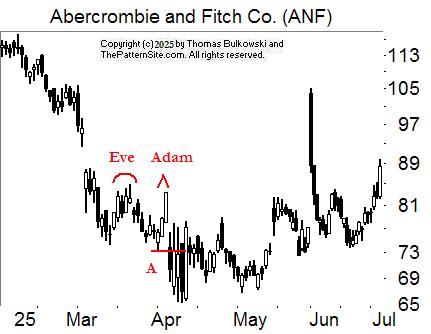
Adam is a term that describes how the top looks, in this case, Adam sports a narrow, pointed top, perhaps with a one-day upward spike. The Eve top is more rounded looking and wider. If Eve has spikes, they tend to be more numerous and shorter. Many times the difference between Adam and Eve is the width of each over their entire height. Adam tops tend to remain narrow but Eve tops widen over their height. When trying to decide which is which, ask yourself if the two tops appear different or similar. With Eve & Adam, the two should look different (the first wide and the second narrow).
|
Overall performance rank (1 is best): 16 out of 36
Break even failure rate: 21%
Average decline: 15%
Pullback rate: 64%
Percentage meeting price target: 55%
The above numbers are based on 662 perfect trades. See the glossary for definitions. |

|
|
![]() More (#ad)
More (#ad)
| Characteristic | Discussion | 
Configuration |
| Price trend | Upward leading to the pattern. | |
| Shape | Two distinct tops that look different. Eve appears first and is rounded looking and wider than Adam. Adam comes second and is narrow, an inverted V, often appears as a 1-day price spike. | |
| Valley | The valley drop between the tops should measure at least 10%, but allow exceptions. The figure to the right shows the details. | |
| Top price | The variation between price peaks is small, often less than 3%. The two tops should appear to peak near the same price. The figure to the right shows the details for generic double tops. | |
| Separation | The twin peaks should be several weeks apart with most falling in the 2 to 6 week range. The figure to the right shows the details. I don't pay any attention to this guideline. | |
| Confirmation | The double top confirms as a true double top once price closes below the valley between the two peaks. | |
| Volume | Usually higher on formation of the left peak. |
![]() More (#ad)
More (#ad)
| Trading Tactic | Explanation | 
The Measure Rule |
| Measure rule | Compute the height from the highest peak (B in the figure to the right) to the lowest valley (A) in the pattern then multiply by the above 'percentage meeting price target.' Subtract the result from the breakout price (A) to get the target (C). | |
| Price reversal | Price must have something to reverse, so if the rise leading to the double top is small, expect a small decline. | |
| Confirmation | Wait for confirmation -- price to close below the valley floor (point A in the figure to the right). If you don't wait, there's a 60% chance that price will continue higher without confirming the double top. | |
| Trend end | If a double top appears after a long-term decline (meaning the double top appears as part of an upward retrace in a longer-term downtrend), confirmation of the top may mean that the end of the decline is near (10% to 20% below and a month away). | |
| Trends | A short-term rise (0-3 months) leading to the double top results in the best post-breakout performance. | |
| Yearly low | Double tops with breakouts in the lowest third of the yearly price range outperform. | |
| Pullbacks | Pullbacks hurt post breakout performance. |
![]() More (#ad)
More (#ad)

The figure on the right shows an example of an Eve & Adam double top chart pattern. The Eve top has several days at about the same price level. Adam has a long, single price spike. The two tops look different. Eve is wider than Adam and more rounded looking.
The Eve & Adam double top chart pattern confirms when price closes below the valley between the two tops, shown here as point A.
Price at point B attempts a pullback but does not quite make it up to the price level of the breakout (A).
Just by looking at this example, you can see that it fulfills the measure rule. That means the decline after this pattern confirms is well below the height of this pattern projected downward from A.
![]() More (#ad)
More (#ad)
The following is a slide show. Click the right or left arrows, or the circles below the chart to navigate around the slides.
Shown is an Eve & Adam double top chart pattern. The twin peaks confirm as a valid chart pattern when price closes below the red line, at A. In this example, price didn't drop far before rebounding.

This (AB) is another example of a double top. Notice the shape of the two peaks. Eve is wide and Adam is narrow. The breakout (confirmation) is at C, drawn using the lowest valley between the two peaks.

An Eve & Adam double top, AB.

An Eve & Adam double top, AB. This double top appears as an upward retrace in a longer-term downtrend.

This Eve & Adam double top (AB) appears in an uptrend (compared to the prior slide).

This Eve & Adam double top (AB) sees price make a large decline.

The two peaks of this Eve & Adam double top (AB) have different prices. I allow variation. Price reverses at C, busting the downward breakout when price closes above the top of the double top.

This is how an Eve & Adam double top (AB) should appear and work.

AB is an Eve & Adam double top that confirms at D. A pullback completes at C.

Another Eve & Adam double top, highlighted in red.
-- Thomas Bulkowski
![]() More (#ad)
More (#ad)
Support this site! Clicking any of the books (below) takes you to
Amazon.com If you buy ANYTHING while there, they pay for the referral.
Legal notice for paid links: "As an Amazon Associate I earn from qualifying purchases."
|
My Stock Market Books
|
My Novels
Orb Foresight Rewrite Coming!
|
Diplomacy is the art of letting someone have your way.![]()