As of 05/01/2026
Indus: 49,499 -152.87 -0.3%
Trans: 20,598 -195.32 -0.9%
Utils: 1,157 -8.12 -0.7%
Nasdaq: 25,114 +222.13 +0.9%
S&P 500: 7,230 +21.11 +0.3%
|
YTD
+3.0%
+18.7%
+8.3%
+8.1%
+5.6%
|
|
As of 05/01/2026
Indus: 49,499 -152.87 -0.3%
Trans: 20,598 -195.32 -0.9%
Utils: 1,157 -8.12 -0.7%
Nasdaq: 25,114 +222.13 +0.9%
S&P 500: 7,230 +21.11 +0.3%
|
YTD
+3.0%
+18.7%
+8.3%
+8.1%
+5.6%
|
|
As of 05/01/2026
Indus: 49,499 -152.87 -0.3%
Trans: 20,598 -195.32 -0.9%
Utils: 1,157 -8.12 -0.7%
Nasdaq: 25,114 +222.13 +0.9%
S&P 500: 7,230 +21.11 +0.3%
|
YTD
+3.0%
+18.7%
+8.3%
+8.1%
+5.6%
| |
|
| ||
Updated and added 10 examples on 7/18/25.
The right-angled broadening formation, ascending (RABFA) chart pattern is a mid-list performer in bull markets. Downward breakouts perform slightly worse than upward breakouts, based on the performance rank.
$ $ $
For detailed information on this chart pattern, read Encyclopedia of Chart Patterns, 3rd Edition (#ad). If you click the link and then buy the book (or anything) while at Amazon.com, the referral will help support this site. Thanks. -- Tom Bulkowski
$ $ $
The picture shows an example of a right-angled broadening formation, ascending.

Right-Angled and Ascending Broadening Formation
|
The above numbers are based on 551 samples for upward breakouts and 455 for downward breakouts. See the glossary for definitions.
| Characteristic | Discussion |
| Price trend | Can be up (74% have a rising price trend) leading to the pattern. |
| Shape | A megaphone tilted up with the bottom horizontal. |
| Trendlines | The bottom trendline is horizontal, the top one slopes upward. |
| Touches | At least five touches total, three peaks or three valleys should touch the associated trend line with two or more touches of the other trendline. Ideally, the second of three touches will touch (instead of coming 'close' to) the trendline. |
| Volume | Trends upward 62% to 63% of the time. |
| Breakout | Upward 55% of the time. |
| Trading Tactic | Explanation | 
The Measure Rule
|
| Measure rule | Compute the height from the highest peak (point A in the Measure Rule figure to the right) to the horizontal trendline (B) and multiply it by the above "percentage meeting price target" (see Important Bull Market Results). Add the result to the highest peak (A, upward breakouts) or subtract it from the horizontal trendline (B, downward breakouts) to get the price target (C). | |
| Intraformation trade | Buy at the horizontal trendline when price starts rising and sell or sell short once price turns at the top trendline. | |
| Buy at 3rd touch | When price touches the horizontal trendline for the third time and begins rising, buy. | |
| Partial rise | A partial rise works 61% of the time. | |
| Partial decline | A partial decline works 80% of the time. | |
| Price trend | The best performing patterns are those with a short-term (less than three months) rise leading to the pattern. | |
| Yearly high, low | Downward and upward breakouts perform best when the breakout is within a third of the yearly low. | |
| Volume trend | A downward volume trend results in the best post breakout performance. | |
| Throwbacks and pullbacks | Throwbacks and pullbacks hurt post breakout performance. | |
| Height, width | Tall patterns perform better than short ones. Wide patterns (both breakout directions) perform well. |
| Breakout Direction | 1990s | 2000s | 2010s |
| Up (average) | 41% | 50% | 36% |
| Down (average) | 16% | 13% | 14% |
The above table shows the average performance (from breakout to ultimate high/low) of right-angled ascending broadening top chart patterns in bull markets over three decades.
Upward breakouts did best in the 2000s but worst in the 2010s. Downward breakouts outperformed in the 1990s but didn't vary much among the decades.

The above figure shows an example of a right-angled and ascending broadening formation. A strong advance begins at point D and that leads to the right-angled and ascending broadening formation. Price bounces between two diverging trendlines before it closes outside the bottom trendline at A. This marks the downward breakout. Price recovers and busts the pattern at C when price moves above the top of the chart pattern. A throwback completes at B and price climbs thereafter.
Below are some of the lessons I learned from trading these patterns over the decades. You can use the Patternz simulator to reproduce the charts in full. I downloaded the data from Tiingo but not all stocks currently trade.
I present the information in slider format, so be sure to click the left or right arrows to view another slide.
Please note: These tips are for swing traders or even scalpers, those who want to trade from low to high or skim off a few bucks, and not for buy-and-hold investors.

AMGN (Amgen, 4 June 2014 to 7 July 2014). Let's start with a winner. This RABFA chart pattern is unusual because it ignores the long term uptrend like that shown here (more of it is off the chart at the start). The stock pushes through overhead resistance setup by the broadening top (blue lines) and continues rising.
I've seen this behavior a lot where the RABFA is at the top of the chart and all it has to do is breakout to new territory, a short distance away, to be free of overhead resistance. The stock then soars. There are examples where that's not true, but it seems to be a reliable buy signal.

AEP (American Electric Power, 17 August 2011 to 1 September 2011). In this example, the stock eventually pushes above resistance. When that happens, the move can be profitable. A longer-term chart shows the stock climbing into the 60s, but it was a bumpy ride.

ABDE (Adobe 2/9/12 to 3/2/12). In this example of a failed trade, the chart pattern neared the bottom of overhead resistance setup by prior peaks and valleys (between the two horizontal red lines).
The chart pattern broke out upward but soon reversed and dropped below the bottom of the chart pattern, where a stop loss order waited.

AEL (American Equity Investment Life Holding from 29 September 2016 to 24 October 2016). The horizontal red line shows where I expected overhead resistance to stop an advance. With price sitting at the top of the chart pattern (the RABFA), there wasn't a lot of room for growth. So I skipped the trade. The pattern broke out downward, reversed, and busted the downward breakout. Although it looks as if the stock didn't rise far, the bust carried it to 28 (not shown).

ADSK (Autodesk from 26 August 2014 to 19 September 2014). Here's an example of a multipeak pattern posing overhead resistance that stops an advance.
The triple top (blue circle) signals overhead resistance is present, combined with the earlier peak (February 2014), presents a challenge that the stock can't overcome. The stock hits resistance and reversed, busting the upward breakout.

ARW (Arrow Electronics from 15 December 2016 to 25 January 17). A fast rise in the stock lead to a slowdown when the RABFA formed. An upward breakout didn't take the stock much higher at all before it failed. This type of failure is hard to identify because what is meant by a 'fast rise'? Does a fast move actually cause price to retrace?

ADBE (Adobe 9/27/16 to 10/24/2016). The tall gap is what I consider as part of a fast rise setup. It's a dangerous setup for a bullish trader. Price rises quickly going into the pattern and often the breakout is downward. No buy signal triggers, so traders remain out of the stock. But you'll want to avoid the fast rise leading to the start of a chart pattern.
I show another example of the fast rise in the inset box in Amazon.com stock.

ALK (Alaska Air from 19 June 2014 to 16 July 2014). This is another variation of the 'avoid the long uptrend' setup. In this case, the chart pattern appears after a long uptrend. In this case, placing a buy stop a penny above the top of the chart pattern avoids buying this stock and suffering through the decline.

AGO (Assured Guaranty from 23 August 2016 to 8 September 2016). The RABFA broke out downward so a buy stop didn't trigger until the pattern busted the downward breakout. The price made a strong push higher, piercing overhead resistance.

ACN (Accenture PLC, from 28 April 2015 to 11 May 2015). The RABFA formed and it looked like it might be part of a double top so I avoided the trade. However, the stock climbed to a high of 105 before reversing and the potential double top never confirmed as a valid chart pattern (which means the stock didn't close below the lowest valley between the two peaks, so it wasn't a valid double top).
The following is a slide show. Click the right or left arrows, or the circles below the chart to navigate around the slides.
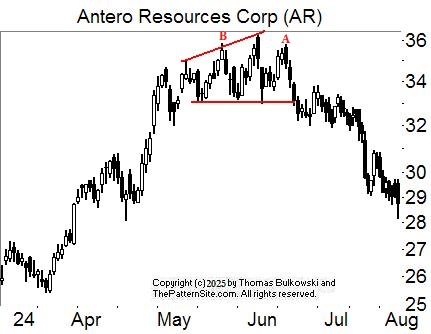
A right-angled broadening formation, ascending (RABFA) appears highlighted with red trendlines. At A, a partial rise correctly predicts a downward and immediate breakout. However, when combined with B, the three-peak pattern is a head-and-shoulders top. That doesn't change the RABFA, though.

Red lines highlight a RABFA.

Red lines highlight a RABFA. At A, the pattern breaks out downward, making the RABFA act as a short-term reversal of the uptrend.

Red lines highlight a RABFA.

Red lines highlight a RABFA.

Red lines highlight a RABFA. At A, price pulls back to the breakout price. Pullbacks happen 63% of the time for this chart pattern.

Red lines highlight a RABFA. At A, a partial decline correctly predicts an upward breakout. Partial declines work 80% of the time for this chart pattern.

Red lines highlight a RABFA. Notice how the RABFA reverses the downtrend from A, and sends price soaring to B.

The red lines highlight a RABFA. At A, a throwback completes. Throwbacks happen 68% of the time.

The red lines highlight a RABFA.
-- Thomas Bulkowski
Support this site! Clicking any of the books (below) takes you to
Amazon.com If you buy ANYTHING while there, they pay for the referral.
Legal notice for paid links: "As an Amazon Associate I earn from qualifying purchases."
|
My Stock Market Books
|
My Novels
Orb Foresight Rewrite Coming!
|
I hit the CTRL key but I'm still not in control!![]()