As of 04/02/2026
Indus: 46,505 -61.07 -0.1%
Trans: 19,089 +159.40 +0.8%
Utils: 1,174 +8.73 +0.7%
Nasdaq: 21,879 +38.23 +0.2%
S&P 500: 6,583 +7.37 +0.1%
|
YTD
-3.2%
+10.0%
+9.9%
-5.9%
-3.8%
|
|
As of 04/02/2026
Indus: 46,505 -61.07 -0.1%
Trans: 19,089 +159.40 +0.8%
Utils: 1,174 +8.73 +0.7%
Nasdaq: 21,879 +38.23 +0.2%
S&P 500: 6,583 +7.37 +0.1%
|
YTD
-3.2%
+10.0%
+9.9%
-5.9%
-3.8%
|
|
As of 04/02/2026
Indus: 46,505 -61.07 -0.1%
Trans: 19,089 +159.40 +0.8%
Utils: 1,174 +8.73 +0.7%
Nasdaq: 21,879 +38.23 +0.2%
S&P 500: 6,583 +7.37 +0.1%
|
YTD
-3.2%
+10.0%
+9.9%
-5.9%
-3.8%
| |
|
| ||
Updated and added 10 examples on 7/22/25.
For more information on this pattern, read Encyclopedia of Chart Patterns, 3rd Edition. If you click on the link and then buy the book (or anything else) while you're there, the referral will help support this site. Thanks.
$ $ $
Performance of descending broadening wedges is near the bottom of the list. You'll find them most often with upward breakouts in bull markets. Downward breakouts are rare. As with other broadening patterns, partial rises and declines predict the breakout direction. Partial declines work particularly well, but are difficult to distinguish from the pauses that normally occur as price bounces from trendline to trendline.

Descending Broadening Wedge
|
The above numbers are based on 757 perfect trades. See the glossary for definitions.
| Characteristic | Discussion |
| Price trend | Can be up or down leading to the pattern. |
| Shape | A megaphone tilted down. |
| Trendlines | Both trendlines slope downward. |
| Touches | For proper identification, look for at least five trendline touches (three or more touches of one trendline, two or more of the other) at minor highs or lows. Price cutting through a trendline doesn't count as a touch (that happens most at the start and breakout of the pattern). |
| Volume trend | Trends upward. |
![]() More (#ad)
More (#ad)
Consult the associated figure on the right.
| Trading Tactic | Explanation |  The Measure Rule
|
| Measure rule | For upward breakouts, use the highest peak (A) in the chart pattern as the target. For downward breakouts, compute the difference between the highest peak (A) and the lowest valley B in the chart pattern to get the height. Multiply the height by the above "percentage meeting price target" and then subtract it from the lowest valley (B) to get a price target. | |
| Intraformation trade | Short at the top (1) when price heads down. Cover at the bottom trendline (2). | |
| Buy at 3rd touch | When price touches the bottom trendline for the third time (see point 3) and begins rising, buy. Price may breakout on the following trip across the chart pattern. | |
| Short at the top | When price touches the top trendline (1) and begins falling, sell or sell short. | |
| Partial rise | A partial rise works just 36% of the time, so don't rely on it. | |
| Partial decline | A partial decline works 79% of the time | |
| Price trend | For upward breakouts, the best performing patterns are those with a long-term (more than six months) rise leading to the pattern. | |
| Yearly low | For both breakout directions, the best performing are those with breakouts within a third of the yearly low, but the results are close. | |
| Volume trend | Downward breakouts favor a rising volume trend and upward breakouts show better performance when volume trends downward throughout the pattern. | |
| Breakout | The breakout direction is upward 72% of the time. | |
| Throwbacks and pullbacks | Pullbacks hurt performance. Throwbacks see no performance difference. |
![]() More (#ad)
More (#ad)

The above figure shows an example of a descending broadening wedge chart pattern. The formation begins at point A. This long and loose descending broadening wedge is typical for this chart pattern type. A partial decline forms at B, and that might be the only redeeming feature of this chart pattern. However, price breaks out upward and reaches the target within a week of the breakout. The target appears as the dashed green line on the chart.
![]() More (#ad)
More (#ad)
I present the information in slider format, so be sure to click the left or right arrows to view another slide.
For targets, I used the pattern's height added to the top of the pattern (Patternz software automatically calculates this for you). This is different from the measure rule target which is the top of the pattern for upward breakouts.
Not shown in the slide list is that patterns that form after a long uptrend may be closer to the trend's end than the start. Try to gauge if the up trend is long (like a year or more) and if the pattern is closer to the end than the beginning of the trend. Because we can't know when the trend will end, you're guessing. But if the uptrend has been in existence for a long time, then the risk of failure is higher.

This chart shows an example of a busted (or soon to be busted) descending broadening wedge. Price breaks out downward, drops some but not much, before reversing and staging an upward breakout.

Trade upward breakouts, not ones that breakout downward (by that I mean it's best to enter a long trade when price breaks out above the top trendline. I avoid going short). A breakout happens when price closes above the top trendline, like that shown. In this example, the stock retraced but remained a few cents above a stop loss order placed a penny below the bottom of the chart pattern. This one went on to make a nice gain.

Be careful going long at the bottom trendline. If you buy HON at point 1, you can ride it up to the top trendline, 2. Sell there. If you hang on, you might have an upward breakout or you could watch your stock tumble to 3. At 4, it slides below the bottom of the chart pattern and likely hits a stop placed there. Price bounces to the green circle before dropping to 5.
The problem with buying at a bottom trendline touch is that the stock could breakout downward. If you bought at 3, for example, expecting an upward bounce, it broke out of the pattern downward instead.
The inset shows an example of a wedge with a downward breakout.

Beware steep patterns. If a wedge has steep trendlines, the pattern's height makes for a taller price target. Shallower patterns seem to work better (more reliable, but I haven't tested this) and the price target is closer.
Here I show a shallow descending broadening wedge. Not shown but the stock went onto a big gain.

Compare the slope of this descending broadening wedge with the prior chart. This has trendlines with a steep slope. The breakout, in this example, is upward but the pattern fails to reach its target calculated by the height of the pattern added to the price at the top of the pattern. Sometimes, you may wish to use the top of the pattern as the target for unusually tall wedges.

Here's an example of where the upward breakout happens well after the pattern ends. Price collapses and the trade fails. Avoid those situations, like this one, where the breakout is delayed.

A downward retrace (where the wedge sits in this example) in an uptrend works well when the uptrend resumes. This type of setup seems to work well (when the wedge forms in the retrace and price breaks out upward).

Place a stop loss order a penny below the bottom of the chart pattern to help limit a loss.
![]() More (#ad)
More (#ad)
The following is a slide show. Click the right or left arrows, or the circles below the chart to navigate around the slides.
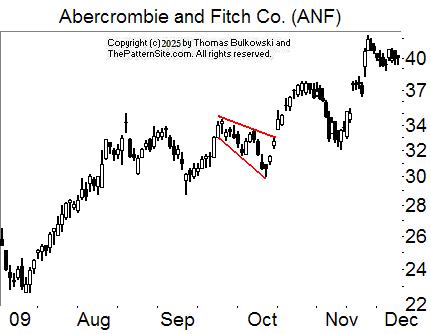
Outlined in red is a descending broadening wedge chart pattern. This one has an upward breakout.

This descending broadening wedge has price breaking out downward.

A partial decline at A correctly predicts an upward and immediate breakout. Price rises to B, perhaps because the wedge appears at the end of the long uptrend.

Outlined in red is a descending broadening wedge chart pattern with a downward breakout.

I prefer to have less white space in the middle of the wedge. A partial decline (A) fails to predict the upward breakout (the breakout wasn't immediate. Price touched the top trendline and retraced).

Outlined in red is a descending broadening wedge chart pattern.

This descending broadening wedge breaks out downward.

There are two descending broadening wedges shown. One is highlighted in red the other shares a red top trendline and a green bottom line.

Outlined in red is a descending broadening wedge chart pattern.

Outlined in red is a descending broadening wedge chart pattern. Circled in green is a failure to touch the top trendline. I'd rather see a touch there. A partial decline happens at A, followed by an upward breakout.
-- Thomas Bulkowski
![]() More (#ad)
More (#ad)
Support this site! Clicking any of the books (below) takes you to
Amazon.com If you buy ANYTHING while there, they pay for the referral.
Legal notice for paid links: "As an Amazon Associate I earn from qualifying purchases."
|
My Stock Market Books
|
My Novels
Orb Foresight Rewrite Coming!
|
If a train station is where a train stops, what is a workstation?![]()