
As of 04/20/2026
Indus: 49,443 -4.87 0.0%
Trans: 23,322 +900.05 +4.0%
Utils: 1,152 -6.38 -0.6%
Nasdaq: 24,404 -64.09 -0.3%
S&P 500: 7,109 -16.92 -0.2%
|
YTD
+2.9%
+34.4%
+7.8%
+5.0%
+3.9%
|
|
As of 04/20/2026
Indus: 49,443 -4.87 0.0%
Trans: 23,322 +900.05 +4.0%
Utils: 1,152 -6.38 -0.6%
Nasdaq: 24,404 -64.09 -0.3%
S&P 500: 7,109 -16.92 -0.2%
|
YTD
+2.9%
+34.4%
+7.8%
+5.0%
+3.9%
| |
|
| ||
$ $ $
I show another slider trading quiz featuring Head-and-shoulders, complex tops .
$ $ $
Here's a symbol list of 124 chart and candlestick patterns (13 "investment grade" candle patterns) found in today's securities using my version of Patternz: AFL, AA, ALL, AEO, AMN, ANIK, AAPL, ARCB, ACGL, AIZ, AXS, BSET, BKH, BMY, CX, CNC, CSCO, CNA, CMTL, COTY, CCRN, CTS, DFS, EMN, EBAY, ELV, WIRE, EL, XOM, EZPW, FIS, FE, FCX, GIS, GILD, HQY, HL, HUM, ILMN, INCY, NSP, IPAR, JAZZ, JBLU, JNJ, KLAC, KLIC, LHX, LRCX, LLY, MAN, MRK, MCO, MS, NEE, NWPX, NTNX, OXY, OGE, OXM, PYPL, PCG, PXD, PFG, PHM, QCOM, RGS, SAIA, SAND, SIGI, SHW, SKYW, SWN, SRDX, TOL, UNH, VMI, WAT, WMB, WWW, WDAY, ITA, IYK, IYE, FDN, IAT, IYZ, IXC, MXI, ILF, IHI, EWK, EEM, EWH, EWJ, EWM, EPP, EZA, EWY, EWT, TUR, EWU, PPA, PEJ, XLE, XLB, VIS, VAW. Click this link for details (pattern type, start and end dates).
For a list of small patterns (those a few days wide) click this link.
$ $ $
The following table shows where Fibonacci retrace values of the day's high-low range are plus pivot points, calculated on the Dow industrials, sorted by value. When several are near each other (small differences), the area might act as support or resistance.
-- Thomas Bulkowski, author: Invest for Two-Comma Wealth (#Ad) ![]()
![]()
| © 2024 ThePatternSite.com Metric | Value | Diff | Close (within 10% of the high-low range for the day)? |
| Monthly S2 | 36,365.05 | ||
| Monthly S1 | 37,375.57 | 1,010.52 | |
| Weekly S2 | 37,426.87 | 51.30 | |
| Weekly S1 | 37,906.48 | 479.61 | |
| Daily S2 | 38,145.19 | 238.71 | |
| Low | 38,215.47 | 70.28 | |
| Weekly Pivot | 38,233.99 | 18.52 | Yes! The Weekly Pivot is close to the Low. |
| Daily S1 | 38,265.64 | 31.65 | |
| Open | 38,282.16 | 16.52 | Yes! The Open is close to the Daily S1. |
| 61.8% Down from Intraday High | 38,288.33 | 6.17 | Yes! The 61.8% Down from Intraday High is close to the Open. |
| 50% Down from Intraday High | 38,310.84 | 22.51 | |
| 38.2% Down from Intraday High | 38,333.34 | 22.50 | |
| Daily Pivot | 38,335.92 | 2.58 | Yes! The Daily Pivot is close to the 38.2% Down from Intraday High. |
| Close | 38,386.09 | 50.17 | |
| High | 38,406.20 | 20.11 | |
| Daily R1 | 38,456.37 | 50.17 | |
| Daily R2 | 38,526.65 | 70.28 | |
| Monthly Pivot | 38,622.08 | 95.43 | |
| Weekly R1 | 38,713.60 | 91.52 | |
| Weekly R2 | 39,041.11 | 327.51 | |
| Monthly R1 | 39,632.60 | 591.49 | |
| Monthly R2 | 40,879.11 | 1,246.51 |
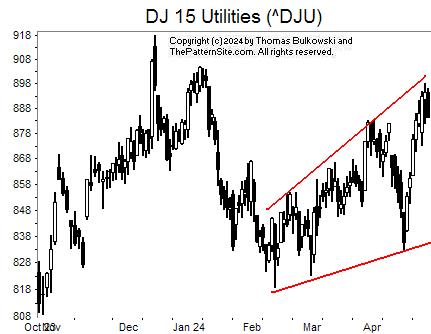
I show the Dow utilities on the daily scale.
Outlined in red is a chart pattern called an ascending broadening wedge. That has two trendlines (red lines in this example) trending upward but widening (diverging).
Stocks showing ascending broadening wedges breakout downward 52% of the time. I'm surprised it's not higher. Because the index is near the top trendline, we'll see if it breaks out upward first (by closing above the top red line).
![]()
The following is a brief review of how the markets performed over time. The numbers refer to the close-to-close move in the Dow industrials.
No options expire this week.
![]()
The following is based on an SFO article in December 2004 by John Seekinger, titled, "Take a two-dimensional approach." He offers these tips.
| Index | S2 | S1 | Pivot | R1 | R2 |
| Dow Industrials (^DJI): Daily | 37,942 | 38,091 | 38,214 | 38,363 | 38,487 |
| Weekly | 37,378 | 37,809 | 38,185 | 38,616 | 38,992 |
| Monthly | 36,316 | 37,278 | 38,573 | 39,535 | 40,830 |
| S&P500 (^GSPC): Daily | 5,054 | 5,077 | 5,096 | 5,119 | 5,137 |
| Weekly | 4,916 | 5,008 | 5,061 | 5,153 | 5,207 |
| Monthly | 4,795 | 4,947 | 5,106 | 5,259 | 5,417 |
| Nasdaq (^IXIC): Daily | 15,683 | 15,805 | 15,893 | 16,016 | 16,103 |
| Weekly | 15,010 | 15,469 | 15,725 | 16,184 | 16,440 |
| Monthly | 14,613 | 15,270 | 15,880 | 16,538 | 17,148 |
Here are the formulas:
![]()
Earnings season is either underway or should be starting soon. The sessions could be more volatile.
Here's a symbol list of 130 chart and candlestick patterns (13 "investment grade" candle patterns) found in today's securities using my version of Patternz: ACN, AEIS, AFL, ALGT, ALL, AEO, AEP, AON, AMAT, ATR, ARCB, AXS, BSET, BECN, BZH, BMRN, BFH, BCO, BBW, CHKP, CVX, CSCO, CLF, ED, CSGP, COST, COTY, CR, CCRN, CCK, DVN, DFS, DSGR, DTE, BOOM, EIX, EFX, EL, FIS, FE, FIVN, GIS, GMS, HOV, HURC, IDXX, NSP, IBP, ISRG, JNJ, KBH, KLAC, KLIC, LHX, LZB, LEN, M, MCHX, MS, MLI, NFG, NTGR, NEU, NEE, OGE, ORI, OXM, PKE, PRFT, PCG, PHM, KWR, DGX, ROST, RES, SAIA, SAND, SIGI, SMTC, SCI, SKX, SMAR, SO, SCCO, SWN, SPSC, SXI, SUM, TFX, TER, TXN, TTD, TOL, TWLO, VMC, WWW, IDU, FXI, BOTZ, ITB, IHI, EEM, EWQ, EWH, EWM, EPP, EZA, EWY, TUR, GLD, XHB, XAR, XLU. Click this link for details (pattern type, start and end dates).
For a list of small patterns (those a few days wide) click this link.
The below industries were the best (rank 1) or worst performing of those I follow.
|
-- Thomas Bulkowski, author: Invest for Two-Comma Wealth(#Ad) ![]()
![]()
$ $ $
Here's a symbol list of 113 chart and candlestick patterns (13 "investment grade" candle patterns) found in today's securities using my version of Patternz: ACN, AFL, ALGT, AEE, AEP, AEL, AME, AMGN, APA, ADM, BCPC, BECN, BIG, BKNG, BFH, BMY, BRKR, BG, CACI, CNP, CENX, CNA, CL, COTY, DECK, DFS, ELV, EME, EL, EVH, EXC, FE, FORM, GIS, GILD, HQY, HP, HON, HUM, JBHT, HURC, IDXX, JBLU, JNJ, LLY, LMT, M, MLM, MAS, MRK, META, MGEE, MS, MYGN, NTAP, NWL, NEU, NOC, NWPX, NUS, OGE, ASGN, OXM, PRFT, PFE, PCG, PLXS, DGX, RMBS, RGA, ROST, R, CRM, SCCO, LUV, SWN, SRDX, TRGP, TFX, TDC, TER, TXT, TDG, TZOO, TG, VMI, VEEV, WU, WWW, WDAY, IYM, IHE, SOXX, ITB, EWK, EWH, EWS, EZA, EWL, PXJ, XLB, XLU, USO. Click this link for details (pattern type, start and end dates).
For a list of small patterns (those a few days wide) click this link.
$ $ $
You can find setups based on a Fibonacci retrace by clicking on the link.
The following patterns were found manually, not using Patternz. Mr. Bulkowski has excluded any securities he owns from appearing in the list. However, he may add any of the securities listed to his portfolio at any time, just as you can.
In the table below, the red and green colors are based on the historical breakout direction for the associated chart pattern. If a high and tight flag appears, the start and end dates highlight the flagpole only and not the flag.
For details about the chart patterns, click here.
-- Thomas Bulkowski, author: Invest for Two-Comma Wealth (#Ad) ![]()
![]()
| Symbol | Chart Pattern | Bullish Bearish | Start | End | Industry |
| APH | Double Top, Adam and Eve | 03/25/2024 | 04/04/2024 | Electronics | |
| ADP | Triangle, symmetrical | 03/15/2024 | 04/24/2024 | IT Services | |
| BCPC | Head-and-shoulders top | 02/29/2024 | 03/21/2024 | Chemical (Specialty) | |
| BIO | Double Top, Adam and Eve | 02/16/2024 | 03/22/2024 | Medical Supplies | |
| BMRN | Double Top, Adam and Adam | 04/12/2024 | 04/24/2024 | Biotechnology | |
| BLDR | Head-and-shoulders top | 03/08/2024 | 04/04/2024 | Retail Building Supply | |
| CAL | Scallop, descending | 03/27/2024 | 04/24/2024 | Shoe | |
| CLS | Pipe top | 04/01/2024 | 04/08/2024 | Electronics | |
| ED | Double Bottom, Adam and Adam | 03/26/2024 | 04/16/2024 | Electric Utility (East) | |
| COTY | Pipe bottom | 04/08/2024 | 04/15/2024 | Toiletries/Cosmetics | |
| DFS | Pipe bottom | 04/08/2024 | 04/15/2024 | Financial Services | |
| D | Double Bottom, Adam and Adam | 03/26/2024 | 04/16/2024 | Electric Utility (East) | |
| DRQ | Head-and-shoulders top | 02/27/2024 | 04/03/2024 | Oilfield Svcs/Equipment | |
| DUK | Broadening top | 03/11/2024 | 04/19/2024 | Electric Utility (East) | |
| ELV | Triple bottom | 03/01/2024 | 04/12/2024 | Medical Services | |
| FRD | Triangle, ascending | 04/05/2024 | 04/25/2024 | Building Materials | |
| GIS | Pipe bottom | 04/08/2024 | 04/15/2024 | Food Processing | |
| NSP | Triple bottom | 04/05/2024 | 04/16/2024 | Human Resources | |
| JBLU | Dead-cat bounce | 04/23/2024 | 04/23/2024 | Air Transport | |
| RAMP | Triangle, symmetrical | 03/11/2024 | 04/03/2024 | Computer Software and Svcs | |
| NFLX | Double Top, Eve and Eve | 03/21/2024 | 04/08/2024 | Internet | |
| NTNX | Double Top, Eve and Eve | 03/08/2024 | 04/11/2024 | E-Commerce | |
| OUT | Scallop, ascending and inverted | 02/20/2024 | 04/19/2024 | Advertising | |
| POR | Triple bottom | 03/14/2024 | 04/16/2024 | Electric Utility (West) | |
| RES | Head-and-shoulders top | 04/08/2024 | 04/23/2024 | Oilfield Svcs/Equipment | |
| TWLO | Triple top | 03/13/2024 | 04/01/2024 | E-Commerce | |
| UHAL | Triangle, ascending | 01/31/2024 | 04/03/2024 | Trucking/Transp. Leasing | |
| VLO | Pipe top | 04/01/2024 | 04/08/2024 | Petroleum (Integrated) | |
| VECO | Big M | 03/01/2024 | 04/09/2024 | Precision Instrument | |
| MDRX | Triangle, descending | 03/18/2024 | 04/25/2024 | Healthcare Information | |
| WWW | Pipe bottom | 04/08/2024 | 04/15/2024 | Shoe |
![]()
Since I post this the night before, check how the futures are trading before market open. Large moves can affect the opening direction.
$ $ $
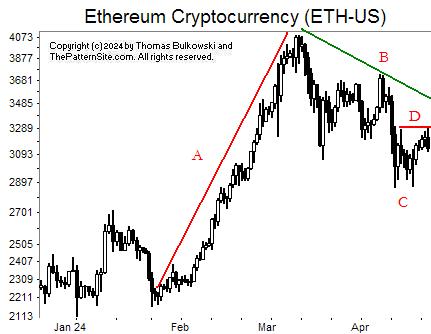
I show a picture of Ethereum on the daily scale.
Let's go through it by the letters.
At A, we see a strong uptrend, what I call a straight-line run up. There are few pauses along the way in a breath-taking rise.
At B, we see a messy retrace. Price can't decide on a direction so it falls and retraces. Rinse. Repeat.
At C, we see a potential double bottom. It hasn't confirmed as a valid double bottom because the currency hasn't closed above line D, which is the highest peak between the two bottoms. If the double bottom confirms, then look for the currency to rise. Until then, there's a substantial risk that it'll tumble (like 44% or something like that).
$ $ $
Here's a symbol list of 104 chart and candlestick patterns (13 "investment grade" candle patterns) found in today's securities using my version of Patternz: ANF, AFL, AMZN, AEE, AEO, AEL, AME, AMN, APH, ANIK, APA, ATO, BSET, BSX, BRC, BMY, CACI, CDNS, CPB, CNP, CHD, CINF, CLF, CMTL, COTY, CR, CCK, DECK, XRAY, DFS, ECL, EL, EG, EVH, FAST, FE, GME, GIS, HQY, HP, HUM, JBHT, HURC, IDA, NSP, JBLU, K, LDOS, LLY, LPLA, MANH, MCHX, MAS, MGEE, MS, NWPX, NUS, NVDA, OGE, OLN, OMC, ASGN, ON, OXM, PDCO, PCG, PG, PEG, PSTG, RL, RGA, RCKY, RGLD, SCCO, TDY, TXT, UGI, UNM, VEEV, WRB, WSO, WU, WWW, WDAY, ZBRA, ITA, IHE, FXI, EWK, EWH, EWM, PHO, XLB. Click this link for details (pattern type, start and end dates).
For a list of small patterns (those a few days wide) click this link.
$ $ $
The following table shows where Fibonacci retrace values of the day's high-low range are plus pivot points, calculated on the Nasdaq composite, sorted by value. When several are near each other (small differences), the area might act as support or resistance.
-- Thomas Bulkowski, author: Invest for Two-Comma Wealth (Ad)
![]()
| © 2024 ThePatternSite.com Metric | Value | Diff | Close (within 10% of the high-low range for the day)? |
| Monthly S2 | 14,508.72 | ||
| Weekly S2 | 14,671.11 | 162.39 | |
| Monthly S1 | 15,110.73 | 439.62 | |
| Weekly S1 | 15,191.93 | 81.20 | |
| Daily S2 | 15,524.17 | 332.24 | |
| Daily S1 | 15,618.46 | 94.29 | |
| Low | 15,634.44 | 15.98 | Yes! The Low is close to the Daily S1. |
| 61.8% Down from Intraday High | 15,712.58 | 78.14 | |
| Close | 15,712.75 | 0.17 | Yes! The Close is close to the 61.8% Down from Intraday High. |
| Daily Pivot | 15,728.73 | 15.98 | Yes! The Daily Pivot is close to the Close. |
| 50% Down from Intraday High | 15,736.72 | 7.99 | Yes! The 50% Down from Intraday High is close to the Daily Pivot. |
| Weekly Pivot | 15,743.60 | 6.88 | Yes! The Weekly Pivot is close to the 50% Down from Intraday High. |
| 38.2% Down from Intraday High | 15,760.86 | 17.26 | Yes! The 38.2% Down from Intraday High is close to the Weekly Pivot. |
| Open | 15,805.60 | 44.74 | |
| Daily R1 | 15,823.02 | 17.42 | Yes! The Daily R1 is close to the Open. |
| Monthly Pivot | 15,824.80 | 1.78 | Yes! The Monthly Pivot is close to the Daily R1. |
| High | 15,839.00 | 14.20 | Yes! The High is close to the Monthly Pivot. |
| Daily R2 | 15,933.29 | 94.29 | |
| Weekly R1 | 16,264.42 | 331.13 | |
| Monthly R1 | 16,426.81 | 162.39 | |
| Weekly R2 | 16,816.09 | 389.28 | |
| Monthly R2 | 17,140.88 | 324.79 |
This is a picture of the chart pattern indicator on the daily scale. The indicator is the line chart below a chart of the S&P 500 composite.
The CPI turned bullish today (Tuesday, after the close). The vertical green bar on the far right of the chart shows this. Two bands of neutral signal preceded the green bar.
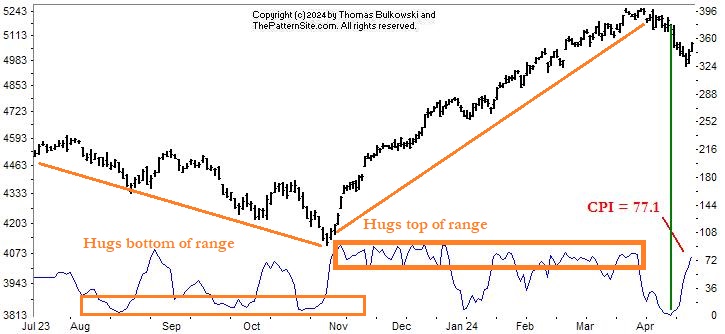
This chart shows how the CPI has changed over time. The thin green line shows the timing of the CPI reaching bottom (bearish) before heading higher.
A reading of 35 is the separator between bearish and neutral. Sixty-five is the threshold to turn a neutral signal bullish. Currently, the CPI is 77.1.
Signals can change for up to a week, so that's a factor. My guess is that yes, the S&P 500 has turned bullish, that the retrace is over.
Notice that from November to March, how the CPI hugged the upper portion of the 0 to 100 range. Compare that to the July to November line, where it hugged zero (the bottom of the range).
$ $ $
Here's a symbol list of 116 chart and candlestick patterns (13 "investment grade" candle patterns) found in today's securities using my version of Patternz: ABM, AXDX, ACIW, AFL, ALL, AEE, AEL, AFG, APA, ASH, BAX, BBY, BMRN, BA, BOOT, BFH, BMY, BRKR, CACI, CNP, CI, CINF, CLF, CNA, CL, CMCO, COTY, CRH, FANG, DFS, D, DUK, EIX, EL, EG, FDS, FICO, FISV, FNV, GIS, HBI, HE, HQY, HOLX, HUBG, HURC, JAZZ, JBLU, KELYA, KMB, LZB, LANC, L, MCHX, MTRN, MRK, MGEE, MS, MLI, NFG, NUS, ASGN, OR, OXM, PKG, PANW, PCG, POR, PPL, PG, QTWO, DGX, RLI, SAND, SRE, SHW, SO, SCCO, SNPS, TMO, UHAL, VFC, VMI, VMC, WRB, WMT, WU, WWW, ZBRA, ITA, IYK, FXL, FXI, IYF, EWO, EWK, EWG, EWH, EWI, EWM, EWS, EWP, EWL, THD, PBE, PHO, XLP. Click this link for details (pattern type, start and end dates).
For a list of small patterns (those a few days wide) click this link.
-- Thomas Bulkowski, author: Invest for Two-Comma Wealth (Ad)
![]()
$ $ $
I show another slider trading quiz featuring head-and-shoulders, complex bottoms.
$ $ $
Here's a symbol list of 104 chart and candlestick patterns (13 "investment grade" candle patterns) found in today's securities using my version of Patternz: ALB, ALL, AMZN, AEE, APA, ACGL, AVY, BECN, BBY, BMRN, CBT, CACI, CLS, CNP, CLNE, CNA, GLW, CSGP, DSGR, EVRG, FAST, FORM, FDP, FRD, GGG, HL, HSII, HWM, HURC, JKHY, JAZZ, JBLU, K, KMT, KMB, KSS, KLIC, LHX, LZB, LAMR, LEG, RAMP, LPLA, M, MCHX, MAS, MTRX, MRCY, MU, MUR, NFG, NOV, NKE, NWPX, ASGN, OTEX, POR, PG, DGX, NOW, STR, SKX, SXI, SCS, SRDX, TPR, TGT, TKR, RIG, UNM, VLO, WLK, WOLF, WWW, IEZ, FDN, FXI, BOTZ, IYZ, IXC, IGE, IYF, EWK, ECH, EWI, EWM, EWS, EWL, EWT, EWU, XRT. Click this link for details (pattern type, start and end dates).
For a list of small patterns (those a few days wide) click this link.
$ $ $
The following table shows where Fibonacci retrace values of the day's high-low range are plus pivot points, calculated on the Dow industrials, sorted by value. When several are near each other (small differences), the area might act as support or resistance.
-- Thomas Bulkowski, author: Invest for Two-Comma Wealth (Ad)
![]()
| © 2024 ThePatternSite.com Metric | Value | Diff | Close (within 10% of the high-low range for the day)? |
| Monthly S2 | 36,302.71 | ||
| Monthly S1 | 37,271.34 | 968.64 | |
| Weekly S2 | 37,304.20 | 32.86 | Yes! The Weekly S2 is close to the Monthly S1. |
| Daily S2 | 37,761.98 | 457.78 | |
| Weekly S1 | 37,772.09 | 10.11 | Yes! The Weekly S1 is close to the Daily S2. |
| Low | 37,985.07 | 212.98 | |
| Daily S1 | 38,000.98 | 15.91 | Yes! The Daily S1 is close to the Low. |
| Weekly Pivot | 38,079.45 | 78.47 | |
| Open | 38,116.89 | 37.44 | Yes! The Open is close to the Weekly Pivot. |
| 61.8% Down from Intraday High | 38,161.59 | 44.70 | Yes! The 61.8% Down from Intraday High is close to the Open. |
| 50% Down from Intraday High | 38,216.11 | 54.52 | |
| Daily Pivot | 38,224.07 | 7.96 | Yes! The Daily Pivot is close to the 50% Down from Intraday High. |
| Close | 38,239.98 | 15.91 | Yes! The Close is close to the Daily Pivot. |
| 38.2% Down from Intraday High | 38,270.64 | 30.66 | Yes! The 38.2% Down from Intraday High is close to the Close. |
| High | 38,447.16 | 176.52 | |
| Daily R1 | 38,463.07 | 15.91 | Yes! The Daily R1 is close to the High. |
| Weekly R1 | 38,547.34 | 84.27 | |
| Monthly Pivot | 38,580.20 | 32.86 | Yes! The Monthly Pivot is close to the Weekly R1. |
| Daily R2 | 38,686.16 | 105.96 | |
| Weekly R2 | 38,854.70 | 168.54 | |
| Monthly R1 | 39,548.83 | 694.13 | |
| Monthly R2 | 40,857.69 | 1,308.86 |
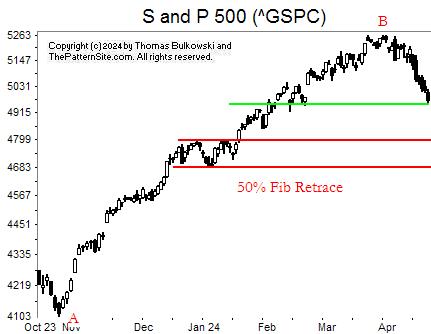
This is a chart of the S&P 500 index on the daily scale.
The horizontal green line shows where we (the index, that is) are now compared to where we've been.
The red lines highlight a support zone, bottoming with a 50% Fibonacci retrace of the rise from A to B. Does that make sense?
Translation: I measured the move from valley A to peak B, took half of it and found it matched the bottom red line. Between the two red lines are where the index paused in its move higher.
It's where I expect the index will find support. It might not drop to the top red line or it might drop below the bottom one.
Indeed, I find it hard to believe the index will drop to the red line. My gut says that it'll turn before then. Let's wait and see.
![]()
The following is a brief review of how the markets performed over time. The numbers refer to the close-to-close move in the Dow industrials.
No options expire this week.
![]()
The following is based on an SFO article in December 2004 by John Seekinger, titled, "Take a two-dimensional approach." He offers these tips.
| Index | S2 | S1 | Pivot | R1 | R2 |
| Dow Industrials (^DJI): Daily | 37,636 | 37,811 | 37,957 | 38,132 | 38,278 |
| Weekly | 37,220 | 37,603 | 37,995 | 38,378 | 38,770 |
| Monthly | 36,218 | 37,102 | 38,496 | 39,380 | 40,773 |
| S&P500 (^GSPC): Daily | 4,914 | 4,941 | 4,980 | 5,006 | 5,045 |
| Weekly | 4,815 | 4,891 | 5,030 | 5,106 | 5,245 |
| Monthly | 4,751 | 4,859 | 5,062 | 5,170 | 5,373 |
| Nasdaq (^IXIC): Daily | 15,007 | 15,144 | 15,360 | 15,498 | 15,714 |
| Weekly | 14,528 | 14,905 | 15,600 | 15,977 | 16,673 |
| Monthly | 14,365 | 14,824 | 15,681 | 16,140 | 16,997 |
Here are the formulas:
![]()
Earnings season is either underway or should be starting soon. The sessions could be more volatile.
Here's a symbol list of 147 chart and candlestick patterns (13 "investment grade" candle patterns) found in today's securities using my version of Patternz: ABT, ACIW, AEIS, AES, AA, ALGT, ALL, AEE, AMGN, AR, APA, AAPL, ATR, ADP, AVY, AVA, BECN, BIG, BFH, BRKR, BBW, CBT, CAL, CLS, COR, CNP, CENX, CHKP, CHD, CIEN, CLNE, CLF, CNX, CGNX, CL, CMCO, CAG, GLW, CSGP, CCRN, DSGR, BOOM, EZPW, FFIV, FICO, FAST, FE, FIVN, FLEX, FORM, GOOGL, HQY, HSII, HWM, HUBG, IIIN, PODD, IBKR, ISRG, K, KELYA, KFRC, LZB, LRCX, LANC, LLY, RAMP, M, MANH, MCHX, MAS, META, MU, MLKN, MUR, ^IXIC, NOV, NFLX, NWL, NKE, NI, NWPX, OGE, ON, OMI, OXM, PANW, PATK, PAYX, PYPL, PG, PGR, PHM, RRC, ROG, SAND, SLB, SRE, SCI, NOW, SHOP, STR, SO, SUM, SRDX, TXN, RIG, UGI, VLO, VECO, WAT, WLK, WOLF, WDAY, IYC, IEZ, FTEC, FDN, QQQ, IXC, IXN, ITB, EWK, ECH, EZA, EWP, EWT, THD, QLD, XHB, MGK, VONG. Click this link for details (pattern type, start and end dates).
For a list of small patterns (those a few days wide) click this link.
The below industries were the best (rank 1) or worst performing of those I follow.
|
-- Thomas Bulkowski, author: Invest for Two-Comma Wealth (Ad)
![]()
$ $ $
Here's a symbol list of 100 chart and candlestick patterns (13 "investment grade" candle patterns) found in today's securities using my version of Patternz: AEIS, AKAM, ALK, AMZN, AMED, AME, ANIK, APA, APOG, ARCB, AZTA, BMI, BECN, BIO, BMRN, BMY, BRKR, BLDR, CDNS, CLS, CIEN, CLNE, CNA, CNX, CGNX, ED, CAG, CXW, CSGP, DUK, ELV, EFX, XOM, FFIV, FAST, FLS, HTLD, HSIC, HOV, JBHT, INFN, IRM, JAZZ, JBLU, LZB, LRCX, RAMP, MRTN, MU, MSFT, MCO, MUR, NOV, NWL, NEE, NKE, NWPX, ORI, ON, PETS, POR, RRC, RCKY, RGLD, SAIA, SCI, STR, SO, SUM, TECH, TXN, TMO, RIG, TWLO, VLO, VECO, WAT, WLK, WOLF, WDAY, IYC, IEZ, FTEC, IXN, ECH, EEM, EWJ, THD, QLD, DBA, PBE, USO, VONG. Click this link for details (pattern type, start and end dates).
For a list of small patterns (those a few days wide) click this link.
$ $ $
You can find setups based on a Fibonacci retrace by clicking on the link.
The following patterns were found manually, not using Patternz. Mr. Bulkowski has excluded any securities he owns from appearing in the list. However, he may add any of the securities listed to his portfolio at any time, just as you can.
In the table below, the red and green colors are based on the historical breakout direction for the associated chart pattern. If a high and tight flag appears, the start and end dates highlight the flagpole only and not the flag.
For details about the chart patterns, click here.
-- Thomas Bulkowski, author: Invest for Two-Comma Wealth (Ad)
![]()
| Symbol | Chart Pattern | Bullish Bearish | Start | End | Industry |
| ANF | Three Falling Peaks | 03/05/2024 | 04/03/2024 | Apparel | |
| AMWD | Pipe top | 02/26/2024 | 03/04/2024 | Building Materials | |
| AMAT | Triple top | 03/07/2024 | 04/15/2024 | Semiconductor Cap Equip. | |
| ATR | Double Top, Adam and Adam | 03/07/2024 | 03/28/2024 | Packaging and Container | |
| AVNT | Head-and-shoulders top | 03/28/2024 | 04/09/2024 | Chemical (Specialty) | |
| BMI | Double Bottom, Adam and Eve | 03/14/2024 | 04/11/2024 | Precision Instrument | |
| BAX | Double Top, Eve and Eve | 03/08/2024 | 04/01/2024 | Medical Supplies | |
| BECN | Pipe top | 04/01/2024 | 04/08/2024 | Retail Building Supply | |
| BERY | Head-and-shoulders top | 02/22/2024 | 03/28/2024 | Packaging and Container | |
| BBY | Triple top | 03/22/2024 | 04/09/2024 | Retail (Special Lines) | |
| BIG | Roof | 03/18/2024 | 04/11/2024 | Retail Store | |
| BKH | Double Top, Adam and Eve | 03/11/2024 | 04/09/2024 | Electric Utility (West) | |
| BR | Triple top | 03/07/2024 | 04/09/2024 | Information Services | |
| CACI | Double Top, Eve and Adam | 03/05/2024 | 03/28/2024 | IT Services | |
| CAL | Double Top, Eve and Eve | 03/21/2024 | 03/27/2024 | Shoe | |
| CENX | Flag, high and tight | 02/26/2024 | 04/15/2024 | Metals and Mining (Div.) | |
| CHKP | Head-and-shoulders top | 02/06/2024 | 04/09/2024 | E-Commerce | |
| CGNX | Head-and-shoulders top | 03/14/2024 | 04/09/2024 | Precision Instrument | |
| CMCO | Pipe top | 03/25/2024 | 04/01/2024 | Machinery | |
| CXW | Double Top, Eve and Adam | 03/25/2024 | 04/09/2024 | Industrial Services | |
| GLW | Triple top | 03/04/2024 | 03/28/2024 | Telecom. Equipment | |
| CTS | Head-and-shoulders top | 03/22/2024 | 04/11/2024 | Electronics | |
| DDS | Pipe top | 03/25/2024 | 04/01/2024 | Retail Store | |
| DSGR | Double Top, Adam and Eve | 03/21/2024 | 04/04/2024 | Metal Fabricating | |
| ^DJU | Double Top, Eve and Adam | 03/28/2024 | 04/09/2024 | None | |
| EBAY | Double Top, Adam and Eve | 03/14/2024 | 03/28/2024 | Internet | |
| EIX | Double Top, Adam and Eve | 03/21/2024 | 04/08/2024 | Electric Utility (West) | |
| FFIV | Double Top, Eve and Adam | 03/12/2024 | 04/09/2024 | Internet | |
| FTNT | Double Top, Adam and Adam | 03/08/2024 | 04/04/2024 | Computer Software and Svcs | |
| FWRD | Double Top, Adam and Adam | 03/28/2024 | 04/09/2024 | Trucking/Transp. Leasing | |
| HLIT | Triple top | 03/21/2024 | 04/04/2024 | Telecom. Equipment | |
| HSIC | Pipe top | 02/20/2024 | 02/26/2024 | Medical Supplies | |
| HNI | Double Top, Adam and Eve | 02/29/2024 | 03/28/2024 | Furn/Home Furnishings | |
| HOV | Diamond top | 03/21/2024 | 04/09/2024 | Homebuilding | |
| HUBG | Double Top, Adam and Adam | 03/28/2024 | 04/08/2024 | Trucking/Transp. Leasing | |
| IBP | Diamond top | 03/25/2024 | 04/08/2024 | Retail Building Supply | |
| ISRG | Triple top | 03/04/2024 | 03/27/2024 | Medical Supplies | |
| JKHY | Double Top, Adam and Adam | 03/28/2024 | 04/09/2024 | IT Services | |
| K | Scallop, ascending and inverted | 03/14/2024 | 04/16/2024 | Food Processing | |
| KELYA | Triple top | 03/04/2024 | 03/28/2024 | Human Resources | |
| KLAC | Triple top | 03/04/2024 | 03/21/2024 | Semiconductor Cap Equip. | |
| KLIC | Head-and-shoulders top | 02/16/2024 | 04/01/2024 | Semiconductor Cap Equip. | |
| LRCX | Triple top | 03/07/2024 | 04/04/2024 | Semiconductor Cap Equip. | |
| LANC | Double Top, Eve and Eve | 03/04/2024 | 03/28/2024 | Food Processing | |
| LDOS | Double Top, Eve and Eve | 03/07/2024 | 03/28/2024 | IT Services | |
| RAMP | Pipe top | 04/01/2024 | 04/08/2024 | Computer Software and Svcs | |
| MTSI | Triple top | 04/04/2024 | 04/17/2024 | Semiconductor | |
| MGY | Double Top, Adam and Adam | 04/05/2024 | 04/12/2024 | Petroleum (Producing) | |
| MKTX | Triple top | 03/12/2024 | 04/08/2024 | Securities Brokerage | |
| MTRX | Head-and-shoulders top | 03/15/2024 | 04/08/2024 | Oilfield Svcs/Equipment | |
| MRCY | Double Top, Adam and Adam | 04/01/2024 | 04/09/2024 | Computers and Peripherals | |
| MU | Pipe top | 04/01/2024 | 04/08/2024 | Semiconductor | |
| MLI | Triple top | 03/21/2024 | 04/08/2024 | Metal Fabricating | |
| MUR | Pipe top | 04/01/2024 | 04/08/2024 | Petroleum (Integrated) | |
| NOV | Pipe top | 04/01/2024 | 04/08/2024 | Oilfield Svcs/Equipment | |
| NKE | Pipe bottom | 04/01/2024 | 04/08/2024 | Shoe | |
| NVDA | Double Top, Adam and Adam | 03/08/2024 | 03/25/2024 | Semiconductor | |
| ORI | Diamond top | 04/01/2024 | 04/08/2024 | Insurance (Prop/Casualty) | |
| ASGN | Head-and-shoulders top | 03/13/2024 | 03/28/2024 | Human Resources | |
| ORCL | Head-and-shoulders top | 03/12/2024 | 04/04/2024 | Computer Software and Svcs | |
| OXM | Diamond top | 03/08/2024 | 04/11/2024 | Apparel | |
| PNW | Double Top, Eve and Adam | 03/28/2024 | 04/09/2024 | Electric Utility (West) | |
| PPG | Double Top, Eve and Eve | 02/27/2024 | 04/01/2024 | Chemical (Diversified) | |
| QCOM | Double Top, Adam and Eve | 03/07/2024 | 04/09/2024 | Telecom. Equipment | |
| ROG | Triple top | 03/15/2024 | 04/09/2024 | Electronics | |
| SCHW | Broadening top | 03/26/2024 | 04/17/2024 | Securities Brokerage | |
| SRE | Head-and-shoulders top | 02/23/2024 | 04/02/2024 | Electric Utility (West) | |
| SPSC | Pipe top | 02/05/2024 | 02/12/2024 | E-Commerce | |
| SUM | Double Top, Eve and Adam | 03/04/2024 | 04/01/2024 | Cement and Aggregates | |
| TECH | Double Top, Eve and Adam | 12/28/2023 | 03/08/2024 | Biotechnology | |
| TEVA | Double Top, Adam and Adam | 03/27/2024 | 04/08/2024 | Drug | |
| TXT | Double Top, Eve and Eve | 03/27/2024 | 04/08/2024 | Diversified Co. | |
| TKR | Double Top, Adam and Eve | 03/22/2024 | 04/08/2024 | Metal Fabricating | |
| TJX | Double Top, Adam and Adam | 02/28/2024 | 03/28/2024 | Retail Store | |
| TDG | Triangle, ascending | 03/22/2024 | 04/18/2024 | Aerospace/Defense | |
| RIG | Pipe top | 04/01/2024 | 04/08/2024 | Oilfield Svcs/Equipment | |
| TREX | Double Top, Adam and Eve | 02/27/2024 | 03/25/2024 | Building Materials | |
| UGI | Double Top, Eve and Adam | 03/13/2024 | 04/08/2024 | Natural Gas (Distributor) | |
| VEEV | Double Top, Adam and Eve | 03/14/2024 | 03/27/2024 | Healthcare Information | |
| WLK | Pipe top | 04/01/2024 | 04/08/2024 | Chemical (Basic) | |
| WOLF | Triple top | 03/08/2024 | 04/01/2024 | Semiconductor | |
| QTEC | Head-and-shoulders top | 03/04/2024 | 03/21/2024 | Electronics | |
| SOXX | Head-and-shoulders top | 03/21/2024 | 04/04/2024 | Semiconductor |
![]()
Since I post this the night before, check how the futures are trading before market open. Large moves can affect the opening direction.
$ $ $
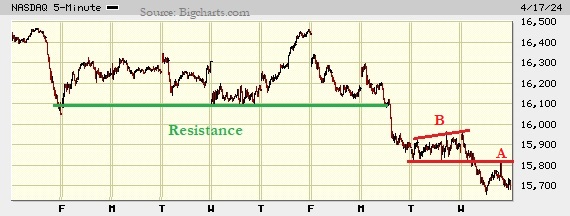
I show a picture of the Nasdaq composite on the 5-minute scale.
The horizontal green line shows where the Nasdaq found support over the prior days. It plunged through support on Monday.
At B, the index formed a chart pattern called a right-angled and ascending broadening pattern. This pattern had a downward breakout.
The index pulled back to A. A pullback is a common occurrence among chart patterns where the security (stock) returns to the breakout price (or approaches it). This is a classic example of a pullback working normally.
According to my book, Encyclopedia of Chart Patterns, 3rd Edition, these types of broadening patterns breakout downward 45%. A pullback happens 63% of the time.
What does all of this mean? Nothing is certain but my guess is that you'll see the index continue lower, at least for another day. The CPI, which I discussed yesterday, is still pinned at 0, which is the lowest it can go. Of course, a strong rebound could erase that value and change the CPI to bullish.
$ $ $
Here's a symbol list of 214 chart and candlestick patterns (13 "investment grade" candle patterns) found in today's securities using my version of Patternz: ABT, ABM, AYI, AEIS, AMD, AES, AKAM, ALB, ALL, AMZN, AMED, AEE, AXP, AMWD, AME, APH, APA, APOG, ADSK, AVA, AZTA, BSET, BECN, BZH, BMRN, BRC, BFH, BMY, BBW, BLDR, CBT, CACI, CDNS, CALM, CAL, CE, CLS, CX, CLNE, CNO, CGNX, CMCO, CAG, CXW, CR, CMI, XRAY, DDS, DOV, DUK, ECL, EIX, EVH, EXC, EXPD, FAST, FLS, GPS, GIS, GPN, GL, GMS, GPRO, GFF, HTLD, HSII, HELE, HSIC, HSY, HOV, HWM, JBHT, HUN, IDA, IBP, IPAR, ISRG, JBLU, JNJ, KFRC, LRCX, LAMR, RAMP, MTSI, MRTN, MDC, META, MU, MSFT, MOS, MUR, ^IXIC, NOV, NTAP, NWL, NKE, NWPX, NUS, NTNX, NVDA, OXY, OGE, OMCL, ORCL, OUT, PKE, PATK, PCTY, PLXS, PPL, PEG, KWR, RL, RMBS, RRC, RGS, RHI, ROL, ROST, R, SAIA, SCI, NOW, SHW, STR, SWX, SUM, TPR, TPX, TDC, TXN, TXT, TTD, TKR, TOL, RIG, TRV, TWLO, UNM, VLO, WRB, WERN, WU, WLK, WEX, XEL, ITA, IYC, IEZ, IDU, FTEC, FDN, QTEC, FXL, FXI, BOTZ, QQQ, IGV, IXN, SOXX, ITB, ECH, EEM, EWH, EWJ, THD, TUR, QLD, PPA, PEJ, PJP, PHO, ROBO, XRT, XAR, XLU, USO, SMH, MGK, VONG. Click this link for details (pattern type, start and end dates).
For a list of small patterns (those a few days wide) click this link.
$ $ $
The following table shows where Fibonacci retrace values of the day's high-low range are plus pivot points, calculated on the Nasdaq composite, sorted by value. When several are near each other (small differences), the area might act as support or resistance.
-- Thomas Bulkowski, author: Invest for Two-Comma Wealth (Ad)
![]()
| © 2024 ThePatternSite.com Metric | Value | Diff | Close (within 10% of the high-low range for the day)? |
| Monthly S2 | 15,436.43 | ||
| Daily S2 | 15,462.45 | 26.02 | Yes! The Daily S2 is close to the Monthly S2. |
| Monthly S1 | 15,559.90 | 97.45 | |
| Daily S1 | 15,572.91 | 13.01 | Yes! The Daily S1 is close to the Monthly S1. |
| Low | 15,654.51 | 81.60 | |
| Close | 15,683.37 | 28.86 | Yes! The Close is close to the Low. |
| Weekly S1 | 15,695.39 | 12.02 | Yes! The Weekly S1 is close to the Close. |
| Weekly S2 | 15,707.42 | 12.02 | Yes! The Weekly S2 is close to the Weekly S1. |
| Daily Pivot | 15,764.97 | 57.55 | |
| 61.8% Down from Intraday High | 15,770.07 | 5.10 | Yes! The 61.8% Down from Intraday High is close to the Daily Pivot. |
| 50% Down from Intraday High | 15,805.77 | 35.70 | |
| 38.2% Down from Intraday High | 15,841.47 | 35.70 | |
| Daily R1 | 15,875.43 | 33.96 | |
| Open | 15,942.29 | 66.86 | |
| High | 15,957.03 | 14.74 | Yes! The High is close to the Open. |
| Monthly Pivot | 16,049.38 | 92.35 | |
| Daily R2 | 16,067.49 | 18.11 | Yes! The Daily R2 is close to the Monthly Pivot. |
| Weekly R1 | 16,067.97 | 0.48 | Yes! The Weekly R1 is close to the Daily R2. |
| Weekly Pivot | 16,080.00 | 12.02 | Yes! The Weekly Pivot is close to the Weekly R1. |
| Monthly R1 | 16,172.85 | 92.85 | |
| Weekly R2 | 16,452.58 | 279.73 | |
| Monthly R2 | 16,662.33 | 209.75 |
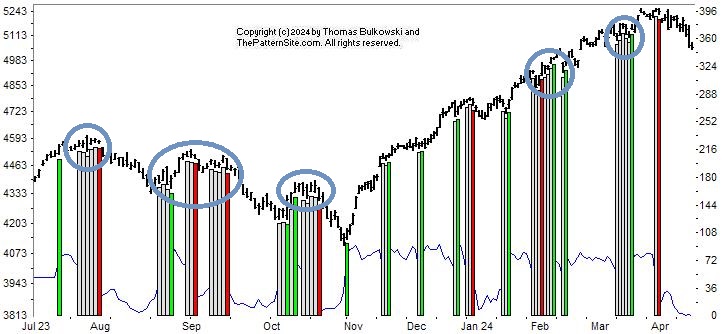
This is a picture of the chart pattern indicator on the daily scale. The indicator is the line chart below a chart of the S&P 500 composite.
This chart shows the signals. Red is bearish, white is neutral, and green is bullish. The most recent signal is bearish, as the chart shows.
The CPI has been bearish for about two weeks now.
In this chart, I circled with what looks like cyan the clusters that I thought might be significant. When a cluster appeared, the market dropped. That idea worked well for the first three circles at the start of the year but flopped for the final two (Feb and March 2024).
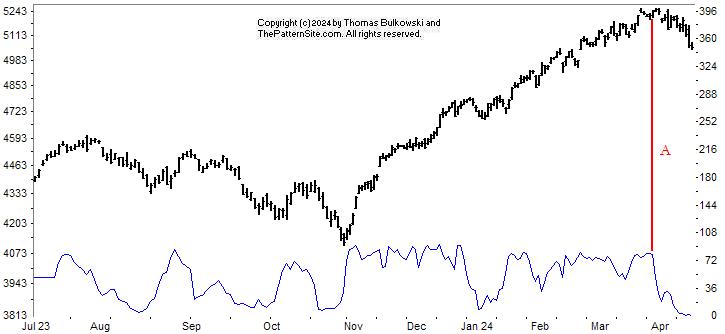
This chart shows the CPI line only, where signals below 35 are bearish and above 65 are bullish. At A, I highlight where the CPI turned bearish.
This chart doesn't show any hint of a rebound yet.
$ $ $
Here's a symbol list of 163 chart and candlestick patterns (13 "investment grade" candle patterns) found in today's securities using my version of Patternz: ABT, AXDX, AEIS, AES, AKAM, AMED, AEO, AEP, AMWD, APA, APOG, AZTA, BECN, BZH, BMRN, BAH, BRC, BFH, CLS, COR, CLNE, CLF, CNA, CMCO, CAG, COST, BOOM, EQT, EL, EXPD, FICO, FDX, FLEX, FDP, GPS, IT, GNW, GMS, GFF, GES, HSII, DHI, IBP, ITGR, IRM, JNJ, KBH, K, KLIC, LAMR, LEN, LLY, RAMP, MHO, MAN, MAS, MDC, MRCY, MU, MOS, MLI, MUR, NOV, NWL, NKE, NWPX, NUS, ASGN, PTEN, PCTY, PEN, PFE, PCG, PNW, POR, PHM, RRC, R, SLB, SAIC, SCI, SHW, STR, SRDX, TPR, TDOC, TPX, TOL, RIG, TWLO, VLO, VMI, WMT, WLK, WSC, WDAY, IAI, IYC, IEZ, FXI, IHF, IEV, IGV, MXI, ILF, IGE, ITB, EWA, EWO, EWK, EWZ, ECH, EEM, EWG, EWH, EIS, EWI, EWJ, EWM, EWW, EPP, EZA, EWY, EWD, EWL, EWT, EWU, QLD, PEJ, ROBO, XHB, VONG. Click this link for details (pattern type, start and end dates).
For a list of small patterns (those a few days wide) click this link.
-- Thomas Bulkowski, author: Invest for Two-Comma Wealth (Ad)
![]()
$ $ $
I show another slider trading quiz featuring Eve & Eve double tops.
$ $ $

I released a new novel (fiction) titled, Training "Miles", pictured on the right. This is available now in both paperback and e-book. If you have a blog or social media account, then I'd appreciate you telling your followers that the book is available. If you do post a note, then please let me know. I'm having trouble getting the word out about my latest two books. [The other book: Invest for Two-Comma Wealth, same deal except it's non-fiction. Let me know if you mention it in a social media post that it's now available (in print only). It makes a terrific school graduation present according to my friend Ronda.]
About Training "Miles":
Miles is a crystal ball who wants to be a good orb. Not only is it his job to protect his sisters, but he believes he should be in charge.
Sister Sindy thinks otherwise.
When Miles leaves home to help an autistic girl, will his desire to protect the girl cost him his life? Will Sindy remain the family bully or will she help the girl, too?
Find out by reading this inspirational novel about the life of crystal balls that will delight you as often as it brings tears.
$ $ $
Here's a symbol list of 177 chart and candlestick patterns (13 "investment grade" candle patterns) found in today's securities using my version of Patternz: ACN, ACIW, ADBE, AEIS, AMD, AES, AKAM, ALRM, ALL, AMED, AEO, AEP, AEL, AMWD, APOG, AMAT, ATR, ANET, AIZ, ADSK, AZTA, BECN, BZH, BIO, BMRN, BOOT, BAH, BRC, BFH, BLDR, CDNS, CNC, CENX, CF, CIEN, CTAS, CLNE, CLF, CNA, CMCO, COP, COST, XRAY, FANG, DDS, DOV, DRQ, DTE, BOOM, WIRE, EFX, EL, FICO, FAST, FDX, FWRD, GNW, GPN, GFS, GFF, THG, HIG, HTLD, HSII, HNI, HON, HWM, HUBG, IDXX, ILMN, INFN, IIIN, ITGR, INTU, IRM, KALU, KSS, KLIC, LZB, LH, LRCX, LANC, L, MHO, MANH, MAN, MCHX, MLM, MDT, MRK, MLI, NFLX, NOC, OMCL, ASGN, OMI, PCTY, PRFT, PFE, PCG, PINC, PGR, PHM, RRC, ROL, ROP, CRM, SLB, SAIC, SCI, NOW, SHW, SLGN, STR, SCCO, SPSC, SXI, SRDX, SNPS, TPR, TRGP, TECH, TDOC, TDC, TOL, RIG, TREX, TWLO, UNM, VFC, MDRX, VRSN, V, VC, WMT, WAT, WERN, WPM, WSC, WDAY, IYK, IHE, FTEC, QTEC, FXL, IAT, ITB, EWK, EWZ, EEM, EWH, EWJ, EWW, EPP, EWS, EWT, PBE, ROBO, XHB, XRT, UNG, VHT, VONG. Click this link for details (pattern type, start and end dates).
For a list of small patterns (those a few days wide) click this link.
$ $ $
The following table shows where Fibonacci retrace values of the day's high-low range are plus pivot points, calculated on the Dow industrials, sorted by value. When several are near each other (small differences), the area might act as support or resistance.
-- Thomas Bulkowski, author: Invest for Two-Comma Wealth (Ad)
![]()
| © 2024 ThePatternSite.com Metric | Value | Diff | Close (within 10% of the high-low range for the day)? |
| Monthly S2 | 36,488.74 | ||
| Weekly S2 | 37,072.64 | 583.90 | |
| Monthly S1 | 37,111.92 | 39.29 | Yes! The Monthly S1 is close to the Weekly S2. |
| Daily S2 | 37,197.55 | 85.63 | |
| Weekly S1 | 37,403.88 | 206.32 | |
| Daily S1 | 37,466.33 | 62.45 | Yes! The Daily S1 is close to the Weekly S1. |
| Low | 37,657.79 | 191.46 | |
| Close | 37,735.11 | 77.32 | |
| Daily Pivot | 37,926.57 | 191.46 | |
| 61.8% Down from Intraday High | 37,936.28 | 9.71 | Yes! The 61.8% Down from Intraday High is close to the Daily Pivot. |
| 50% Down from Intraday High | 38,022.30 | 86.02 | |
| Open | 38,075.38 | 53.08 | Yes! The Open is close to the 50% Down from Intraday High. |
| 38.2% Down from Intraday High | 38,108.32 | 32.95 | Yes! The 38.2% Down from Intraday High is close to the Open. |
| Daily R1 | 38,195.35 | 87.03 | |
| Weekly Pivot | 38,208.54 | 13.18 | Yes! The Weekly Pivot is close to the Daily R1. |
| High | 38,386.81 | 178.27 | |
| Monthly Pivot | 38,500.49 | 113.68 | |
| Weekly R1 | 38,539.77 | 39.29 | Yes! The Weekly R1 is close to the Monthly Pivot. |
| Daily R2 | 38,655.59 | 115.82 | |
| Monthly R1 | 39,123.67 | 468.08 | |
| Weekly R2 | 39,344.44 | 220.77 | |
| Monthly R2 | 40,512.24 | 1,167.80 |
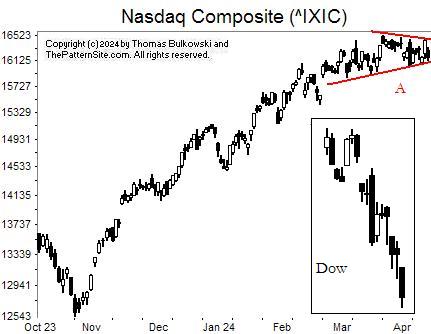
I show the Nasdaq composite on the daily scale.
What I see that's remarkable is that the index has held up so well. Compare the sideways move in the Nasdaq with the steep drop in the Dow industrials.
I show the Dow in the inset.
Of course the industrials are only 30 stocks while the Nasdaq has substantially more issues, weighted by high-tech stocks.
![]()
The following is a brief review of how the markets performed over time. The numbers refer to the close-to-close move in the Dow industrials.
Many options expire this week, so traders will be looking to close out their positions, and that suggests increased volatility (large daily price swings).
![]()
The following is based on an SFO article in December 2004 by John Seekinger, titled, "Take a two-dimensional approach." He offers these tips.
| Index | S2 | S1 | Pivot | R1 | R2 |
| Dow Industrials (^DJI): Daily | 37,618 | 37,801 | 38,060 | 38,242 | 38,502 |
| Weekly | 37,155 | 37,569 | 38,291 | 38,705 | 39,427 |
| Monthly | 36,571 | 37,277 | 38,583 | 39,289 | 40,595 |
| S&P500 (^GSPC): Daily | 5,068 | 5,096 | 5,135 | 5,163 | 5,203 |
| Weekly | 5,035 | 5,079 | 5,152 | 5,196 | 5,269 |
| Monthly | 4,986 | 5,055 | 5,160 | 5,228 | 5,334 |
| Nasdaq (^IXIC): Daily | 15,998 | 16,086 | 16,214 | 16,303 | 16,430 |
| Weekly | 15,871 | 16,023 | 16,244 | 16,396 | 16,616 |
| Monthly | 15,600 | 15,888 | 16,213 | 16,501 | 16,826 |
Here are the formulas:
![]()
Earnings season will be starting in about 1 days.
Here's a symbol list of 144 chart and candlestick patterns (13 "investment grade" candle patterns) found in today's securities using my version of Patternz: DDD, ABT, ANF, ACN, ADBE, AEIS, AMD, AFL, AKAM, ALRM, AA, AEO, AEL, ANIK, ADM, ANET, AIZ, AGO, AZTA, BALL, BIG, BIO, BIIB, BOOT, BFH, BMY, BG, CBT, CNP, CF, CHKP, CVX, CIEN, CINF, CNX, CMCO, CMTL, COP, CSGS, DHR, XRAY, FANG, DDS, DRQ, DTE, BOOM, EIX, EL, FICO, FDX, FWRD, GNW, GL, GS, HSII, HSIC, HWM, HUBG, JBHT, IDXX, ITW, INFN, INTC, KALU, KFRC, KSS, LZB, LANC, LEG, LMT, MANH, MAN, MCHX, MDT, MRK, NEU, NOC, NUS, OR, PKG, PRFT, PPG, PPL, PFG, RL, RRC, RJF, RCKY, ROL, SAIC, SHW, STR, SKX, SCCO, TRGP, TFX, TDC, RIG, VFC, VLO, VRSN, V, VC, WAT, WERN, WPM, WSC, WDAY, IAI, IYK, IHE, QTEC, FXL, BOTZ, IYH, SLV, IYF, IHI, EWK, EWZ, EEM, EWH, EIS, EPP, EWS, EWT, PBE, PEJ, SSO, XLV, XAR, VHT. Click this link for details (pattern type, start and end dates).
For a list of small patterns (those a few days wide) click this link.
The below industries were the best (rank 1) or worst performing of those I follow.
|
-- Thomas Bulkowski, author: Invest for Two-Comma Wealth (Ad)
![]()

I released a new stock market book titled, Invest for Two-Comma Wealth (#Ad). It's available from Amazon.com at the link.
Invest for Two-Comma Wealth ($1,000,000) is an entry-level yet comprehensive book about investing in the securities markets to grow your net worth. From annuities, bonds, and CDs, to common stocks, meme stocks, and cryptocurrency, the book explains each topic in an easy-to-understand manner.
It teaches you about scams, and how to avoid them, including those “free” lunch seminars that try to sell you something, either immediately or months later. It explains why owning your home may not be a good investment and buying gold coins with huge sales charges put you at a disadvantage.
Follow Susan as she does everything right and Basketcase Bob who serves as an example of what not to do.
If knowledge is the way to wealth, then this book is for you. Use the information in this book to invest for the long term and discover that one day you’ve joined the two-comma club.
Price $20, soft cover, print only, 300+ pages.
-- Thomas Bulkowski, author: Invest for Two-Comma Wealth (#Ad)
![]()
$ $ $
Here's a symbol list of 172 chart and candlestick patterns (13 "investment grade" candle patterns) found in today's securities using my version of Patternz: DDD, ACN, AES, AFL, ALRM, AEO, AEP, AFG, APA, AAPL, ADM, AIZ, AGO, ATO, AVA, AZTA, BECN, BIG, BKH, BFH, BBW, BG, CBT, CNP, CRL, CHKP, CVX, CINF, CLNE, CLX, CNO, CNX, CMCO, ED, CONN, COTY, CCRN, CW, DHR, DDS, DFS, DTE, EBAY, ECL, EFX, EL, EVRG, EZPW, FAST, FDX, FE, FLS, FWRD, GE, GPN, GL, GS, GGG, GES, HE, HELE, HP, HSIC, HD, HWM, HUBG, HUM, IDA, INFN, IIIN, INTU, IRM, JAZZ, K, KELYA, KEYS, KFRC, KSS, LZB, LH, LEG, LNC, LMT, L, LXU, MAN, MA, MTRX, MDC, MDT, MRK, MGEE, MCO, MLI, NJR, NTNX, OGE, OLN, OTEX, PANW, PKE, PATK, PTEN, PETS, PFE, PNW, POR, PPL, PFG, PGR, RGS, RHI, ROK, RCKY, SAIA, SAIC, SMG, SEIC, SIGI, SRE, SHOP, SLGN, LUV, SWX, SPSC, TPR, TPX, RIG, TZOO, TWLO, UIS, UNM, VFC, MDRX, WRB, WSO, WERN, WSM, WSC, WOLF, WDAY, IHE, IDU, DDM, FDN, ICF, IHF, IAT, ILF, IYF, EWA, EWZ, EWH, EIS, EWM, EWW, EPP, XLV, VHT, VAW. Click this link for details (pattern type, start and end dates).
For a list of small patterns (those a few days wide) click this link.
$ $ $
You can find setups based on a Fibonacci retrace by clicking on the link.
The following patterns were found manually, not using Patternz. Mr. Bulkowski has excluded any securities he owns from appearing in the list. However, he may add any of the securities listed to his portfolio at any time, just as you can.
In the table below, the red and green colors are based on the historical breakout direction for the associated chart pattern. If a high and tight flag appears, the start and end dates highlight the flagpole only and not the flag.
For details about the chart patterns, click here.
-- Thomas Bulkowski, author: Invest for Two-Comma Wealth (Ad)
![]()
| Symbol | Chart Pattern | Bullish Bearish | Start | End | Industry |
| ANF | Horn top | 03/04/2024 | 03/18/2024 | Apparel | |
| AA | Flag | 04/04/2024 | 04/11/2024 | Aerospace/Defense | |
| AIZ | Pipe top | 03/25/2024 | 04/01/2024 | Insurance (Diversified) | |
| BMY | Double Top, Eve and Adam | 03/13/2024 | 03/28/2024 | Drug | |
| CF | Double Top, Eve and Adam | 03/20/2024 | 04/04/2024 | Chemical (Basic) | |
| CONN | Triple bottom | 03/15/2024 | 04/11/2024 | Retail (Special Lines) | |
| ^DJT | Head-and-shoulders top | 03/22/2024 | 04/04/2024 | None | |
| BOOM | Triple top | 03/20/2024 | 04/04/2024 | Metal Fabricating | |
| FTV | Triple top | 02/28/2024 | 03/22/2024 | Industrial Services | |
| GPN | Double Top, Adam and Adam | 02/15/2024 | 03/13/2024 | Computer Software and Svcs | |
| GL | Dead-cat bounce | 04/11/2024 | 04/11/2024 | Insurance (Life) | |
| GS | Double Top, Adam and Adam | 03/28/2024 | 04/04/2024 | Securities Brokerage | |
| ITW | Head-and-shoulders top | 03/18/2024 | 03/28/2024 | Metal Fabricating | |
| IIIN | Double Top, Adam and Adam | 03/21/2024 | 04/01/2024 | Building Materials | |
| KSS | Pipe top | 03/25/2024 | 04/01/2024 | Retail Store | |
| MHO | Pipe top | 03/25/2024 | 04/01/2024 | Homebuilding | |
| MAS | Triple top | 03/21/2024 | 04/04/2024 | Building Materials | |
| MDT | Pipe top | 03/25/2024 | 04/01/2024 | Medical Supplies | |
| NBR | Triple top | 03/15/2024 | 04/03/2024 | Oilfield Svcs/Equipment | |
| NUS | Broadening top, right-angled and ascending | 02/29/2024 | 04/09/2024 | Toiletries/Cosmetics | |
| PATK | Pipe top | 02/26/2024 | 03/04/2024 | Retail Building Supply | |
| KWR | Double Top, Adam and Eve | 03/21/2024 | 03/28/2024 | Chemical (Specialty) | |
| RLI | Triple top | 02/28/2024 | 03/28/2024 | Insurance (Prop/Casualty) | |
| RCKY | Broadening bottom | 03/01/2024 | 03/28/2024 | Shoe | |
| SEE | Horn top | 02/26/2024 | 03/11/2024 | Packaging and Container | |
| SKX | Double Top, Eve and Adam | 03/01/2024 | 03/14/2024 | Shoe | |
| SR | Double Top, Eve and Eve | 03/05/2024 | 03/28/2024 | Natural Gas (Distributor) | |
| TXN | Triangle, symmetrical | 03/07/2024 | 04/11/2024 | Semiconductor | |
| TG | Pennant | 04/01/2024 | 04/11/2024 | Chemical (Specialty) | |
| WOLF | Pipe bottom | 02/20/2024 | 02/26/2024 | Semiconductor | |
| IGV | Triangle, descending | 03/15/2024 | 04/11/2024 | Computer Software and Svcs |
![]()
Since I post this the night before, check how the futures are trading before market open. Large moves can affect the opening direction.
$ $ $
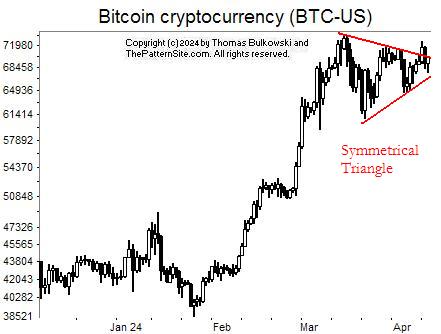
I show a picture of bitcoin on the daily scale.
The cryptocurrency has made a strong push higher since the January low but is it running out of steam?
I don't think so. It's paused here and formed a chart pattern called a symmetrical triangle. I show that in red on the chart.
In stocks, symmetricals breakout upward 60% of the time. We see that here, when the currency closed above the top red line. Unfortunately, the breakout didn't hold and the currency returned to do more work in the triangle.
Given the strong push upward since January, I think we'll see the uptrend continue. That's just a guess. Symmetricals can be treacherous.
$ $ $
Here's a symbol list of 173 chart and candlestick patterns (13 "investment grade" candle patterns) found in today's securities using my version of Patternz: DDD, ANF, ABM, ACN, AEIS, AES, AFL, APD, AKAM, ALRM, AEO, AFG, AMGN, APOG, AIZ, ADSK, AXS, AZTA, BSET, BZH, BMY, BLDR, CAL, CENX, CF, CIEN, CNO, CMCO, GLW, CSGP, CCRN, CSGS, DECK, DDS, DFS, DTE, BOOM, ECL, EL, EXPI, EZPW, FDS, FICO, FARO, FDX, GFS, GS, GPRO, GES, HBI, HLIT, HSII, HELE, HSIC, HNI, DHI, HWM, HUN, INFN, IIIN, IPAR, TILE, IPI, IRM, JKHY, KBH, KFRC, KSS, LZB, LH, LAMR, LANC, LEN, LLY, LNC, MHO, MANH, MRO, MRTN, MLM, MTRN, MDT, MRK, NWL, NWPX, NOVT, NUS, ASGN, OTEX, PATK, PETS, PFG, PG, PHM, KWR, RMBS, RJF, REGN, ROG, ROP, R, SAIC, SCI, NOW, SHOP, SKX, LUV, SNPS, TPR, TDY, TPX, TDC, TOL, RIG, TZOO, TREX, SLCA, UPS, UNM, VFC, VMI, MDRX, WEX, WSC, WWW, WDAY, IYC, IYE, IHE, DDM, FTEC, IYH, IEV, IGV, IXC, ITB, EWO, EWQ, EIS, EWI, EWY, EWL, PXJ, PJP, PHO, ROBO, XLV, XHB, XRT, XAR, XLK, VHT. Click this link for details (pattern type, start and end dates).
For a list of small patterns (those a few days wide) click this link.
$ $ $
The following table shows where Fibonacci retrace values of the day's high-low range are plus pivot points, calculated on the Nasdaq composite, sorted by value. When several are near each other (small differences), the area might act as support or resistance.
-- Thomas Bulkowski, author: Invest for Two-Comma Wealth (Ad)
![]()
| © 2024 ThePatternSite.com Metric | Value | Diff | Close (within 10% of the high-low range for the day)? |
| Monthly S2 | 15,514.39 | ||
| Weekly S2 | 15,791.77 | 277.38 | |
| Monthly S1 | 15,842.37 | 50.61 | |
| Weekly S1 | 15,981.06 | 138.69 | |
| Daily S2 | 16,046.14 | 65.08 | |
| Low | 16,092.02 | 45.88 | |
| Open | 16,104.01 | 11.99 | |
| Daily S1 | 16,108.25 | 4.24 | Yes! The Daily S1 is close to the Open. |
| 61.8% Down from Intraday High | 16,133.27 | 25.02 | |
| 50% Down from Intraday High | 16,146.01 | 12.74 | |
| Daily Pivot | 16,154.13 | 8.12 | Yes! The Daily Pivot is close to the 50% Down from Intraday High. |
| 38.2% Down from Intraday High | 16,158.76 | 4.63 | Yes! The 38.2% Down from Intraday High is close to the Daily Pivot. |
| Close | 16,170.36 | 11.60 | |
| Monthly Pivot | 16,190.62 | 20.26 | |
| High | 16,200.01 | 9.39 | Yes! The High is close to the Monthly Pivot. |
| Daily R1 | 16,216.24 | 16.23 | |
| Weekly Pivot | 16,235.86 | 19.62 | |
| Daily R2 | 16,262.12 | 26.26 | |
| Weekly R1 | 16,425.15 | 163.03 | |
| Monthly R1 | 16,518.60 | 93.45 | |
| Weekly R2 | 16,679.95 | 161.34 | |
| Monthly R2 | 16,866.85 | 186.90 |
This is a picture of the chart pattern indicator on the daily scale. The indicator is the line chart below a chart of the S&P 500 composite.
The CPI has turned neutral after being bearish, as the chart shows.
The switch from bearish to neutral could be a signal that the big retrace I've been expecting isn't happening yet.
I'm looking for the uptrend to flip the neutral bars to bullish.
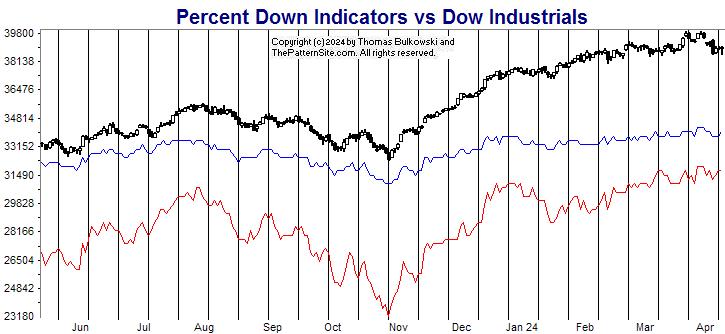
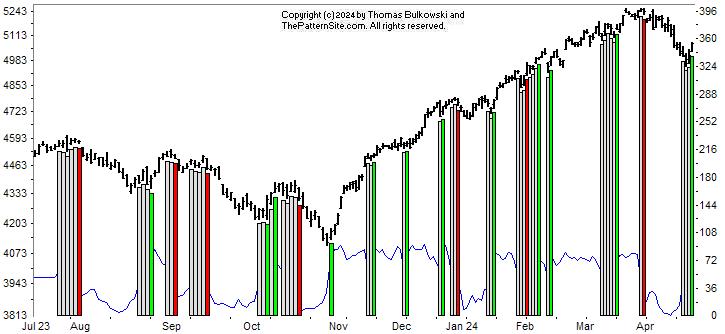
The red line is the percentage of stocks at least 20% below their 1-year high (plotted upside down). The blue line is the average percentage drop of stocks below their 1-year high (plotted upside down).
On Tuesday, 22% of stocks in my database are in bear market territory (down at least 20% from their 1-year high).A week ago, it was 23%.The fewest was 21% on 03/28/2024.And the most was 56% on 10/27/2023.
The 514 stocks in my database are down an average of 13% from their yearly high.A week ago, the average was 13%.The peak was 11% on 03/28/2024.And the bottom was 25% on 10/27/2023.
I've decided not to include this portion of the post in the future. Why? Because the indicators on this chart just followed what the index is doing. They don't add value. If you disagree, then write me and convince me and I'll consider giving it a stay of execution.
$ $ $
Here's a symbol list of 126 chart and candlestick patterns (13 "investment grade" candle patterns) found in today's securities using my version of Patternz: ANF, AES, AFL, AEO, AFG, ANIK, APOG, ANET, ASH, AIZ, BIG, BKNG, BCO, BLDR, CBT, CACI, CX, CENX, CF, CHKP, CHD, CIEN, CINF, CNO, CL, CMCO, CONN, GLW, CROX, DECK, DDS, DUK, EXC, EZPW, FICO, FDX, FE, FISV, FCX, FRD, IT, GNW, HLIT, HQY, HTLD, HSII, HELE, HSIC, HOV, HUN, ITGR, KEYS, KFRC, KMB, KSS, LDOS, LLY, LNC, LMT, LPLA, MANH, MAN, MRO, MLM, MTDR, MDT, MRK, MLKN, NFLX, NTGR, NTAP, OMCL, ORCL, PAYX, PCTY, PETS, PFG, RMBS, RJF, RGA, RNG, SIGI, NOW, SLGN, SCCO, SNPS, TPR, TRGP, TEVA, TMO, RIG, TZOO, TG, TREX, UNM, VECO, WSC, ZBRA, IHE, DDM, ICF, ILF, IEO, IYF, EWI, EPP, EWS, EZA, EWY, EWP, EWT, THD, PXJ, XLF, XLU. Click this link for details (pattern type, start and end dates).
For a list of small patterns (those a few days wide) click this link.
-- Thomas Bulkowski, author: Invest for Two-Comma Wealth (Ad)
![]()
$ $ $
I show another slider trading quiz featuring descending broadening wedges.
$ $ $
Here's a symbol list of 112 chart and candlestick patterns (13 "investment grade" candle patterns) found in today's securities using my version of Patternz: ANF, A, AKAM, ALB, AEO, AEL, AXP, AIG, ASH, AZTA, BLDR, CACI, CENX, CDAY, CVX, CHD, CIEN, CLX, GLW, CSGS, DDS, EVRG, EXC, EZPW, FDX, FLEX, FWRD, FDP, FRD, GNW, GFF, THG, HL, HP, HUBG, HUN, IDXX, INTC, IPI, KELYA, KMT, LHX, LDOS, RAMP, LMT, L, MGY, MANH, MAN, MRO, MTDR, MTRN, MTRX, MGEE, NFG, NTGR, NEU, OLN, OTEX, ORCL, PTEN, PNW, PXD, QCOM, DGX, RL, RTX, RGS, ROST, SAND, SLB, STR, SKYW, LUV, SR, SCS, TDY, TFX, TEVA, TXT, TKR, RIG, TZOO, TG, VMI, VRTX, VC, WPM, WSC, ZBRA, IAI, FXI, IEV, MXI, ILF, IEO, EWO, EWK, EWZ, EEM, EWQ, EWG, EWI, EWS, EWD, EWT, PXJ. Click this link for details (pattern type, start and end dates).
For a list of small patterns (those a few days wide) click this link.
$ $ $
The following table shows where Fibonacci retrace values of the day's high-low range are plus pivot points, calculated on the Dow industrials, sorted by value. When several are near each other (small differences), the area might act as support or resistance.
-- Thomas Bulkowski, author: Invest for Two-Comma Wealth (Ad)
![]()
| © 2024 ThePatternSite.com Metric | Value | Diff | Close (within 10% of the high-low range for the day)? |
| Monthly S2 | 37,648.67 | ||
| Weekly S2 | 37,833.49 | 184.82 | |
| Monthly S1 | 38,270.74 | 437.25 | |
| Weekly S1 | 38,363.15 | 92.41 | |
| Daily S2 | 38,765.73 | 402.59 | |
| Daily S1 | 38,829.27 | 63.53 | |
| Low | 38,857.70 | 28.43 | |
| Close | 38,892.80 | 35.10 | |
| Open | 38,916.40 | 23.60 | |
| 61.8% Down from Intraday High | 38,917.10 | 0.70 | Yes! The 61.8% Down from Intraday High is close to the Open. |
| Daily Pivot | 38,921.23 | 4.13 | Yes! The Daily Pivot is close to the 61.8% Down from Intraday High. |
| 50% Down from Intraday High | 38,935.45 | 14.21 | Yes! The 50% Down from Intraday High is close to the Daily Pivot. |
| 38.2% Down from Intraday High | 38,953.80 | 18.35 | |
| Daily R1 | 38,984.77 | 30.96 | |
| High | 39,013.20 | 28.43 | |
| Daily R2 | 39,076.73 | 63.54 | |
| Monthly Pivot | 39,079.89 | 3.16 | Yes! The Monthly Pivot is close to the Daily R2. |
| Weekly Pivot | 39,089.07 | 9.18 | Yes! The Weekly Pivot is close to the Monthly Pivot. |
| Weekly R1 | 39,618.73 | 529.65 | |
| Monthly R1 | 39,701.96 | 83.23 | |
| Weekly R2 | 40,344.65 | 642.70 | |
| Monthly R2 | 40,511.11 | 166.46 |
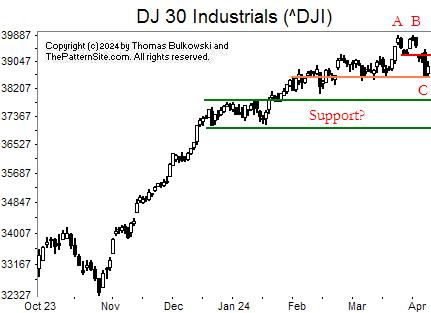
Not a lot is happening today in the Dow industrials, which I show on the daily scale.
A double top appears at AB, confirmed as a valid chart when the index closes below the lowest valley between the two peaks.
That happens, I think, on the bar before C.
The index has dropped to the brown line, a line of support. I drew that from today (Friday) to the left, so see how it lines up with prior price action.
Below that is a more substantial support, shown by the green lines (and cleverly labeled 'Support?'), setup by a sideways move in the index during December 2023/January 2024.
If we have a serious retrace, I would expect the index to touch the green area and rebound upward.
![]()
The following is a brief review of how the markets performed over time. The numbers refer to the close-to-close move in the Dow industrials.
No options expire this week.
![]()
The following is based on an SFO article in December 2004 by John Seekinger, titled, "Take a two-dimensional approach." He offers these tips.
| Index | S2 | S1 | Pivot | R1 | R2 |
| Dow Industrials (^DJI): Daily | 38,411 | 38,657 | 38,849 | 39,095 | 39,287 |
| Weekly | 37,837 | 38,371 | 39,093 | 39,626 | 40,348 |
| Monthly | 37,652 | 38,278 | 39,084 | 39,709 | 40,515 |
| S&P500 (^GSPC): Daily | 5,130 | 5,167 | 5,195 | 5,232 | 5,260 |
| Weekly | 5,087 | 5,146 | 5,205 | 5,264 | 5,323 |
| Monthly | 4,967 | 5,086 | 5,175 | 5,294 | 5,383 |
| Nasdaq (^IXIC): Daily | 15,972 | 16,111 | 16,219 | 16,357 | 16,465 |
| Weekly | 15,818 | 16,033 | 16,262 | 16,477 | 16,706 |
| Monthly | 15,540 | 15,894 | 16,217 | 16,571 | 16,893 |
Here are the formulas:
![]()
Earnings season will be starting in about 8 days.
Here's a symbol list of 108 chart and candlestick patterns (13 "investment grade" candle patterns) found in today's securities using my version of Patternz: DDD, AEIS, A, AKAM, ALK, AMZN, ARCB, ADM, AZTA, BMI, BALL, BAX, BECN, BZH, BIIB, BOOT, BFH, BMY, CACI, CALM, CX, CDAY, CHD, CIEN, CSCO, CLNE, CLX, CXW, CSGS, EIX, EQT, FDX, FNV, GD, GPN, GFS, GPRO, HL, HP, HUBG, HUM, HUN, ILMN, INTC, IPI, KALU, LLY, LPLA, LXU, MANH, MCHX, MOS, NFG, NTGR, PTEN, PETS, PFE, PINC, PFG, PG, PRU, DGX, RTX, RGS, RCKY, ROST, SCI, NOW, LUV, SWX, SWN, SPSC, SCS, TPR, TPX, RIG, TZOO, UHAL, UGI, VECO, VRTX, VC, WLK, WOLF, WWD, WDAY, XEL, IYK, IHE, BOTZ, SLV, EWG, THD, TUR, ROBO, XLV. Click this link for details (pattern type, start and end dates).
For a list of small patterns (those a few days wide) click this link.
The below industries were the best (rank 1) or worst performing of those I follow.
|
-- Thomas Bulkowski, author: Invest for Two-Comma Wealth (Ad)
![]()
$ $ $
Here's a symbol list of 268 chart and candlestick patterns (13 "investment grade" candle patterns) found in today's securities using my version of Patternz: DDD, AXDX, ADTN, AMD, AES, AFL, ATSG, AKAM, ALB, ALL, AEO, AXP, AME, AMAT, ANET, ARW, ASH, AVY, AZTA, BMI, BCPC, BSET, BAX, BZH, BIG, BKNG, BOOT, BAH, BRC, BCO, BMY, BRKR, CBT, CX, COR, CNC, CENX, CHKP, CHD, CIEN, CINF, CTAS, CNA, CNO, CGNX, CMCO, CAG, CONN, GLW, CSGP, CTS, ^DJT, DTE, BOOM, EXP, EMN, EBAY, ELV, EME, EMR, EFX, EQT, EL, XOM, FFIV, FICO, FARO, FAST, FDX, FIVN, FTV, FNV, IT, GPN, GFS, GS, GPRO, GGG, HBI, THG, HIG, HL, HOV, JBHT, HUN, IEX, IDXX, ITW, ILMN, NSP, PODD, INTC, JKHY, KBH, KELYA, KMT, KEYS, KLAC, KLIC, LH, LRCX, LDOS, LNC, L, LXU, MTSI, MCHX, MAS, MTRX, META, MSFT, MS, NBR, ^IXIC, NFG, NOV, NEE, NWPX, NVDA, OLN, ASGN, ON, OTEX, ORCL, OR, OMI, PDCO, PCTY, PEN, PFE, PPG, PFG, PG, PGR, PRU, PEG, KWR, QCOM, DGX, RJF, RGA, RNG, ROK, ROL, ROP, RES, R, ^GSPC, SAIA, CRM, SAND, SEIC, SRE, SHW, SHOP, SO, SWX, SWN, SR, SXI, SCS, SSYS, TPR, TDY, TXN, TTD, TMO, TKR, TOL, TDG, RIG, TZOO, UHAL, UPS, UNM, VEEV, VRTX, VC, VMC, WAT, WSO, WEX, XEL, IYM, IAI, IYK, IYC, IHE, DDM, FTEC, FDN, QTEC, FXL, FXI, BOTZ, QQQ, ICF, IHF, IYZ, IEV, IGV, MXI, IXN, ILF, SOXX, IYF, IHI, EWA, EWK, EWQ, EWG, EWH, EWI, EWJ, EWS, EWT, TUR, QLD, IBB, PBE, PEJ, PXJ, PHO, SSO, ROBO, XLY, XLV, XHB, XLI, XLB, SPY, XLK, USO, SMH, VIS, VAW, MGK, VONG. Click this link for details (pattern type, start and end dates).
For a list of small patterns (those a few days wide) click this link.
$ $ $
You can find setups based on a Fibonacci retrace by clicking on the link.
The following patterns were found manually, not using Patternz. Mr. Bulkowski has excluded any securities he owns from appearing in the list. However, he may add any of the securities listed to his portfolio at any time, just as you can.
In the table below, the red and green colors are based on the historical breakout direction for the associated chart pattern. If a high and tight flag appears, the start and end dates highlight the flagpole only and not the flag.
For details about the chart patterns, click here.
-- Thomas Bulkowski, author: Invest for Two-Comma Wealth (Ad)
![]()
| Symbol | Chart Pattern | Bullish Bearish | Start | End | Industry |
| AES | Pipe bottom | 03/11/2024 | 03/18/2024 | Electric Utility (East) | |
| A | Double Top, Eve and Eve | 03/08/2024 | 03/21/2024 | Precision Instrument | |
| ALRM | Three Falling Peaks | 02/29/2024 | 03/21/2024 | Computer Software and Svcs | |
| ALB | Ugly double bottom | 03/05/2024 | 03/15/2024 | Chemical (Diversified) | |
| ALGT | Pipe bottom | 03/11/2024 | 03/18/2024 | Air Transport | |
| AR | Pipe bottom | 03/11/2024 | 03/18/2024 | Natural Gas (Diversified) | |
| ARCB | Pipe bottom | 03/11/2024 | 03/18/2024 | Trucking/Transp. Leasing | |
| ARW | Ugly double bottom | 02/13/2024 | 03/19/2024 | Electronics | |
| ASH | Broadening top, right-angled and ascending | 03/07/2024 | 04/04/2024 | Chemical (Basic) | |
| ADSK | Diamond top | 02/09/2024 | 03/21/2024 | Computer Software and Svcs | |
| ADP | Double Top, Adam and Adam | 03/22/2024 | 03/28/2024 | IT Services | |
| BBW | Double Top, Adam and Eve | 03/15/2024 | 04/01/2024 | Retail (Special Lines) | |
| CLS | Double Bottom, Adam and Adam | 03/11/2024 | 03/19/2024 | Electronics | |
| CRL | Double Top, Adam and Eve | 03/08/2024 | 03/22/2024 | Biotechnology | |
| CSCO | Triple top | 03/12/2024 | 04/01/2024 | Computers and Peripherals | |
| CNA | Triangle, ascending | 02/28/2024 | 03/22/2024 | Insurance (Prop/Casualty) | |
| DECK | Triple top | 03/14/2024 | 04/01/2024 | Shoe | |
| ^DJI | Double Top, Adam and Eve | 03/21/2024 | 03/28/2024 | None | |
| DOV | Head-and-shoulders top | 03/13/2024 | 03/28/2024 | Machinery | |
| EQT | Pipe bottom | 03/11/2024 | 03/18/2024 | Natural Gas (Diversified) | |
| EXPD | Double Top, Eve and Eve | 03/07/2024 | 03/22/2024 | Air Transport | |
| FDX | Cup with handle | 12/18/2023 | 03/22/2024 | Air Transport | |
| GME | Double Top, Eve and Adam | 03/06/2024 | 03/26/2024 | Retail (Special Lines) | |
| GILD | Double Bottom, Adam and Eve | 02/16/2024 | 02/29/2024 | Biotechnology | |
| GGG | Double Top, Adam and Eve | 03/14/2024 | 03/21/2024 | Machinery | |
| HBI | Broadening top | 03/08/2024 | 04/04/2024 | Apparel | |
| HQY | Triple top | 02/27/2024 | 04/02/2024 | Healthcare Information | |
| HSY | Diamond top | 03/11/2024 | 04/03/2024 | Food Processing | |
| PODD | Triangle, symmetrical | 02/22/2024 | 04/04/2024 | Medical Supplies | |
| INTC | Head-and-shoulders complex top | 02/15/2024 | 04/01/2024 | Semiconductor | |
| IBKR | Scallop, ascending | 03/04/2024 | 04/03/2024 | Securities Brokerage | |
| IPG | Falling wedge | 03/18/2024 | 04/04/2024 | Advertising | |
| IPI | Double Bottom, Adam and Eve | 03/14/2024 | 03/22/2024 | Chemical (Diversified) | |
| IRM | Triangle, symmetrical | 03/08/2024 | 04/04/2024 | Industrial Services | |
| JBLU | Triangle, ascending | 02/14/2024 | 04/04/2024 | Air Transport | |
| KSS | Pipe bottom | 03/11/2024 | 03/18/2024 | Retail Store | |
| MLM | Rectangle top | 03/04/2024 | 04/04/2024 | Cement and Aggregates | |
| MTRN | Double Top, Adam and Adam | 03/21/2024 | 03/27/2024 | Metals and Mining (Div.) | |
| MDT | Triple bottom | 03/01/2024 | 03/25/2024 | Medical Supplies | |
| MLKN | Dead-cat bounce | 03/28/2024 | 03/28/2024 | Furn/Home Furnishings | |
| MS | Cup with handle | 01/02/2024 | 04/04/2024 | Securities Brokerage | |
| MYGN | Triple top | 02/15/2024 | 03/06/2024 | Biotechnology | |
| NFG | Head-and-shoulders bottom | 01/24/2024 | 02/14/2024 | Natural Gas (Diversified) | |
| OGE | Triangle, ascending | 02/21/2024 | 03/26/2024 | Electric Utility (Central) | |
| OMCL | Head-and-shoulders complex bottom | 02/09/2024 | 03/20/2024 | Healthcare Information | |
| PDCO | Double Top, Adam and Adam | 03/12/2024 | 03/28/2024 | Medical Supplies | |
| PEN | Head-and-shoulders top | 01/16/2024 | 03/06/2024 | Medical Supplies | |
| PLXS | Double Bottom, Eve and Eve | 03/18/2024 | 03/26/2024 | Electronics | |
| PINC | Triple bottom | 02/08/2024 | 03/15/2024 | Healthcare Information | |
| PG | Double Top, Eve and Adam | 03/13/2024 | 03/28/2024 | Household Products | |
| DGX | Triple bottom | 02/01/2024 | 03/01/2024 | Medical Services | |
| RL | Double Top, Adam and Adam | 02/23/2024 | 03/21/2024 | Apparel | |
| RRC | Ugly double bottom | 02/07/2024 | 03/14/2024 | Petroleum (Producing) | |
| RNG | Double Top, Eve and Adam | 03/12/2024 | 03/21/2024 | Computer Software and Svcs | |
| ROK | Double Top, Adam and Eve | 03/21/2024 | 03/28/2024 | Diversified Co. | |
| ROST | Head-and-shoulders bottom | 05/11/2023 | 06/01/2023 | Retail (Special Lines) | |
| RGLD | Ugly double bottom | 02/28/2024 | 03/20/2024 | Metals and Mining (Div.) | |
| RES | Pipe bottom | 01/16/2024 | 01/22/2024 | Oilfield Svcs/Equipment | |
| R | Pipe bottom | 02/12/2024 | 02/20/2024 | Trucking/Transp. Leasing | |
| ^GSPC | Double Top, Adam and Eve | 03/21/2024 | 03/28/2024 | None | |
| SBH | Big M | 01/02/2024 | 02/15/2024 | Toiletries/Cosmetics | |
| SCHW | Cup with handle | 12/15/2023 | 04/04/2024 | Securities Brokerage | |
| SEE | Three Falling Peaks | 02/27/2024 | 03/28/2024 | Packaging and Container | |
| NOW | Triangle, symmetrical | 03/05/2024 | 04/04/2024 | IT Services | |
| SHW | Triple top | 03/08/2024 | 03/28/2024 | Chemical (Basic) | |
| SO | Double Bottom, Eve and Eve | 02/16/2024 | 03/01/2024 | Electric Utility (East) | |
| SXI | Double Top, Eve and Eve | 03/25/2024 | 04/01/2024 | Diversified Co. | |
| SUM | Pipe bottom | 03/11/2024 | 03/18/2024 | Cement and Aggregates | |
| TPR | Broadening wedge, descending | 02/23/2024 | 04/01/2024 | Apparel | |
| TDOC | Triangle, symmetrical | 03/05/2024 | 03/28/2024 | Healthcare Information | |
| TTD | Pipe bottom | 03/11/2024 | 03/18/2024 | Advertising | |
| UPS | Double Top, Adam and Adam | 03/13/2024 | 03/22/2024 | Air Transport | |
| WMT | Double Top, Eve and Eve | 03/12/2024 | 03/21/2024 | Retail Store | |
| WPM | Ugly double bottom | 02/26/2024 | 03/20/2024 | Metals and Mining (Div.) | |
| XEL | Ugly double bottom | 03/06/2024 | 03/26/2024 | Electric Utility (West) |
![]()
Since I post this the night before, check how the futures are trading before market open. Large moves can affect the opening direction.
$ $ $
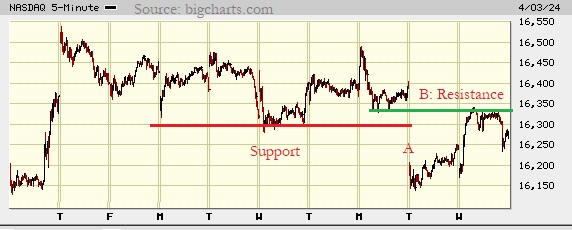
I show a picture of the Nasdaq composite on the 5-minute scale.
The index found support at the red line, mostly during Wednesday's trading activity (that is, a week ago). The index gapped around that support at A, forming a large hole on the chart.
The gap filled quickly (on 4/3) and hit resistance at the green line. From there, it plunged and recovered slightly.
To me, this suggests the index is going to struggle to rise. I'd guess another down day on Thursday before trying to push through resistance going up to 16,500, probably having trouble piercing 16,400.
$ $ $
Here's a symbol list of 170 chart and candlestick patterns (13 "investment grade" candle patterns) found in today's securities using my version of Patternz: ABT, ACIW, AYI, AMD, AKAM, ALK, AA, DOX, AEL, AMWD, APOG, AMAT, AWI, ADSK, AZTA, BCPC, BSET, BZH, BBY, BIG, CDNS, CALM, CAL, CPB, CX, CNP, CNX, COST, COTY, CROX, CSGS, DHR, DECK, DVN, FANG, DDS, DRQ, DTE, BOOM, WIRE, EOG, EL, EG, EVH, EXPD, FFIV, FDS, FDX, FIS, FLEX, FTNT, GPS, GNW, GPN, GFS, GFF, HLIT, HL, HELE, HP, HD, HOV, HUBG, IDA, ILMN, IBP, INTC, ISRG, JNJ, KFRC, LEN, RAMP, LOW, MHO, MTSI, M, MGY, MAN, MLM, MTRN, MRK, MGEE, NWL, NEE, JWN, ORI, PANW, PTEN, PEN, PCG, PPL, PG, PRU, PEG, PSTG, QTWO, RHI, RCKY, ROST, RES, SAND, SMG, SRE, SMTC, SHOP, SKX, SKYW, SO, LUV, SCS, SRDX, SNPS, TRGP, TPX, TER, TOL, TDG, RIG, TZOO, UGI, UNH, VFC, VLO, VECO, V, WERN, WLK, WSM, WOLF, WWW, IYK, IYE, IEZ, BOTZ, IYZ, SLV, IGE, IEO, EWA, EWO, EWZ, ECH, EEM, EWJ, EWW, EWS, EZA, EWD, EWT, PEJ, PXJ, PJP, XRT, UNG, USO, VIS. Click this link for details (pattern type, start and end dates).
For a list of small patterns (those a few days wide) click this link.
$ $ $
The following table shows where Fibonacci retrace values of the day's high-low range are plus pivot points, calculated on the Nasdaq composite, sorted by value. When several are near each other (small differences), the area might act as support or resistance.
-- Thomas Bulkowski, author: Invest for Two-Comma Wealth (Ad)
![]()
| © 2024 ThePatternSite.com Metric | Value | Diff | Close (within 10% of the high-low range for the day)? |
| Monthly S2 | 15,550.09 | ||
| Monthly S1 | 15,913.77 | 363.69 | |
| Daily S2 | 16,091.07 | 177.30 | |
| Weekly S2 | 16,149.13 | 58.05 | |
| Low | 16,169.31 | 20.18 | |
| Open | 16,178.80 | 9.49 | Yes! The Open is close to the Low. |
| Daily S1 | 16,184.27 | 5.47 | Yes! The Daily S1 is close to the Open. |
| Weekly S1 | 16,213.29 | 29.03 | |
| Monthly Pivot | 16,226.32 | 13.02 | Yes! The Monthly Pivot is close to the Weekly S1. |
| 61.8% Down from Intraday High | 16,234.80 | 8.48 | Yes! The 61.8% Down from Intraday High is close to the Monthly Pivot. |
| 50% Down from Intraday High | 16,255.03 | 20.23 | |
| Daily Pivot | 16,262.50 | 7.48 | Yes! The Daily Pivot is close to the 50% Down from Intraday High. |
| 38.2% Down from Intraday High | 16,275.25 | 12.75 | Yes! The 38.2% Down from Intraday High is close to the Daily Pivot. |
| Close | 16,277.46 | 2.21 | Yes! The Close is close to the 38.2% Down from Intraday High. |
| High | 16,340.74 | 63.28 | |
| Weekly Pivot | 16,343.34 | 2.60 | Yes! The Weekly Pivot is close to the High. |
| Daily R1 | 16,355.70 | 12.36 | Yes! The Daily R1 is close to the Weekly Pivot. |
| Weekly R1 | 16,407.50 | 51.81 | |
| Daily R2 | 16,433.93 | 26.43 | |
| Weekly R2 | 16,537.55 | 103.61 | |
| Monthly R1 | 16,590.00 | 52.46 | |
| Monthly R2 | 16,902.55 | 312.54 |
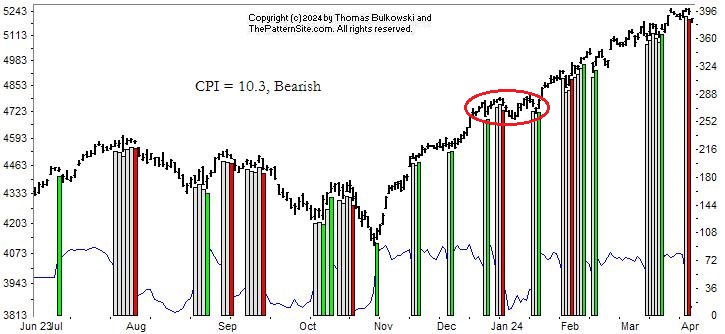
This is a picture of the chart pattern indicator on the daily scale. The indicator is the line chart below a chart of the S&P 500 composite.
The CPI is 10.3, which is bearish, hence the vertical red line on the far right of the chart.
As you can see, the index has been climbing since the November low without a significant retrace (like 30%). It did move sideways in late December to January (circled), so my guess is that's where the retrace will rebound (find support).
However, we first have to see the index make a meaningful drop. This could be the start of the retrace but I've been fooled before, so we'll have to wait and see.
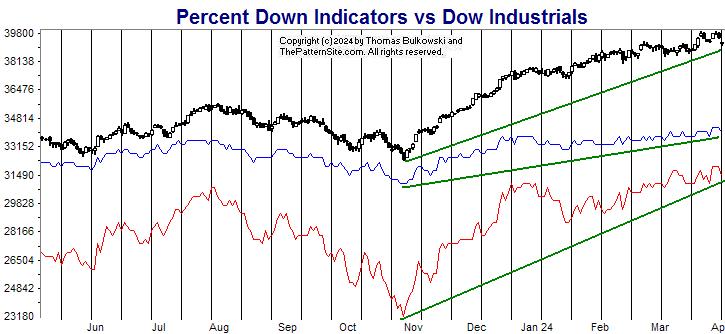
The red line is the percentage of stocks at least 20% below their 1-year high (plotted upside down). The blue line is the average percentage drop of stocks below their 1-year high (plotted upside down).
On Tuesday, 23% of stocks in my database are in bear market territory (down at least 20% from their 1-year high).A week ago, it was 23%.The fewest was 21% on 03/28/2024.And the most was 56% on 10/27/2023.
The 514 stocks in my database are down an average of 13% from their yearly high.A week ago, the average was 13%.The peak was 11% on 03/28/2024.And the bottom was 25% on 10/27/2023.
I show green lines to illustrate the trend from November as I mentioned in the discussion of the prior chart.
According to this chart, there's nothing to worry about. The trend is still upward even if today (Tuesday) was a down day.
The prior chart is bearish and this is bullish. Go figure. Because signals on the CPI chart can change for up to a week, let's pretend the trend remains up for another week and then reevaluate.
$ $ $
Here's a symbol list of 178 chart and candlestick patterns (13 "investment grade" candle patterns) found in today's securities using my version of Patternz: ABT, ACIW, AYI, A, ALRM, AA, AEL, AIG, AMWD, AMGN, ANIK, AR, AON, AAPL, AGO, ATO, ADSK, AVNT, BMI, BCPC, BSET, BFH, BBW, CDNS, CPB, CENX, CDAY, CRL, CIEN, CLNE, CNX, CMCO, CONN, COST, COTY, CRH, DHR, DECK, XRAY, EFX, EL, EG, EVH, XOM, EZPW, FDS, FICO, FDX, FE, FLEX, FNV, GE, GPN, GGG, GFF, HL, HSII, HELE, HP, HOV, HURC, IIIN, IPAR, IPG, ISRG, JBLU, KALU, KMT, KFRC, LZB, LAMR, LEG, M, MANH, MAN, MCHX, MLM, MTDR, MRCY, MS, MLI, NJR, NWL, NEE, NI, NOVT, NTNX, OMCL, ON, OTEX, PANW, PDCO, PYPL, PEN, PETS, PPL, PINC, PG, RNG, RHI, RCKY, ROP, CRM, SAND, SEE, SCI, STR, SKX, SWX, SCS, SSYS, SUM, SRDX, TECH, TDOC, TDY, TPX, TXT, TMO, TZOO, TG, TREX, VEEV, VRTX, WDAY, XEL, ITB, IHE, FTEC, BOTZ, ICF, IHF, IEV, IGV, IXC, IXN, SLV, IYF, IHI, EWK, EIS, EWJ, EWW, EWS, EWP, EWT, TUR, EWU, PBE, PHO, ROBO, XLF, XLV, XHB, XLK, SMH, VAW, MGK, VONG. Click this link for details (pattern type, start and end dates).
For a list of small patterns (those a few days wide) click this link.
-- Thomas Bulkowski, author: Invest for Two-Comma Wealth (Ad)
![]()
$ $ $
I show another slider trading quiz featuring bump-and-run reversal top.
$ $ $
Here's a symbol list of 225 chart and candlestick patterns (13 "investment grade" candle patterns) found in today's securities using my version of Patternz: ABT, ANF, AXDX, ACIW, AYI, AMD, AES, ATSG, ALGT, AEO, AEP, AEL, AMWD, AR, ATR, ARCB, AWI, AGO, ATO, ADSK, ADP, AVNT, BMI, BCPC, BIG, BIO, BKH, BA, BOOT, BRC, BBW, BG, CALM, CAL, CPB, CLS, CRL, CHD, CI, CINF, CLNE, CNA, CNX, CMCO, CONN, CSGP, CRH, CCRN, DHR, DECK, XRAY, DVN, DDS, DSGR, ^DJT, ^DJI, DTE, EME, EFX, EQT, EL, EVRG, EVH, EXC, EXPD, XOM, EZPW, FICO, FARO, FDX, FE, FLEX, FLS, FMC, FTV, FNV, FCX, FDP, GD, GNW, GFF, THG, HLIT, HTLD, HL, HSII, HOV, HUBG, HUM, ILMN, INCY, NSP, IIIN, IPAR, IBKR, JKHY, JBLU, KELYA, KMT, KFRC, KSS, LZB, LAMR, LEG, MANH, MAN, MRO, MKTX, MRTN, MLM, MDC, MSFT, MS, MLI, MUR, NWL, NEE, NI, OMCL, ASGN, PANW, PKE, PAYX, PCTY, PYPL, PEN, PETS, PXD, PINC, PSTG, QTWO, RTX, RGS, RGA, ROP, ^GSPC, SAND, SMG, SEE, SEIC, SRE, SLGN, SMAR, SXI, SUM, SRDX, TGT, TECH, TDY, TPX, TDC, TTD, TDG, RIG, TZOO, TREX, TWLO, V, WSC, WOLF, WWW, IYK, IYC, ITB, FXI, BOTZ, ICF, IYH, IHF, IAT, IEV, ILF, IYF, IHI, EIS, EWW, EPP, EWD, EWT, TUR, EWU, PPA, PHO, ROBO, XLF, GLD, XHB, XLB, XAR, VAW. Click this link for details (pattern type, start and end dates).
For a list of small patterns (those a few days wide) click this link.
$ $ $
The following table shows where Fibonacci retrace values of the day's high-low range are plus pivot points, calculated on the Dow industrials, sorted by value. When several are near each other (small differences), the area might act as support or resistance.
-- Thomas Bulkowski, author: Invest for Two-Comma Wealth (Ad)
![]()
| © 2024 ThePatternSite.com Metric | Value | Diff | Close (within 10% of the high-low range for the day)? |
| Monthly S2 | 37,873.36 | ||
| Monthly S1 | 38,720.10 | 846.75 | |
| Weekly S2 | 38,979.48 | 259.38 | |
| Weekly S1 | 39,273.16 | 293.69 | |
| Daily S2 | 39,300.58 | 27.41 | Yes! The Daily S2 is close to the Weekly S1. |
| Monthly Pivot | 39,304.58 | 4.00 | Yes! The Monthly Pivot is close to the Daily S2. |
| Daily S1 | 39,433.71 | 129.14 | |
| Low | 39,491.22 | 57.50 | |
| Close | 39,566.85 | 75.63 | |
| Weekly Pivot | 39,570.88 | 4.02 | Yes! The Weekly Pivot is close to the Close. |
| 61.8% Down from Intraday High | 39,614.90 | 44.03 | |
| Daily Pivot | 39,624.36 | 9.45 | Yes! The Daily Pivot is close to the 61.8% Down from Intraday High. |
| 50% Down from Intraday High | 39,653.11 | 28.75 | Yes! The 50% Down from Intraday High is close to the Daily Pivot. |
| 38.2% Down from Intraday High | 39,691.32 | 38.21 | |
| Daily R1 | 39,757.49 | 66.18 | |
| Open | 39,807.93 | 50.44 | |
| High | 39,815.00 | 7.07 | Yes! The High is close to the Open. |
| Weekly R1 | 39,864.56 | 49.56 | |
| Daily R2 | 39,948.14 | 83.57 | |
| Monthly R1 | 40,151.32 | 203.19 | |
| Weekly R2 | 40,162.28 | 10.95 | Yes! The Weekly R2 is close to the Monthly R1. |
| Monthly R2 | 40,735.80 | 573.52 |
Here's the updated 2024 market forecast, presented in slider format.
![]()
The following is a brief review of how the markets performed over time. The numbers refer to the close-to-close move in the Dow industrials.
No options expire this week.
![]()
The following is based on an SFO article in December 2004 by John Seekinger, titled, "Take a two-dimensional approach." He offers these tips.
| Index | S2 | S1 | Pivot | R1 | R2 |
| Dow Industrials (^DJI): Daily | 39,646 | 39,727 | 39,798 | 39,878 | 39,949 |
| Weekly | 38,357 | 39,082 | 39,486 | 40,211 | 40,614 |
| Monthly | 37,795 | 38,801 | 39,345 | 40,351 | 40,895 |
| S&P500 (^GSPC): Daily | 5,236 | 5,245 | 5,255 | 5,264 | 5,274 |
| Weekly | 5,086 | 5,170 | 5,216 | 5,300 | 5,345 |
| Monthly | 4,839 | 5,047 | 5,154 | 5,362 | 5,469 |
| Nasdaq (^IXIC): Daily | 16,309 | 16,344 | 16,383 | 16,418 | 16,456 |
| Weekly | 15,703 | 16,041 | 16,290 | 16,628 | 16,877 |
| Monthly | 15,036 | 15,708 | 16,123 | 16,795 | 17,211 |
Here are the formulas:
![]()
Earnings season is over.
Here's a symbol list of 158 chart and candlestick patterns (13 "investment grade" candle patterns) found in today's securities using my version of Patternz: ANF, AES, A, ALK, ALGT, AMED, AEL, ANIK, AR, APA, ARCB, ARW, ASH, AIZ, ATO, ADSK, AVA, BECN, BZH, BERY, BIG, BA, BAH, BRC, BCO, CPB, CLS, COR, CLF, CNA, CNX, CAG, CONN, XRAY, DVN, DSGR, EIX, EOG, EQT, EG, EXC, EXPD, XOM, FICO, FARO, FDX, FIS, FE, FIVN, FLEX, FCX, GME, IT, GIS, GGG, HBI, THG, HLIT, HP, HOV, ILMN, IPI, JNJ, KBH, K, KSS, LZB, LEG, LEN, L, MHO, MRO, MDC, MLKN, MUR, NFG, NEU, NEE, NI, NOC, NUS, PDCO, PTEN, PAYX, PCTY, PFE, PCG, PXD, PPL, PFG, PGR, PSTG, DGX, RGS, ROP, R, SAND, SHW, SLGN, SKX, SMAR, SCCO, SWN, SCS, SUM, SRDX, TGT, TDOC, TDC, TTD, TDG, RIG, TRV, TZOO, TG, UIS, VFC, WRB, WPM, WSC, WOLF, IAI, IYK, IYE, ITB, IEZ, IHE, IAT, IGE, IYF, ECH, EWW, EWD, EWL, EWU, IBB, PXJ, GLD, UNG, VHT. Click this link for details (pattern type, start and end dates).
For a list of small patterns (those a few days wide) click this link.
The below industries were the best (rank 1) or worst performing of those I follow.
|
-- Thomas Bulkowski, author: Invest for Two-Comma Wealth (Ad)
![]()
Support this site! Clicking any of the books (below) takes you to
Amazon.com If you buy ANYTHING while there, they pay for the referral.
Legal notice for paid links: "As an Amazon Associate I earn from qualifying purchases."
|
My Stock Market Books
|
My Novels
Orb Foresight Rewrite Coming!
|