
As of 05/04/2026
Indus: 48,942 -557.37 -1.1%
Trans: 19,606 -992.51 -4.8%
Utils: 1,153 -4.13 -0.4%
Nasdaq: 25,068 -46.64 -0.2%
S&P 500: 7,201 -29.37 -0.4%
|
YTD
+1.8%
+13.0%
+7.9%
+7.9%
+5.2%
|
|
As of 05/04/2026
Indus: 48,942 -557.37 -1.1%
Trans: 19,606 -992.51 -4.8%
Utils: 1,153 -4.13 -0.4%
Nasdaq: 25,068 -46.64 -0.2%
S&P 500: 7,201 -29.37 -0.4%
|
YTD
+1.8%
+13.0%
+7.9%
+7.9%
+5.2%
| |
|
| ||
Here's a symbol list of 105 chart and candlestick patterns (13 "investment grade" candle patterns) found in today's securities using my version of Patternz: ABT, DOX, AEO, AIG, ANIK, AMAT, AVA, BIG, BA, BMY, CDNS, CALM, CE, CNC, CENX, CDAY, CLF, CXW, CSGP, COST, COTY, CCRN, D, EL, EXPD, FDS, FLS, FORM, FTNT, FCX, FRD, GME, GNW, GPN, GMS, HURC, IIIN, IPAR, INTU, JKHY, LH, LRCX, LOW, LXU, M, MANH, MAN, MRO, MSFT, MOS, MYGN, NBR, JWN, NUS, NTNX, PKG, PATK, PDCO, PYPL, PHM, PSTG, REGN, ROL, SAIA, SAND, SIGI, SHW, SLGN, SSYS, TJX, TDG, TG, VEEV, VRSN, WMT, WAT, WSO, WERN, WSM, WSC, IYM, FDN, ILF, EWO, EWK, EWZ, EWC, ECH, EWH, EWJ, EWU, DBA, PBE, PJP, XLP, UNG, SMH. Click this link for details (pattern type, start and end dates).
For a list of small patterns (those a few days wide) click this link.
$ $ $
You can find setups based on a Fibonacci retrace by clicking on the link.
The following patterns were found manually, not using Patternz. Mr. Bulkowski has excluded any securities he owns from appearing in the list. However, he may add any of the securities listed to his portfolio at any time, just as you can.
In the table below, the red and green colors are based on the historical breakout direction for the associated chart pattern. If a high and tight flag appears, the start and end dates highlight the flagpole only and not the flag.
For details about the chart patterns, click here.
-- Thomas Bulkowski, author: Invest for Two-Comma Wealth and the novel (fiction), Foresight (#Ad)
![]()
| Symbol | Chart Pattern | Bullish Bearish | Start | End | Industry |
| AEO | Broadening bottom | 06/12/2024 | 08/26/2024 | Apparel | |
| AIG | Double Top, Adam and Adam | 07/18/2024 | 07/30/2024 | Insurance (Prop/Casualty) | |
| AMWD | Pipe bottom | 08/05/2024 | 08/12/2024 | Building Materials | |
| ADP | Ugly double bottom | 07/10/2024 | 08/06/2024 | IT Services | |
| BSET | Pipe bottom | 08/05/2024 | 08/12/2024 | Furn/Home Furnishings | |
| BBY | Double Bottom, Eve and Eve | 07/02/2024 | 08/05/2024 | Retail (Special Lines) | |
| BIG | Dead-cat bounce | 08/29/2024 | 08/29/2024 | Retail Store | |
| BOOT | Broadening top | 06/26/2024 | 08/26/2024 | Shoe | |
| BFH | Pipe bottom | 07/29/2024 | 08/05/2024 | Information Services | |
| BLDR | Pipe bottom | 07/29/2024 | 08/05/2024 | Retail Building Supply | |
| CBT | Pipe bottom | 07/29/2024 | 08/05/2024 | Chemical (Diversified) | |
| CDNS | Pipe top | 08/12/2024 | 08/19/2024 | Computer Software and Svcs | |
| CLF | Pipe bottom | 08/12/2024 | 08/19/2024 | Metals and Mining (Div.) | |
| CAG | Triangle, symmetrical | 08/05/2024 | 08/26/2024 | Food Processing | |
| CR | Ugly double bottom | 08/05/2024 | 08/20/2024 | Diversified Co. | |
| DFS | Pipe bottom | 08/05/2024 | 08/12/2024 | Financial Services | |
| DSGR | Ugly double bottom | 07/05/2024 | 08/05/2024 | Metal Fabricating | |
| DRQ | Pipe bottom | 08/05/2024 | 08/12/2024 | Oilfield Svcs/Equipment | |
| BOOM | Double Bottom, Eve and Eve | 08/13/2024 | 08/22/2024 | Metal Fabricating | |
| EOG | Pipe bottom | 07/29/2024 | 08/05/2024 | Natural Gas (Distributor) | |
| EXPI | Pipe bottom | 08/05/2024 | 08/12/2024 | E-Commerce | |
| FWRD | Flag, high and tight | 07/09/2024 | 08/29/2024 | Trucking/Transp. Leasing | |
| FRD | Pipe bottom | 08/12/2024 | 08/19/2024 | Building Materials | |
| GES | Double Top, Adam and Eve | 07/18/2024 | 07/31/2024 | Apparel | |
| INFN | Pipe bottom | 08/05/2024 | 08/12/2024 | Telecom. Equipment | |
| PODD | Head-and-shoulders bottom | 07/26/2024 | 08/26/2024 | Medical Supplies | |
| JAZZ | Ugly double bottom | 07/10/2024 | 08/13/2024 | Biotechnology | |
| LEG | Double Bottom, Eve and Eve | 08/12/2024 | 08/20/2024 | Furn/Home Furnishings | |
| LOW | Ugly double bottom | 07/02/2024 | 07/25/2024 | Retail Building Supply | |
| LXU | Triangle, symmetrical | 08/08/2024 | 08/29/2024 | Building Materials | |
| MTRX | Pipe bottom | 08/05/2024 | 08/12/2024 | Oilfield Svcs/Equipment | |
| META | Double Top, Adam and Adam | 08/15/2024 | 08/22/2024 | E-Commerce | |
| MLKN | Pipe bottom | 08/05/2024 | 08/12/2024 | Furn/Home Furnishings | |
| NOV | Broadening bottom | 08/05/2024 | 08/29/2024 | Oilfield Svcs/Equipment | |
| PDCO | Head-and-shoulders complex top | 06/18/2024 | 08/27/2024 | Medical Supplies | |
| PAYX | Ugly double bottom | 07/10/2024 | 07/22/2024 | IT Services | |
| RCKY | Pipe bottom | 08/05/2024 | 08/12/2024 | Shoe | |
| SKYW | Double Top, Eve and Eve | 07/16/2024 | 07/24/2024 | Air Transport | |
| SSYS | Dead-cat bounce | 08/29/2024 | 08/29/2024 | Electronics | |
| SUM | Diamond top | 07/12/2024 | 08/29/2024 | Cement and Aggregates | |
| TEVA | Rising wedge | 07/12/2024 | 08/28/2024 | Drug | |
| TSCO | Ugly double bottom | 08/05/2024 | 08/21/2024 | Retail Building Supply | |
| TG | Ugly double bottom | 06/26/2024 | 08/05/2024 | Chemical (Specialty) | |
| UGI | Pipe bottom | 08/05/2024 | 08/12/2024 | Natural Gas (Distributor) |
![]()
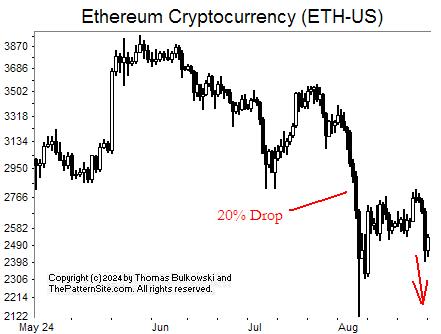
I show a picture of the cryptocurrency Ethereum (ETH-USD) on the daily scale.
$ $ $
I consider declines of more than 15% in a single day to form a chart pattern called a dead-cat bounce. That's for stocks, not cryptocurrencies such as Ethereum (ETH-USD), which I show in the chart.
After the big decline, stocks bounce up, round over, and then drop farther. The drop bottoms 18% lower than the initial plunge (the lowest low before the bounce) and that happens 67% of the time.
I haven't studied cryptocurrencies to determine if a dead-cat bounce happens the same way, but if it does, then look for ETH to continue lower.
$ $ $
Here's a symbol list of 110 chart and candlestick patterns (13 "investment grade" candle patterns) found in today's securities using my version of Patternz: ABT, ANF, AEIS, AFG, AIG, AMGN, AMAT, ARCB, ADM, AGO, AXS, BMI, BIG, BR, CDNS, CNC, CLF, CNO, COP, COST, COTY, CCRN, CW, DDS, EXP, EBAY, XOM, FARO, FORM, FTV, FDP, FRD, GME, GIS, GNW, GES, THG, HELE, HOV, HUBG, HURC, IDA, ITW, INTU, JKHY, JAZZ, KEYS, KLIC, LH, M, MRTN, MLM, MTRN, MSFT, MUR, NBR, NFLX, OMCL, PKG, PANW, PKE, PEN, PFG, PRU, DGX, RTX, R, SAIA, SIGI, NOW, SMAR, TPR, TDOC, TPX, TJX, RIG, TREX, UPS, UNM, VECO, VMC, WAT, WERN, WOLF, QTEC, SOXX, ITB, EWK, EWG, EIS, EWJ, EWM, DBA, ROBO, XLP, XHB, UNG, SMH. Click this link for details (pattern type, start and end dates).
For a list of small patterns (those a few days wide) click this link.
$ $ $
The following table shows where Fibonacci retrace values of the day's high-low range are plus pivot points, calculated on the Nasdaq composite, sorted by value. When several are near each other (small differences), the area might act as support or resistance.
-- Thomas Bulkowski
![]()
| © 2024 ThePatternSite.com Metric | Value | Diff | Close (within 10% of the high-low range for the day)? |
| Monthly S2 | 14,711.14 | ||
| Monthly S1 | 16,133.59 | 1,422.44 | |
| Monthly Pivot | 17,130.98 | 997.40 | |
| Daily S2 | 17,264.58 | 133.60 | |
| Weekly S2 | 17,287.66 | 23.07 | Yes! The Weekly S2 is close to the Daily S2. |
| Daily S1 | 17,410.31 | 122.65 | |
| Weekly S1 | 17,421.84 | 11.54 | Yes! The Weekly S1 is close to the Daily S1. |
| Low | 17,439.40 | 17.56 | Yes! The Low is close to the Weekly S1. |
| Close | 17,556.03 | 116.63 | |
| 61.8% Down from Intraday High | 17,561.85 | 5.82 | Yes! The 61.8% Down from Intraday High is close to the Close. |
| Daily Pivot | 17,585.12 | 23.28 | Yes! The Daily Pivot is close to the 61.8% Down from Intraday High. |
| 50% Down from Intraday High | 17,599.67 | 14.55 | Yes! The 50% Down from Intraday High is close to the Daily Pivot. |
| 38.2% Down from Intraday High | 17,637.49 | 37.82 | |
| Weekly Pivot | 17,719.77 | 82.27 | |
| Daily R1 | 17,730.85 | 11.08 | Yes! The Daily R1 is close to the Weekly Pivot. |
| Open | 17,738.80 | 7.96 | Yes! The Open is close to the Daily R1. |
| High | 17,759.94 | 21.14 | Yes! The High is close to the Open. |
| Weekly R1 | 17,853.95 | 94.01 | |
| Daily R2 | 17,905.66 | 51.71 | |
| Weekly R2 | 18,151.88 | 246.21 | |
| Monthly R1 | 18,553.43 | 401.55 | |
| Monthly R2 | 19,550.82 | 997.40 |
This is a picture of the chart pattern indicator on the daily scale. The indicator is the line chart below a chart of the S&P 500 composite.
I only show one chart this week because the second is redundant.
The tall green bar on the far right of the chart shows that the indicator is bullish. However, at A, the magenta line shows that the indicator turned down even as the index continued to move sideways.
That's divergence. It suggests the index is going to drop. Resistance setup by the prior peak (July) looks to prevent a new high in the next week or two (as a guess), so I think we'll see a retrace.
A half point rate cut by the FED in September could reverse the drop (the market would soar until it realizes that the FED might view a recession is likely, and then we'd see a tumble). A quarter point might accelerate the drop (the market wants more).
$ $ $
Here's a symbol list of 123 chart and candlestick patterns (13 "investment grade" candle patterns) found in today's securities using my version of Patternz: DDD, ABM, ADTN, ALRM, ALKS, AEP, AMAT, ATR, ADM, ASH, ADSK, BAH, BFH, BMY, CDNS, CPB, CX, COR, CNC, CRL, CLF, CTSH, CMTL, COP, COTY, CCRN, ECL, EOG, EFX, XOM, FFIV, FDS, FISV, FTV, FNV, FRD, GME, GAP, HE, HTLD, HELE, HSY, HWM, PODD, INTU, IRM, JAZZ, JBLU, KALU, LAMR, LDOS, M, MLM, MCO, MOS, NBR, NTGR, NTAP, NUS, NTNX, OUT, OXM, PKG, PKE, PDCO, PPG, PRU, QCOM, RRC, RNG, ROK, RCKY, ROP, SAIA, SAND, SEIC, SIGI, SCI, NOW, SNPS, TPR, TECH, TDY, TEVA, TXN, TXT, TZOO, TWLO, UPS, VECO, VEEV, VRTX, WAT, WSM, WOLF, WWD, FDN, FXI, IGV, MXI, IYF, IHI, EWG, EWH, EWI, EWM, EWW, EZA, EWP, THD, TUR, EWU, UNG. Click this link for details (pattern type, start and end dates).
For a list of small patterns (those a few days wide) click this link.
-- Thomas Bulkowski
![]()
$ $ $
I show another slider trading quiz featuring Yellow Roadway: YELL (actual trade) stock.
$ $ $
Here's a symbol list of 183 chart and candlestick patterns (13 "investment grade" candle patterns) found in today's securities using my version of Patternz: DDD, ANF, ACIW, AYI, ADTN, ATSG, ALRM, AA, ALKS, ALL, AMED, AEE, AXP, AMWD, APOG, ARCB, ACGL, ADM, ANET, AWI, ARW, ATO, ADSK, AVA, BSET, BZH, BMRN, BAH, BCO, BRKR, BG, CBT, CACI, CPB, CX, COR, CNC, CENX, CDAY, CRL, CIEN, CINF, CLF, CNX, CTSH, CL, CMTL, COTY, CROX, CCRN, CCK, DHR, DFS, DSGR, ^DJT, DRQ, ELV, EPAM, EG, EVH, EXPI, XOM, FLS, FORM, FCX, GNW, GMS, GOOGL, GPRO, THG, HLIT, HE, HTLD, HL, HNI, HON, HUN, INFN, IIIN, INTC, INTU, ISRG, JAZZ, KBH, KELYA, LANC, MHO, MANH, MRO, MLM, MAS, MTRN, MLKN, MUR, NOV, NJR, NWL, NEU, NWPX, OLN, OTEX, OR, OUT, OMI, OXM, PKG, PRFT, PCG, POR, PPG, PGR, QTWO, RRC, RCKY, ROL, SAIA, SMG, SEIC, SIGI, SKX, LUV, SCS, SSYS, TPR, TECH, TJX, TRV, TG, UGI, UNH, VLO, VECO, VRTX, WAT, WERN, WEX, WSC, WWD, XEL, ZBRA, IYM, IYE, IHE, FTEC, FDN, FXL, IYZ, IXC, MXI, IGE, ITB, IHI, EWO, EWC, EWH, EIS, EWM, TUR, EWU, IBB, PXJ, XLP, XLI, XLB, USO, VONG. Click this link for details (pattern type, start and end dates).
For a list of small patterns (those a few days wide) click this link.
$ $ $
The following table shows where Fibonacci retrace values of the day's high-low range are plus pivot points, calculated on the Dow industrials, sorted by value. When several are near each other (small differences), the area might act as support or resistance.
-- Thomas Bulkowski
![]()
| © 2024 ThePatternSite.com Metric | Value | Diff | Close (within 10% of the high-low range for the day)? |
| Monthly S2 | 37,607.25 | ||
| Monthly S1 | 39,423.89 | 1,816.63 | |
| Monthly Pivot | 40,315.90 | 892.02 | |
| Weekly S2 | 40,387.52 | 71.62 | |
| Weekly S1 | 40,814.02 | 426.50 | |
| Daily S2 | 40,987.11 | 173.09 | |
| Weekly Pivot | 41,010.97 | 23.86 | Yes! The Weekly Pivot is close to the Daily S2. |
| Daily S1 | 41,113.82 | 102.85 | |
| Low | 41,140.23 | 26.41 | Yes! The Low is close to the Daily S1. |
| Open | 41,200.84 | 60.61 | |
| Close | 41,240.52 | 39.68 | |
| 61.8% Down from Intraday High | 41,247.12 | 6.60 | Yes! The 61.8% Down from Intraday High is close to the Close. |
| Daily Pivot | 41,266.93 | 19.81 | Yes! The Daily Pivot is close to the 61.8% Down from Intraday High. |
| 50% Down from Intraday High | 41,280.14 | 13.21 | Yes! The 50% Down from Intraday High is close to the Daily Pivot. |
| 38.2% Down from Intraday High | 41,313.16 | 33.02 | |
| Daily R1 | 41,393.64 | 80.48 | |
| High | 41,420.05 | 26.41 | Yes! The High is close to the Daily R1. |
| Weekly R1 | 41,437.47 | 17.42 | Yes! The Weekly R1 is close to the High. |
| Daily R2 | 41,546.75 | 109.29 | |
| Weekly R2 | 41,634.42 | 87.67 | |
| Monthly R1 | 42,132.54 | 498.11 | |
| Monthly R2 | 43,024.55 | 892.02 |
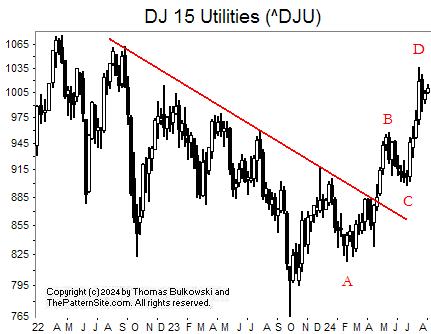
I show the Dow utilities on the weekly scale.
The index broke through a down-sloping trendline that I show here in red. That signaled a move from down to up.
At ABCD is a chart pattern called a measured move up.
AB is the first leg. CD is the second leg. BC is the corrective phase. The idea behind the pattern is that leg CD will match the length and duration of leg AB.
However, what I like about this pattern is the retrace we often see after point D. That retrace takes price down to the corrective phase, BC.
I have my doubts that the index will retrace that far. Why? Because if interest rates drop, as they seem about to do, the utility industry should prosper.
![]()
The following is a brief review of how the markets performed over time. The numbers refer to the close-to-close move in the Dow industrials.
No options expire this week.
![]()
The following is based on an SFO article in December 2004 by John Seekinger, titled, "Take a two-dimensional approach." He offers these tips.
| Index | S2 | S1 | Pivot | R1 | R2 |
| Dow Industrials (^DJI): Daily | 40,710 | 40,943 | 41,075 | 41,308 | 41,440 |
| Weekly | 40,366 | 40,770 | 40,989 | 41,394 | 41,613 |
| Monthly | 37,585 | 39,380 | 40,294 | 42,089 | 43,003 |
| S&P500 (^GSPC): Daily | 5,564 | 5,599 | 5,621 | 5,656 | 5,677 |
| Weekly | 5,517 | 5,576 | 5,610 | 5,668 | 5,702 |
| Monthly | 4,942 | 5,288 | 5,466 | 5,812 | 5,990 |
| Nasdaq (^IXIC): Daily | 17,599 | 17,738 | 17,840 | 17,979 | 18,081 |
| Weekly | 17,395 | 17,636 | 17,827 | 18,068 | 18,259 |
| Monthly | 14,818 | 16,348 | 17,238 | 18,768 | 19,658 |
Here are the formulas:
![]()
Earnings season is either underway or should be starting soon. The sessions could be more volatile.
Here's a symbol list of 162 chart and candlestick patterns (13 "investment grade" candle patterns) found in today's securities using my version of Patternz: ACIW, ADTN, AMED, AEE, AMWD, AON, APOG, ADM, AWI, ARW, ATO, AVY, BMI, BSET, BECN, BKNG, BSX, BCO, CBT, CDNS, CPB, COR, CNC, CF, CRL, CLX, CNA, CNO, CNX, COTY, CCRN, CCK, CW, DFS, DSGR, DRQ, BOOM, EXP, EPAM, EXPI, FDX, FLS, IT, GNW, GFS, GL, GMS, GS, GOOGL, GPRO, THG, HE, HAYN, HTLD, HL, HNI, HUM, HUN, INFN, IIIN, INTC, TILE, IPG, INTU, ISRG, JBLU, KELYA, L, MHO, MAS, MU, MLKN, NBR, NOV, NEE, NI, NWPX, ORI, OLN, OUT, OMI, PKG, PRFT, PCG, PPG, PFG, PRU, PHM, QCOM, RGS, RLI, RHI, RCKY, ROL, CRM, SAND, SIGI, SCI, SCCO, SWN, SCS, SSYS, SNPS, TJX, TRV, TG, TREX, UGI, VRTX, VC, WAT, WLK, WSC, WDAY, IYM, IAI, IHE, ICF, IAT, MXI, ILF, SLV, IYF, EWA, EWO, EWK, EWZ, EWC, EWI, EWJ, EWW, EPP, EWS, EWP, EWT, THD, TUR, PEJ, PXJ, PJP, XLF, VAW. Click this link for details (pattern type, start and end dates).
For a list of small patterns (those a few days wide) click this link.
The below industries were the best (rank 1) or worst performing of those I follow.
|
-- Thomas Bulkowski
![]()
$ $ $
Here's a symbol list of 219 chart and candlestick patterns (13 "investment grade" candle patterns) found in today's securities using my version of Patternz: AXDX, ACN, ADBE, ADTN, AMD, A, ALKS, ALGT, AMZN, AMED, AMWD, AMGN, AMN, APH, ANIK, APOG, ACGL, ATO, ADSK, BMI, BCPC, BSET, BIG, BKNG, BAH, BSX, BCO, BR, CBT, CDNS, CNC, CF, CRL, CIEN, CINF, CSCO, CNA, CGNX, COST, COTY, CRH, CCK, CTS, DHR, XRAY, DDS, DFS, ^DJT, ^DJI, DRQ, EPAM, EFX, EL, EG, EXPI, EZPW, FFIV, FDS, FICO, FLEX, FORM, FTNT, FNV, FRD, GE, GFS, GOOGL, GPRO, HLIT, HTLD, HP, HNI, HD, HUM, HUN, IEX, ILMN, INCY, INFN, IIIN, INTC, TILE, INTU, KALU, KELYA, KEYS, KLAC, KLIC, LRCX, LANC, LOW, MHO, MTSI, M, MANH, MTRN, MTRX, MU, MSFT, MLKN, ^IXIC, NTGR, NTAP, NWL, NEE, NKE, NOC, NVDA, OLN, ORCL, OMI, PKG, PDCO, PCG, PPG, PHM, KWR, QCOM, RMBS, RGS, RCKY, ROP, ^GSPC, SBH, NOW, SPSC, SXI, SCS, SSYS, SNPS, TPR, TDOC, TDC, TER, TEVA, TXN, TTD, TJX, RIG, TZOO, TREX, UGI, VECO, VRTX, WAT, WLK, WSC, WOLF, WDAY, XEL, IYC, FTEC, QTEC, FXL, BOTZ, QQQ, IYZ, IEV, IGV, MXI, IXN, ILF, SOXX, IHI, EWA, EWO, EWK, EWQ, EWG, EWI, EWJ, EWM, EWW, EPP, EWP, EWD, EWL, EWT, THD, TUR, EWU, QLD, DBA, PHO, SSO, ROBO, XLY, XLF, SPY, XLK, SMH, VHT, MGK, VONG. Click this link for details (pattern type, start and end dates).
For a list of small patterns (those a few days wide) click this link.
$ $ $
You can find setups based on a Fibonacci retrace by clicking on the link.
The following patterns were found manually, not using Patternz. Mr. Bulkowski has excluded any securities he owns from appearing in the list. However, he may add any of the securities listed to his portfolio at any time, just as you can.
In the table below, the red and green colors are based on the historical breakout direction for the associated chart pattern. If a high and tight flag appears, the start and end dates highlight the flagpole only and not the flag.
For details about the chart patterns, click here.
-- Thomas Bulkowski, author: Invest for Two-Comma Wealth and the novel (fiction), Foresight (#Ad)
![]()
| Symbol | Chart Pattern | Bullish Bearish | Start | End | Industry |
| ANF | Pipe bottom | 07/29/2024 | 08/05/2024 | Apparel | |
| DOX | Double Bottom, Adam and Adam | 08/07/2024 | 08/12/2024 | IT Services | |
| AMED | Triangle, symmetrical | 07/26/2024 | 08/20/2024 | Medical Services | |
| APH | Pipe bottom | 07/29/2024 | 08/05/2024 | Electronics | |
| APOG | Pipe bottom | 08/05/2024 | 08/12/2024 | Building Materials | |
| ACGL | Triple bottom | 07/25/2024 | 08/05/2024 | Insurance (Prop/Casualty) | |
| ADSK | Pipe bottom | 07/29/2024 | 08/05/2024 | Computer Software and Svcs | |
| AVNT | Pipe bottom | 07/29/2024 | 08/05/2024 | Chemical (Specialty) | |
| BCO | Pipe bottom | 08/05/2024 | 08/12/2024 | Industrial Services | |
| BBW | Double Bottom, Adam and Adam | 07/09/2024 | 08/05/2024 | Retail (Special Lines) | |
| CSCO | Double Bottom, Adam and Adam | 08/06/2024 | 08/12/2024 | Computers and Peripherals | |
| CLX | Ugly double bottom | 07/30/2024 | 08/12/2024 | Household Products | |
| CMTL | Broadening top, right-angled and descending | 07/12/2024 | 08/19/2024 | Telecom. Equipment | |
| GLW | Double Bottom, Adam and Adam | 07/30/2024 | 08/05/2024 | Telecom. Equipment | |
| COTY | Double Bottom, Adam and Eve | 08/05/2024 | 08/12/2024 | Toiletries/Cosmetics | |
| DUK | Triangle, symmetrical | 08/05/2024 | 08/16/2024 | Electric Utility (East) | |
| FDX | Head-and-shoulders top | 06/28/2024 | 08/01/2024 | Air Transport | |
| GOOGL | Pipe bottom | 08/05/2024 | 08/12/2024 | Internet | |
| HNI | Pipe bottom | 08/05/2024 | 08/12/2024 | Furn/Home Furnishings | |
| IIIN | Pipe bottom | 08/05/2024 | 08/12/2024 | Building Materials | |
| INTC | Pipe bottom | 08/05/2024 | 08/12/2024 | Semiconductor | |
| JAZZ | Double Bottom, Adam and Adam | 08/05/2024 | 08/13/2024 | Biotechnology | |
| KMB | Double Bottom, Adam and Adam | 07/24/2024 | 07/31/2024 | Household Products | |
| MHO | Pipe bottom | 08/05/2024 | 08/12/2024 | Homebuilding | |
| MGY | Double Top, Eve and Adam | 07/18/2024 | 08/01/2024 | Petroleum (Producing) | |
| MANH | Pipe bottom | 07/15/2024 | 07/22/2024 | IT Services | |
| MRK | Double Bottom, Eve and Adam | 08/07/2024 | 08/14/2024 | Drug | |
| OLN | Pipe bottom | 08/05/2024 | 08/12/2024 | Chemical (Basic) | |
| OTEX | Pipe bottom | 07/29/2024 | 08/05/2024 | E-Commerce | |
| OMI | Triangle, symmetrical | 07/23/2024 | 08/22/2024 | Medical Supplies | |
| PCTY | Triangle, symmetrical | 08/02/2024 | 08/22/2024 | E-Commerce | |
| PPG | Pipe bottom | 08/05/2024 | 08/12/2024 | Chemical (Diversified) | |
| PSTG | Pipe bottom | 07/29/2024 | 08/05/2024 | Computers and Peripherals | |
| DGX | Rising wedge | 07/17/2024 | 08/13/2024 | Medical Services | |
| SMAR | Pipe bottom | 07/29/2024 | 08/05/2024 | E-Commerce | |
| SCS | Pipe bottom | 08/05/2024 | 08/12/2024 | Furn/Home Furnishings | |
| SSYS | Pipe bottom | 08/05/2024 | 08/12/2024 | Electronics | |
| TTD | Pipe bottom | 07/29/2024 | 08/05/2024 | Advertising | |
| TJX | Pipe bottom | 08/05/2024 | 08/12/2024 | Retail Store | |
| TRV | Triangle, symmetrical | 07/18/2024 | 08/13/2024 | Insurance (Prop/Casualty) | |
| VLO | Pipe top | 07/22/2024 | 07/29/2024 | Petroleum (Integrated) | |
| VRTX | Pipe bottom | 08/05/2024 | 08/12/2024 | Biotechnology | |
| WMB | Ugly double bottom | 08/05/2024 | 08/13/2024 | Natural Gas (Distributor) | |
| WSC | Pipe bottom | 08/05/2024 | 08/12/2024 | Industrial Services | |
| ZBRA | Double Bottom, Adam and Adam | 08/05/2024 | 08/08/2024 | Computers and Peripherals | |
| IGV | Pipe bottom | 07/29/2024 | 08/05/2024 | Computer Software and Svcs |
![]()
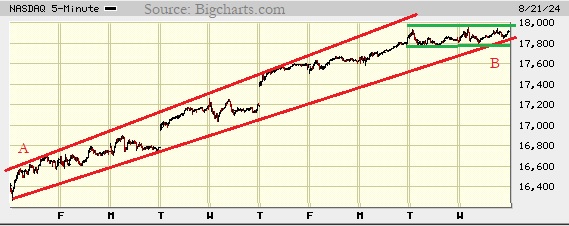
I show a picture of the Nasdaq composite on the 5-minute scale.
There's not much happening in the Nasdaq this past week. The price followed a channel, which I show bounded by red lines (A). The two lines diverge some, but that's not a cause for panic.
At B, the movement flattens out, forming a flat channel or what's called a rectangle top in my world.
What does that mean? The bullish forces which had been pushing the index higher have stepped back some. They are now evenly matched. There's an old saying that goes, "If the market refuses to rise, then it's going to drop." That's paraphrased but it means the sideways move is bearish.
The CPI (chart pattern indicator), has climbed a bit, meaning today's performance was spread among many issues, which is good (bullish). So I don't know if the market is going to rise or fall or just line sideways. I'll leave you to find the answer.
$ $ $
Here's a symbol list of 153 chart and candlestick patterns (13 "investment grade" candle patterns) found in today's securities using my version of Patternz: DDD, ADBE, ADTN, AMD, AFL, ATSG, ALKS, AMWD, APOG, ARCB, ACGL, AWI, ATO, AVA, BSET, BBY, BFH, BCO, BR, CX, CNC, CF, CSCO, CLF, CONN, GLW, COST, COTY, CRH, CCK, CSGS, DVN, DDS, DFS, DRQ, EMN, ECL, EME, EOG, EPAM, EXPI, FDX, FTV, FNV, FDP, GME, GD, GFS, GOOGL, GPRO, HTLD, HL, HSII, HP, HNI, HD, HUBG, HUN, INFN, IIIN, INTC, INTU, KELYA, KEYS, KFRC, KMB, LANC, LDOS, MHO, MGY, MANH, MAN, MRTN, MAS, MTRX, MLKN, MLI, NTGR, NOVT, OLN, OR, PKG, PTEN, PPG, PEG, PHM, RL, RGS, RNG, RCKY, ROST, RGLD, SAIA, SBH, SIGI, SHW, SCS, SSYS, TGT, TXN, TJX, TOL, TSCO, RIG, TZOO, TWLO, UGI, UPS, UNH, UNM, VEEV, VRTX, VMC, WAT, WERN, WSC, WWD, IYM, IYK, IYC, IEV, MXI, ITB, EWA, EWO, EWQ, EWG, EWI, EWJ, EWW, EWS, EZA, THD, IBB, PJP, XLY, XLP, XLI. Click this link for details (pattern type, start and end dates).
For a list of small patterns (those a few days wide) click this link.
$ $ $
The following table shows where Fibonacci retrace values of the day's high-low range are plus pivot points, calculated on the Nasdaq composite, sorted by value. When several are near each other (small differences), the area might act as support or resistance.
-- Thomas Bulkowski
![]()
| © 2024 ThePatternSite.com Metric | Value | Diff | Close (within 10% of the high-low range for the day)? |
| Monthly S2 | 14,490.03 | ||
| Monthly S1 | 16,204.51 | 1,714.48 | |
| Weekly S2 | 16,455.75 | 251.24 | |
| Weekly S1 | 17,187.37 | 731.62 | |
| Monthly Pivot | 17,423.02 | 235.65 | |
| Weekly Pivot | 17,431.01 | 7.99 | Yes! The Weekly Pivot is close to the Monthly Pivot. |
| Daily S2 | 17,718.92 | 287.91 | |
| Low | 17,790.98 | 72.06 | |
| Daily S1 | 17,818.96 | 27.98 | |
| Open | 17,840.51 | 21.55 | |
| 61.8% Down from Intraday High | 17,856.72 | 16.21 | Yes! The 61.8% Down from Intraday High is close to the Open. |
| 50% Down from Intraday High | 17,877.03 | 20.31 | |
| Daily Pivot | 17,891.01 | 13.99 | Yes! The Daily Pivot is close to the 50% Down from Intraday High. |
| 38.2% Down from Intraday High | 17,897.33 | 6.32 | Yes! The 38.2% Down from Intraday High is close to the Daily Pivot. |
| Close | 17,918.99 | 21.66 | |
| High | 17,963.07 | 44.08 | |
| Daily R1 | 17,991.05 | 27.98 | |
| Daily R2 | 18,063.10 | 72.06 | |
| Weekly R1 | 18,162.63 | 99.53 | |
| Weekly R2 | 18,406.27 | 243.64 | |
| Monthly R1 | 19,137.50 | 731.23 | |
| Monthly R2 | 20,356.01 | 1,218.51 |
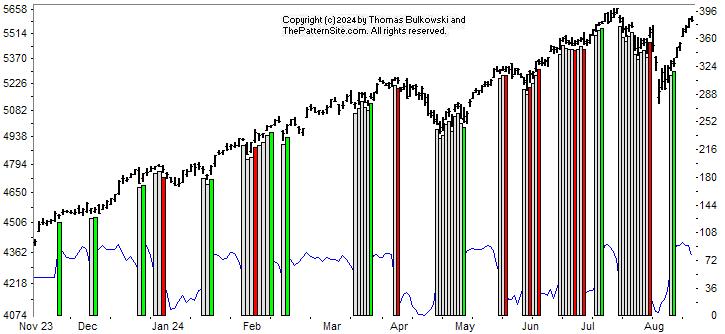
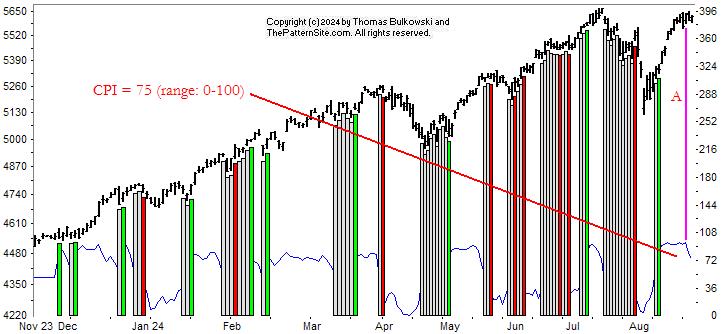
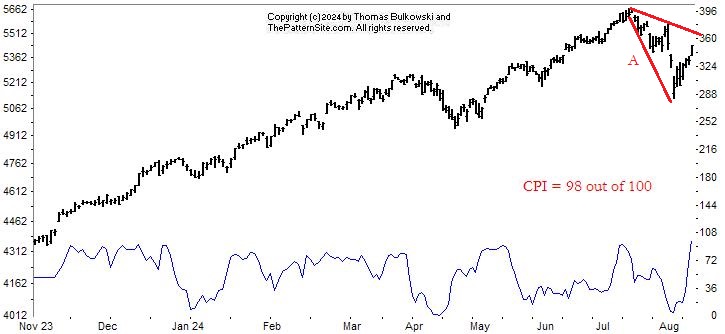
This is a picture of the chart pattern indicator on the daily scale. The indicator is the line chart below a chart of the S&P 500 composite.
Not much has changed during the past week on this chart. The bullish signal shown by the vertical green bar remains intact. However, the next chart shows more detail.
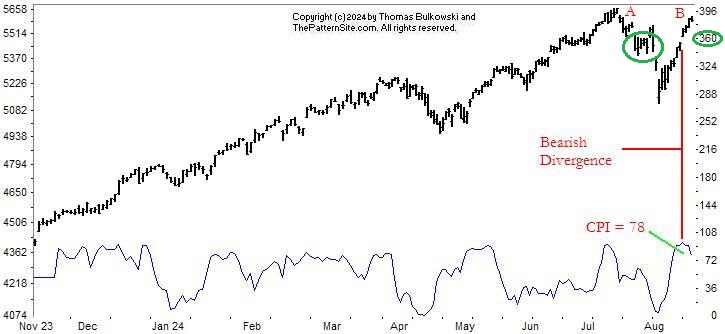
At B, the index is facing resistance setup by peak A.
That resistance is confirmed by the CPI rounding over and showing weakness. It reads 78, where 100 is the strongest bullish signal and 0 is the strongest bearish signal. The neutral zone is 35 to 65.
What does that mean? The indicator is heading toward neutral. Even as the indicator hints of weakness, the index climbs. I show the timing of that with the red vertical line (divergence).
It's possible the index will shake off the weakness and continue up, but my guess is we'll see a minor retrace here. Using the right scale, we might see the index touch 360 (the two circled green areas, one is a knot).
$ $ $
Here's a symbol list of 172 chart and candlestick patterns (13 "investment grade" candle patterns) found in today's securities using my version of Patternz: AXDX, ADTN, A, ALKS, AEE, AMWD, APOG, AWI, AGO, BSET, BIG, BIO, BMRN, BRC, BFH, BCO, CX, CNC, CF, CHKP, CINF, CSCO, CLNE, CNA, CNO, CMTL, ED, CONN, CXW, COTY, CRH, CROX, CCRN, CW, DECK, XRAY, FANG, DFS, DRQ, EBAY, EMR, EOG, EPAM, EL, EXPI, XOM, FLS, FCX, GPS, GILD, GFS, GOOGL, GPRO, GGG, HLIT, HTLD, HL, HSII, HP, HNI, DHI, HUN, INFN, IBP, IIIN, INTC, IPAR, INTU, JBLU, KALU, KELYA, KEYS, KFRC, KSS, LAMR, LXU, MHO, MANH, MKTX, MRTN, MAS, MTRX, MLKN, MOS, NFG, NOC, OLN, OR, PKG, PANW, PKE, PATK, PTEN, PCG, POR, PPG, PINC, PEG, RGS, RNG, RCKY, ROP, RGLD, SAND, SIGI, SLGN, STR, SO, SCCO, SPSC, SXI, SCS, SSYS, SUM, TECH, TDY, TJX, RIG, UHAL, UGI, VECO, MDRX, VRSN, VRTX, WAT, WSO, WPM, WSC, IYM, IAI, IEZ, IHE, IYH, IXC, IEO, EWQ, EPP, EWS, EWY, EWD, EWL, THD, DBA, PEJ, PXJ, XLV, XAR, VHT. Click this link for details (pattern type, start and end dates).
For a list of small patterns (those a few days wide) click this link.
-- Thomas Bulkowski
-- Thomas Bulkowski, author:
![]()
$ $ $
I show another slider trading quiz featuring Yellow Roadway 2 (YELL) stock.
$ $ $
Here's a symbol list of 162 chart and candlestick patterns (13 "investment grade" candle patterns) found in today's securities using my version of Patternz: ABT, ANF, ABM, ADTN, A, AEO, AEP, AXP, AIG, APH, ANIK, ADM, ATO, ADSK, AVNT, AVA, BMI, BALL, BIIB, BKNG, BRC, BFH, BLDR, CBT, CDNS, CNC, CNP, CF, CHKP, CTAS, CNX, CMTL, CONN, COP, CROX, CCRN, CCK, CMI, DECK, DVN, FANG, DSGR, ^DJT, EBAY, EOG, EXC, FAST, GPS, IT, GD, GNW, GPN, HTLD, HSII, HELE, DHI, JBHT, INFN, IIIN, JKHY, JBLU, KMB, KSS, LRCX, LDOS, LEN, MTSI, M, MGY, MANH, MRO, MCHX, MAS, MA, MTRN, NTGR, NTAP, NOVT, NTNX, OXY, OTEX, OR, OUT, OMI, OXM, PANW, PKE, PCG, PLXS, PGR, PSTG, QCOM, RMBS, RNG, ROL, RGLD, SAND, SEE, SIGI, SCI, NOW, SMAR, SCS, TPR, TGT, TPX, TTD, UHAL, VFC, VLO, VECO, MDRX, V, VMC, WAT, WDAY, IYM, IYK, FXI, IEV, IGV, MXI, EWA, EWO, EWK, EEM, EWQ, EWG, EWH, EIS, EWI, EWJ, EWM, EPP, EWS, EZA, EWP, EWD, EWL, EWT, THD, EWU, DBA, ROBO, XLF, UNG, USO, VAW. Click this link for details (pattern type, start and end dates).
For a list of small patterns (those a few days wide) click this link.
$ $ $
The following table shows where Fibonacci retrace values of the day's high-low range are plus pivot points, calculated on the Dow industrials, sorted by value. When several are near each other (small differences), the area might act as support or resistance.
-- Thomas Bulkowski
![]()
| © 2024 ThePatternSite.com Metric | Value | Diff | Close (within 10% of the high-low range for the day)? |
| Monthly S2 | 37,380.54 | ||
| Weekly S2 | 38,817.12 | 1,436.58 | |
| Monthly S1 | 39,138.54 | 321.42 | |
| Weekly S1 | 39,856.82 | 718.29 | |
| Monthly Pivot | 40,257.27 | 400.44 | |
| Weekly Pivot | 40,291.43 | 34.16 | |
| Daily S2 | 40,588.40 | 296.98 | |
| Low | 40,670.83 | 82.43 | |
| Open | 40,670.83 | 0.00 | Yes! The Open is close to the Low. |
| Daily S1 | 40,742.46 | 71.64 | |
| 61.8% Down from Intraday High | 40,761.17 | 18.70 | Yes! The 61.8% Down from Intraday High is close to the Daily S1. |
| 50% Down from Intraday High | 40,789.07 | 27.91 | |
| 38.2% Down from Intraday High | 40,816.98 | 27.91 | |
| Daily Pivot | 40,824.89 | 7.91 | Yes! The Daily Pivot is close to the 38.2% Down from Intraday High. |
| Close | 40,896.53 | 71.64 | |
| High | 40,907.32 | 10.79 | Yes! The High is close to the Close. |
| Daily R1 | 40,978.96 | 71.64 | |
| Daily R2 | 41,061.38 | 82.43 | |
| Weekly R1 | 41,331.13 | 269.75 | |
| Weekly R2 | 41,765.74 | 434.61 | |
| Monthly R1 | 42,015.26 | 249.52 | |
| Monthly R2 | 43,134.00 | 1,118.73 |
$ $ $
I show another slider trading quiz featuring Yellow Roadway 2 (YELL) stock.
$ $ $
Here's a symbol list of 162 chart and candlestick patterns (13 "investment grade" candle patterns) found in today's securities using my version of Patternz: ABT, ANF, ABM, ADTN, A, AEO, AEP, AXP, AIG, APH, ANIK, ADM, ATO, ADSK, AVNT, AVA, BMI, BALL, BIIB, BKNG, BRC, BFH, BLDR, CBT, CDNS, CNC, CNP, CF, CHKP, CTAS, CNX, CMTL, CONN, COP, CROX, CCRN, CCK, CMI, DECK, DVN, FANG, DSGR, ^DJT, EBAY, EOG, EXC, FAST, GPS, IT, GD, GNW, GPN, HTLD, HSII, HELE, DHI, JBHT, INFN, IIIN, JKHY, JBLU, KMB, KSS, LRCX, LDOS, LEN, MTSI, M, MGY, MANH, MRO, MCHX, MAS, MA, MTRN, NTGR, NTAP, NOVT, NTNX, OXY, OTEX, OR, OUT, OMI, OXM, PANW, PKE, PCG, PLXS, PGR, PSTG, QCOM, RMBS, RNG, ROL, RGLD, SAND, SEE, SIGI, SCI, NOW, SMAR, SCS, TPR, TGT, TPX, TTD, UHAL, VFC, VLO, VECO, MDRX, V, VMC, WAT, WDAY, IYM, IYK, FXI, IEV, IGV, MXI, EWA, EWO, EWK, EEM, EWQ, EWG, EWH, EIS, EWI, EWJ, EWM, EPP, EWS, EZA, EWP, EWD, EWL, EWT, THD, EWU, DBA, ROBO, XLF, UNG, USO, VAW. Click this link for details (pattern type, start and end dates).
For a list of small patterns (those a few days wide) click this link.
$ $ $
The following table shows where Fibonacci retrace values of the day's high-low range are plus pivot points, calculated on the Dow industrials, sorted by value. When several are near each other (small differences), the area might act as support or resistance.
-- Thomas Bulkowski
![]()
| © 2024 ThePatternSite.com Metric | Value | Diff | Close (within 10% of the high-low range for the day)? |
| Monthly S2 | 37,380.54 | ||
| Weekly S2 | 38,817.12 | 1,436.58 | |
| Monthly S1 | 39,138.54 | 321.42 | |
| Weekly S1 | 39,856.82 | 718.29 | |
| Monthly Pivot | 40,257.27 | 400.44 | |
| Weekly Pivot | 40,291.43 | 34.16 | |
| Daily S2 | 40,588.40 | 296.98 | |
| Low | 40,670.83 | 82.43 | |
| Open | 40,670.83 | 0.00 | Yes! The Open is close to the Low. |
| Daily S1 | 40,742.46 | 71.64 | |
| 61.8% Down from Intraday High | 40,761.17 | 18.70 | Yes! The 61.8% Down from Intraday High is close to the Daily S1. |
| 50% Down from Intraday High | 40,789.07 | 27.91 | |
| 38.2% Down from Intraday High | 40,816.98 | 27.91 | |
| Daily Pivot | 40,824.89 | 7.91 | Yes! The Daily Pivot is close to the 38.2% Down from Intraday High. |
| Close | 40,896.53 | 71.64 | |
| High | 40,907.32 | 10.79 | Yes! The High is close to the Close. |
| Daily R1 | 40,978.96 | 71.64 | |
| Daily R2 | 41,061.38 | 82.43 | |
| Weekly R1 | 41,331.13 | 269.75 | |
| Weekly R2 | 41,765.74 | 434.61 | |
| Monthly R1 | 42,015.26 | 249.52 | |
| Monthly R2 | 43,134.00 | 1,118.73 |
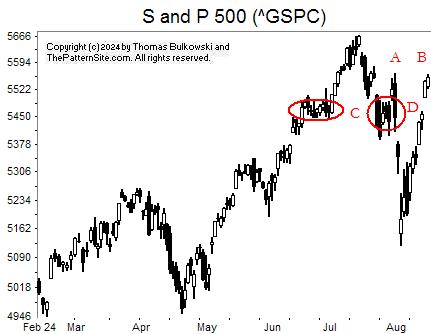
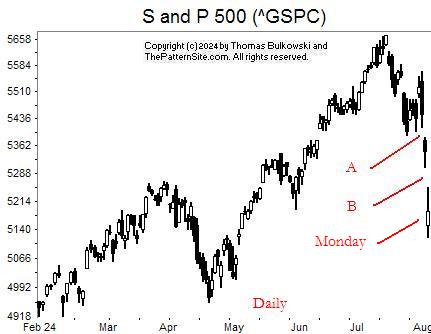
I show the S&P 500 index on the daily scale.
AB are twin peaks suggesting overhead resistance exists there. That's not true of the B peak because it hasn't formed a peak yet (unlike A, which turned lower after peaking). Spike B could see the index move higher.
When the index turns lower, look for it to pause at C, the two knots of support. Notice the gap at D. The index jumped over resistance and continued higher. Thus, we really don't know if the two circles actually shows support or resistance.
My thinking is that the index will retrace, probably to the CD area and rebound from there. However, we could just continue climbing.
![]()
The following is a brief review of how the markets performed over time. The numbers refer to the close-to-close move in the Dow industrials.
No options expire this week.
![]()
The following is based on an SFO article in December 2004 by John Seekinger, titled, "Take a two-dimensional approach." He offers these tips.
| Index | S2 | S1 | Pivot | R1 | R2 |
| Dow Industrials (^DJI): Daily | 40,341 | 40,500 | 40,613 | 40,773 | 40,886 |
| Weekly | 38,738 | 39,699 | 40,213 | 41,173 | 41,687 |
| Monthly | 37,302 | 38,981 | 40,178 | 41,857 | 43,055 |
| S&P500 (^GSPC): Daily | 5,510 | 5,532 | 5,547 | 5,569 | 5,584 |
| Weekly | 5,243 | 5,398 | 5,480 | 5,636 | 5,718 |
| Monthly | 4,897 | 5,226 | 5,448 | 5,776 | 5,998 |
| Nasdaq (^IXIC): Daily | 17,431 | 17,531 | 17,603 | 17,703 | 17,775 |
| Weekly | 16,360 | 16,996 | 17,335 | 17,971 | 18,311 |
| Monthly | 14,394 | 16,013 | 17,327 | 18,946 | 20,260 |
Here are the formulas:
![]()
Earnings season is either underway or should be starting soon. The sessions could be more volatile.
Here's a symbol list of 117 chart and candlestick patterns (13 "investment grade" candle patterns) found in today's securities using my version of Patternz: ANF, A, AMED, AEO, AEP, APH, ADSK, AVNT, BKNG, BRC, BFH, BMY, BLDR, CBT, CDNS, CNC, CF, CINF, CTAS, CNA, CNO, COP, COST, CMI, DECK, DVN, FANG, DSGR, DOV, EME, EOG, EQT, EVH, EXC, FIS, FTV, GPN, GMS, GES, THG, HTLD, HSY, JBHT, IEX, ITW, INFN, IIIN, PODD, RAMP, MTSI, MANH, MRO, MAS, MTRN, MS, NOVT, NTNX, OTEX, OR, OUT, PKG, PANW, PFE, PCG, PNW, PSTG, RLI, ROL, SAND, SIGI, SKYW, SMAR, SR, TGT, TPX, TTD, TZOO, TG, TWLO, UHAL, VFC, VMC, WAT, WWW, IAI, IYK, FXI, IYZ, IGV, IYF, EWO, EWK, EEM, EWQ, EWG, EIS, EWS, EZA, EWL, DBA, XLF, GLD, UNG, USO. Click this link for details (pattern type, start and end dates).
For a list of small patterns (those a few days wide) click this link.
The below industries were the best (rank 1) or worst performing of those I follow.
|
-- Thomas Bulkowski
![]()
$ $ $
Here's a symbol list of 278 chart and candlestick patterns (13 "investment grade" candle patterns) found in today's securities using my version of Patternz: ANF, AXDX, ADBE, AEIS, APD, ATSG, AMZN, AMED, AEO, AEP, AXP, AMN, APH, AMAT, ARCB, AIZ, ADSK, AVY, AVNT, AXS, BMI, BCPC, BECN, BKH, BA, BOOT, BSX, BRC, BFH, BCO, BMY, BR, BBW, BLDR, CBT, CDNS, CAL, CLS, COR, CNC, CNP, CDAY, CF, CHKP, CIEN, CSCO, CNX, CGNX, CONN, COP, COST, CRH, CTS, CMI, DECK, DVN, FANG, DDS, DFS, ^DJT, ^DJI, EMN, EME, EOG, EL, EXC, FFIV, FICO, FIS, FLEX, FLS, FORM, FWRD, FCX, GPS, GIS, GNW, GPN, GFS, GMS, GGG, GES, HBI, HTLD, HELE, HP, HSY, HON, HUBG, JBHT, HUN, IIIN, IPAR, IPG, INTU, ISRG, KEYS, KFRC, KMB, KSS, LZB, LRCX, LANC, LEG, LEN, LNC, LXU, MTSI, M, MANH, MRO, MKTX, MAS, MA, MTDR, MTRN, MDT, MU, MLKN, ^IXIC, NOV, NTAP, NKE, NOVT, NTNX, OLN, OTEX, PANW, PKE, PDCO, PCTY, PYPL, PFE, PCG, PLXS, PPG, PINC, PSTG, QTWO, RL, RNG, ROK, RCKY, ROG, ROST, R, ^GSPC, SBH, SIGI, SMTC, SHW, SHOP, SKX, SMAR, SWN, SCS, SNPS, TRGP, TDOC, TXN, TTD, TKR, RIG, TZOO, UHAL, UIS, VFC, VECO, VRSN, WAT, WERN, WWD, WDAY, ZBRA, ITA, IYM, IAI, IYC, IHE, DDM, FTEC, FDN, QTEC, FXL, FXI, QQQ, ICF, IYZ, IEV, IGV, MXI, IXN, ILF, SOXX, IGE, IYF, IHI, EWA, EWO, EWK, EWC, ECH, EWQ, EWG, EIS, EWI, EWJ, EWM, EWW, EPP, EWS, EZA, EWY, EWP, THD, EWU, QLD, PPA, PBE, PEJ, PHO, SSO, ROBO, XLY, XLP, XLF, XLI, XLB, XRT, SPY, XAR, XLK, UNG, USO, SMH, VHT, VIS, VAW, MGK, VONG. Click this link for details (pattern type, start and end dates).
For a list of small patterns (those a few days wide) click this link.
$ $ $
You can find setups based on a Fibonacci retrace by clicking on the link.
The following patterns were found manually, not using Patternz. Mr. Bulkowski has excluded any securities he owns from appearing in the list. However, he may add any of the securities listed to his portfolio at any time, just as you can.
In the table below, the red and green colors are based on the historical breakout direction for the associated chart pattern. If a high and tight flag appears, the start and end dates highlight the flagpole only and not the flag.
For details about the chart patterns, click here.
-- Thomas Bulkowski, author: Invest for Two-Comma Wealth and the novel (fiction), Foresight (#Ad)
![]()
| Symbol | Chart Pattern | Bullish Bearish | Start | End | Industry |
| ALRM | Broadening bottom | 04/09/2024 | 08/12/2024 | Computer Software and Svcs | |
| AIG | Double Top, Adam and Adam | 07/18/2024 | 07/30/2024 | Insurance (Prop/Casualty) | |
| CDNS | Pipe bottom | 07/29/2024 | 08/05/2024 | Computer Software and Svcs | |
| CDAY | Double Bottom, Adam and Adam | 08/05/2024 | 08/12/2024 | Information Services | |
| DSGR | Diamond top | 07/16/2024 | 08/14/2024 | Metal Fabricating | |
| ^DJI | Double Top, Adam and Adam | 07/18/2024 | 07/31/2024 | None | |
| FE | Scallop, ascending | 06/03/2024 | 08/02/2024 | Electric Utility (East) | |
| FIVN | Dead-cat bounce | 08/09/2024 | 08/09/2024 | Computer Software and Svcs | |
| FORM | Double Top, Adam and Eve | 05/23/2024 | 07/08/2024 | Semiconductor | |
| GD | Diamond top | 07/17/2024 | 08/14/2024 | Aerospace/Defense | |
| GPN | Pipe bottom | 07/29/2024 | 08/05/2024 | Computer Software and Svcs | |
| GES | Horn top | 07/15/2024 | 07/29/2024 | Apparel | |
| HE | Dead-cat bounce | 08/12/2024 | 08/12/2024 | Electric Utility (West) | |
| IDXX | Broadening bottom | 07/19/2024 | 08/13/2024 | Drug | |
| JBLU | Dead-cat bounce | 08/12/2024 | 08/12/2024 | Air Transport | |
| KMT | Diamond top | 07/16/2024 | 08/15/2024 | Metal Fabricating | |
| MLKN | Double Bottom, Adam and Adam | 08/05/2024 | 08/12/2024 | Furn/Home Furnishings | |
| NEE | Cup with handle | 05/31/2024 | 08/02/2024 | Electric Utility (East) | |
| NKE | Triple bottom | 07/15/2024 | 08/05/2024 | Shoe | |
| NTNX | Pipe bottom | 07/29/2024 | 08/05/2024 | E-Commerce | |
| OXY | Double Top, Eve and Adam | 06/24/2024 | 07/18/2024 | Petroleum (Producing) | |
| PANW | Pipe bottom | 07/29/2024 | 08/05/2024 | Computer Software and Svcs | |
| PINC | Roof, inverted | 08/06/2024 | 08/15/2024 | Healthcare Information | |
| RGS | Pipe top | 07/22/2024 | 07/29/2024 | Toiletries/Cosmetics | |
| SEE | Double Top, Eve and Adam | 07/31/2024 | 08/08/2024 | Packaging and Container | |
| TREX | Double Top, Eve and Eve | 07/18/2024 | 07/31/2024 | Building Materials |
![]()
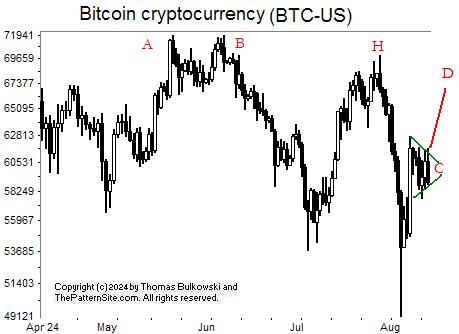
I show a picture of the cryptocurrency bitcoin (BTC-USD) on the daily scale.
$ $ $
Peaks AB mark a nice looking double top chart pattern. It confirms as a valid chart pattern when the currency closes below the valley between the two peaks. After that, the currency continued dropping.
Twin peaks, H, forms a horn top on the daily scale (it performs best on the weekly scale). The horn saw price tumble about $20,000. Ouch.
Recently at C, we see a pennant. If we see an upward breakout from the pennant, then look for the currency to rise to D, mirroring the upward move of the flagpole leading to the pennant. Don't expect the move to D to match the flagpole length, though.
$ $ $
Here's a symbol list of 154 chart and candlestick patterns (13 "investment grade" candle patterns) found in today's securities using my version of Patternz: DDD, ANF, AXDX, AFL, ATSG, AKAM, ALGT, AEO, AEP, AXP, AFG, AMN, APH, AON, ACGL, ASH, ADSK, AVNT, BALL, BAH, BFH, BMY, BLDR, CBT, CDNS, CE, CNC, CF, CTAS, CGNX, CONN, COP, CROX, CCRN, CTS, CMI, DECK, XRAY, DVN, FANG, DDS, EOG, EPAM, EG, EVRG, EXC, EXPD, EZPW, FICO, FDX, FIS, FTV, FWRD, GILD, GPN, GFS, HAYN, HTLD, HELE, HON, HUBG, IBP, IPG, KBH, K, LZB, LEN, LOW, MHO, MTSI, MRO, MTRN, MRCY, MU, MS, MLI, MYGN, NBR, NI, NWPX, NOVT, NTNX, OXY, ASGN, ON, OTEX, PANW, PGR, PHM, PSTG, KWR, RL, RLI, ROP, R, SBH, SIGI, SHW, SKYW, SMAR, SR, SXI, SCS, SRDX, TDOC, TTD, TJX, TOL, TRV, TZOO, UIS, VFC, VRTX, VC, WMT, WAT, WERN, WU, WEX, WSM, WOLF, WWW, WDAY, IHE, IEV, IGV, EWO, EWZ, EWQ, EWG, EIS, EWI, EWM, EWW, EWS, EZA, EWP, EWL, PPA, XAR, UNG, USO. Click this link for details (pattern type, start and end dates).
For a list of small patterns (those a few days wide) click this link.
$ $ $
The following table shows where Fibonacci retrace values of the day's high-low range are plus pivot points, calculated on the Nasdaq composite, sorted by value. When several are near each other (small differences), the area might act as support or resistance.
-- Thomas Bulkowski
![]()
| © 2024 ThePatternSite.com Metric | Value | Diff | Close (within 10% of the high-low range for the day)? |
| Monthly S2 | 14,228.21 | ||
| Weekly S2 | 15,482.77 | 1,254.57 | |
| Monthly S1 | 15,710.40 | 227.63 | |
| Weekly S1 | 16,337.69 | 627.28 | |
| Weekly Pivot | 16,563.45 | 225.77 | |
| Daily S2 | 16,933.27 | 369.82 | |
| Low | 17,032.17 | 98.90 | |
| Daily S1 | 17,062.94 | 30.77 | |
| 61.8% Down from Intraday High | 17,119.48 | 56.54 | |
| 50% Down from Intraday High | 17,146.45 | 26.97 | |
| Daily Pivot | 17,161.83 | 15.38 | Yes! The Daily Pivot is close to the 50% Down from Intraday High. |
| 38.2% Down from Intraday High | 17,173.42 | 11.59 | Yes! The 38.2% Down from Intraday High is close to the Daily Pivot. |
| Monthly Pivot | 17,190.74 | 17.32 | Yes! The Monthly Pivot is close to the 38.2% Down from Intraday High. |
| Close | 17,192.60 | 1.86 | Yes! The Close is close to the Monthly Pivot. |
| Open | 17,227.64 | 35.04 | |
| High | 17,260.73 | 33.09 | |
| Daily R1 | 17,291.50 | 30.77 | |
| Daily R2 | 17,390.39 | 98.90 | |
| Weekly R1 | 17,418.37 | 27.97 | |
| Weekly R2 | 17,644.13 | 225.77 | |
| Monthly R1 | 18,672.93 | 1,028.80 | |
| Monthly R2 | 20,153.27 | 1,480.33 |
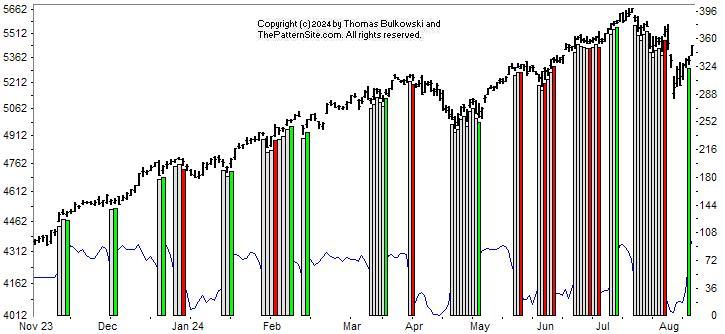
This is a picture of the chart pattern indicator on the daily scale. The indicator is the line chart below a chart of the S&P 500 composite.
The CPI indicator has turned bullish as the green bar on the far right of the chart shows.
This comes after remaining neutral as the index dropped for more than a week before turning bearish a day before the index started its big plunge.
Here's the same chart showing the indicator. Notice the spike higher to 98 today (Tuesday).
Keep in mind that readings can change for up to a week. If the index were to dive again, the green bar (in the prior chart) would likely disappear.
The two red lines show the outline of a chart pattern called a descending broadening wedge. Those breakout upward 72% of the time, so that's the way to bet. In other words, look for the uptrend to continue. The index might touch the top red trendline and drop.
$ $ $
Here's a symbol list of 136 chart and candlestick patterns (13 "investment grade" candle patterns) found in today's securities using my version of Patternz: DDD, ANF, AXDX, ATSG, AMED, AEE, AEO, AEP, AME, AMN, APH, ADSK, AVNT, BECN, BIO, BIIB, BKNG, BRC, BFH, BMY, BLDR, CBT, CDNS, CLS, CNC, CF, CTSH, CONN, COP, CMI, DECK, DVN, FANG, DDS, ^DJU, D, DTE, DUK, BOOM, EOG, EVRG, EXC, FIS, FLEX, FWRD, FCX, IT, GPN, GPRO, HL, HON, IRM, JNJ, KELYA, KMB, LHX, LRCX, LEG, MTSI, MRO, MTRN, META, MGEE, MSFT, ^IXIC, NEE, NKE, NI, JWN, NOVT, NTNX, NVDA, OXY, ASGN, OTEX, ORCL, PANW, PEN, PFE, PSTG, REGN, RHI, RCKY, RES, ^GSPC, SBH, SAND, SAIC, SRE, SMAR, SSYS, SRDX, TFX, TTD, TZOO, VFC, WAT, XEL, IYC, IHE, FTEC, QTEC, FXL, QQQ, IHF, IGV, IXN, EWA, EWO, EWK, EWG, EWH, EIS, EWM, EPP, EZA, EWL, THD, EWU, QLD, SSO, XLV, SPY, XLK, UNG, USO, MGK, VONG. Click this link for details (pattern type, start and end dates).
For a list of small patterns (those a few days wide) click this link.
-- Thomas Bulkowski
-- Thomas Bulkowski, author:
![]()
$ $ $
I show another slider trading quiz featuring York Water: YORW.
$ $ $
Here's a symbol list of 157 chart and candlestick patterns (13 "investment grade" candle patterns) found in today's securities using my version of Patternz: AXDX, AEIS, AMED, AFG, AIG, AMWD, ANIK, APA, APOG, ADM, AWI, AXS, BZH, BMRN, BAH, BRC, BFH, CAL, CNC, CENX, CF, CNA, CNO, CNX, CMCO, CMTL, CONN, CRH, CROX, CCRN, CSGS, XRAY, ^DJI, BOOM, EBAY, ELV, EOG, EPAM, EG, EVRG, EXPD, FFIV, FICO, FAST, FTV, FWRD, FDP, FRD, GE, GIS, GNW, GL, GES, HIG, HE, HTLD, HD, HON, HOV, HUM, ITW, INCY, IIIN, IPG, JBLU, JNJ, KBH, LNC, LMT, L, MHO, MGY, MAN, MCHX, MRK, MGEE, MOS, NBR, NOV, JWN, NUS, OMC, ON, OTEX, PTEN, PFE, PLXS, PFG, PRU, PHM, QTWO, DGX, RL, RRC, RGS, RLI, SBH, SCHW, SEE, SCI, SKX, SR, TPR, TRGP, TPX, TXT, TKR, TRV, TZOO, TG, TREX, UNH, VFC, VLO, VMI, VEEV, WAT, WERN, WU, WEX, WWW, IHE, DDM, FXI, IYH, IAT, IGE, IEO, IYF, EWZ, EWM, EWW, TUR, PPA, XLY, XLF, GLD, XLV, XLI, XRT, USO, VHT. Click this link for details (pattern type, start and end dates).
For a list of small patterns (those a few days wide) click this link.
$ $ $
The following table shows where Fibonacci retrace values of the day's high-low range are plus pivot points, calculated on the Dow industrials, sorted by value. When several are near each other (small differences), the area might act as support or resistance.
-- Thomas Bulkowski
![]()
| © 2024 ThePatternSite.com Metric | Value | Diff | Close (within 10% of the high-low range for the day)? |
| Monthly S2 | 36,867.36 | ||
| Weekly S2 | 38,032.26 | 1,164.89 | |
| Monthly S1 | 38,112.19 | 79.93 | |
| Weekly S1 | 38,694.63 | 582.45 | |
| Daily S2 | 39,063.26 | 368.63 | |
| Weekly Pivot | 39,161.65 | 98.39 | |
| Daily S1 | 39,210.13 | 48.48 | |
| Low | 39,251.72 | 41.59 | |
| Close | 39,357.01 | 105.29 | |
| 61.8% Down from Intraday High | 39,379.82 | 22.81 | Yes! The 61.8% Down from Intraday High is close to the Close. |
| Daily Pivot | 39,398.60 | 18.78 | Yes! The Daily Pivot is close to the 61.8% Down from Intraday High. |
| 50% Down from Intraday High | 39,419.39 | 20.79 | Yes! The 50% Down from Intraday High is close to the Daily Pivot. |
| 38.2% Down from Intraday High | 39,458.96 | 39.57 | |
| Daily R1 | 39,545.47 | 86.51 | |
| Open | 39,556.01 | 10.54 | Yes! The Open is close to the Daily R1. |
| High | 39,587.06 | 31.05 | Yes! The High is close to the Open. |
| Daily R2 | 39,733.94 | 146.88 | |
| Monthly Pivot | 39,744.09 | 10.16 | Yes! The Monthly Pivot is close to the Daily R2. |
| Weekly R1 | 39,824.02 | 79.93 | |
| Weekly R2 | 40,291.04 | 467.01 | |
| Monthly R1 | 40,988.92 | 697.88 | |
| Monthly R2 | 42,620.82 | 1,631.91 |
$ $ $
I show another slider trading quiz featuring York Water: YORW.
$ $ $
Here's a symbol list of 157 chart and candlestick patterns (13 "investment grade" candle patterns) found in today's securities using my version of Patternz: AXDX, AEIS, AMED, AFG, AIG, AMWD, ANIK, APA, APOG, ADM, AWI, AXS, BZH, BMRN, BAH, BRC, BFH, CAL, CNC, CENX, CF, CNA, CNO, CNX, CMCO, CMTL, CONN, CRH, CROX, CCRN, CSGS, XRAY, ^DJI, BOOM, EBAY, ELV, EOG, EPAM, EG, EVRG, EXPD, FFIV, FICO, FAST, FTV, FWRD, FDP, FRD, GE, GIS, GNW, GL, GES, HIG, HE, HTLD, HD, HON, HOV, HUM, ITW, INCY, IIIN, IPG, JBLU, JNJ, KBH, LNC, LMT, L, MHO, MGY, MAN, MCHX, MRK, MGEE, MOS, NBR, NOV, JWN, NUS, OMC, ON, OTEX, PTEN, PFE, PLXS, PFG, PRU, PHM, QTWO, DGX, RL, RRC, RGS, RLI, SBH, SCHW, SEE, SCI, SKX, SR, TPR, TRGP, TPX, TXT, TKR, TRV, TZOO, TG, TREX, UNH, VFC, VLO, VMI, VEEV, WAT, WERN, WU, WEX, WWW, IHE, DDM, FXI, IYH, IAT, IGE, IEO, IYF, EWZ, EWM, EWW, TUR, PPA, XLY, XLF, GLD, XLV, XLI, XRT, USO, VHT. Click this link for details (pattern type, start and end dates).
For a list of small patterns (those a few days wide) click this link.
$ $ $
The following table shows where Fibonacci retrace values of the day's high-low range are plus pivot points, calculated on the Dow industrials, sorted by value. When several are near each other (small differences), the area might act as support or resistance.
-- Thomas Bulkowski
![]()
| © 2024 ThePatternSite.com Metric | Value | Diff | Close (within 10% of the high-low range for the day)? |
| Monthly S2 | 36,867.36 | ||
| Weekly S2 | 38,032.26 | 1,164.89 | |
| Monthly S1 | 38,112.19 | 79.93 | |
| Weekly S1 | 38,694.63 | 582.45 | |
| Daily S2 | 39,063.26 | 368.63 | |
| Weekly Pivot | 39,161.65 | 98.39 | |
| Daily S1 | 39,210.13 | 48.48 | |
| Low | 39,251.72 | 41.59 | |
| Close | 39,357.01 | 105.29 | |
| 61.8% Down from Intraday High | 39,379.82 | 22.81 | Yes! The 61.8% Down from Intraday High is close to the Close. |
| Daily Pivot | 39,398.60 | 18.78 | Yes! The Daily Pivot is close to the 61.8% Down from Intraday High. |
| 50% Down from Intraday High | 39,419.39 | 20.79 | Yes! The 50% Down from Intraday High is close to the Daily Pivot. |
| 38.2% Down from Intraday High | 39,458.96 | 39.57 | |
| Daily R1 | 39,545.47 | 86.51 | |
| Open | 39,556.01 | 10.54 | Yes! The Open is close to the Daily R1. |
| High | 39,587.06 | 31.05 | Yes! The High is close to the Open. |
| Daily R2 | 39,733.94 | 146.88 | |
| Monthly Pivot | 39,744.09 | 10.16 | Yes! The Monthly Pivot is close to the Daily R2. |
| Weekly R1 | 39,824.02 | 79.93 | |
| Weekly R2 | 40,291.04 | 467.01 | |
| Monthly R1 | 40,988.92 | 697.88 | |
| Monthly R2 | 42,620.82 | 1,631.91 |
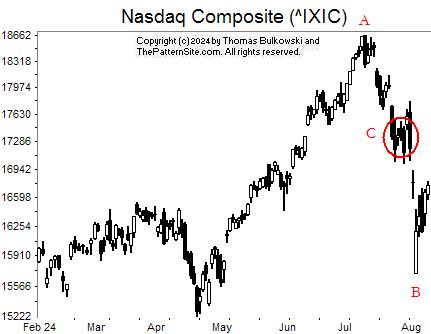
The index made a high at A and a low at B. How long will it take to make a new high (a rise above A)?
When I was writing/researching my latest edition of the Encyclopedia of Chart Patterns, 3rd Edition, I found that recoveries take twice as long as declines. To put it another way, you can lose money fast in the market but getting it back takes time.
The peak in the Nasdaq happened on 11 July and the low was on 5 August for a span of 25 days, or 26 if we include one end point. That means we'll be making new highs on Monday September 2. Right?
Not so fast. Thee's a knot of resistance, circled (C), in the way. It'll take time to push through that.
Of course, the number is just an average and there was a lot of variation in the results. My guess is that even if the FED reduces interest rates one to three times this year, the recovery will take a lot longer than about a month.
A lot of peopler were scared out of the market by this recent correction. Having them realize they made a mistake will take time. They'll buy back in at a higher price than where they sold, doing the exact opposite of what you should do.
Maybe come this January, we'll be making new highs.
$ $ $
I released a new study saying that tall bars and gaps influence the success of chart patterns but the performance difference is too small to notice.
$ $ $
![]()
The following is a brief review of how the markets performed over time. The numbers refer to the close-to-close move in the Dow industrials.
Many options expire this week, so traders will be looking to close out their positions, and that suggests increased volatility (large daily price swings).
![]()
The following is based on an SFO article in December 2004 by John Seekinger, titled, "Take a two-dimensional approach." He offers these tips.
| Index | S2 | S1 | Pivot | R1 | R2 |
| Dow Industrials (^DJI): Daily | 39,054 | 39,276 | 39,452 | 39,674 | 39,850 |
| Weekly | 38,079 | 38,788 | 39,208 | 39,918 | 40,338 |
| Monthly | 36,914 | 38,206 | 39,791 | 41,083 | 42,668 |
| S&P500 (^GSPC): Daily | 5,277 | 5,310 | 5,335 | 5,368 | 5,392 |
| Weekly | 5,035 | 5,189 | 5,274 | 5,429 | 5,513 |
| Monthly | 4,827 | 5,086 | 5,378 | 5,636 | 5,928 |
| Nasdaq (^IXIC): Daily | 16,488 | 16,617 | 16,703 | 16,831 | 16,918 |
| Weekly | 15,334 | 16,039 | 16,414 | 17,120 | 17,495 |
| Monthly | 14,079 | 15,412 | 17,042 | 18,375 | 20,004 |
Here are the formulas:
![]()
Earnings season is either underway or should be starting soon. The sessions could be more volatile.
Here's a symbol list of 87 chart and candlestick patterns (13 "investment grade" candle patterns) found in today's securities using my version of Patternz: AXDX, AFG, AIG, AMWD, APA, APOG, AWI, ASH, BFH, CAL, CNC, CMCO, CONN, XRAY, EPAM, EVRG, EVH, EXPD, FIS, FIVN, FWRD, GE, GNW, GPRO, GES, HAYN, HTLD, HELE, HOV, HUBG, HURC, ITW, INCY, IIIN, PODD, RAMP, MHO, MGY, MAN, MAS, MTRX, NBR, NOV, NWL, OLN, PTEN, PFE, PLXS, PINC, RL, REGN, RGS, SBH, SEE, NOW, SHW, SR, SNPS, TDOC, TTD, TKR, TRV, TG, TREX, UHAL, UGI, UNM, VFC, VLO, VMI, MDRX, VRSN, WAT, WERN, WMB, XEL, DDM, ILF, EWK, EWZ, ECH, EWM, EWT. Click this link for details (pattern type, start and end dates).
For a list of small patterns (those a few days wide) click this link.
The below industries were the best (rank 1) or worst performing of those I follow.
|
-- Thomas Bulkowski
![]()
$ $ $
Here's a symbol list of 124 chart and candlestick patterns (13 "investment grade" candle patterns) found in today's securities using my version of Patternz: AXDX, AYI, ATSG, DOX, AFG, AIG, AMWD, APA, APOG, AMAT, AWI, ARW, AGO, ADP, BMI, BECN, BFH, CACI, CAL, CPB, CNC, CF, CLNE, CTSH, CMCO, CONN, CRH, CSGS, XRAY, FANG, ELV, EPAM, EVH, EXPD, EZPW, FRD, GE, GNW, GL, GOOGL, GES, HBI, HTLD, HOV, HURC, IDA, ITW, INCY, IIIN, K, KMT, KFRC, KLAC, LRCX, RAMP, L, MHO, MTSI, MGY, MAN, MGEE, NBR, NOV, NWPX, OXY, ASGN, ON, ORCL, PTEN, PFE, PLXS, PSTG, QCOM, DGX, RTX, RGS, ROST, SBH, SAIC, SEE, SRE, TER, TKR, TRV, TREX, UGI, VLO, VMI, V, WMT, WAT, WERN, IEZ, IHE, DDM, FXL, FXI, QQQ, IYH, IYZ, SOXX, SLV, EWQ, EWG, EWH, EIS, EWM, EWS, THD, EWU, QLD, PBE, PJP, XLP, XLV, VHT. Click this link for details (pattern type, start and end dates).
For a list of small patterns (those a few days wide) click this link.
$ $ $
You can find setups based on a Fibonacci retrace by clicking on the link.
The following patterns were found manually, not using Patternz. Mr. Bulkowski has excluded any securities he owns from appearing in the list. However, he may add any of the securities listed to his portfolio at any time, just as you can.
In the table below, the red and green colors are based on the historical breakout direction for the associated chart pattern. If a high and tight flag appears, the start and end dates highlight the flagpole only and not the flag.
For details about the chart patterns, click here.
-- Thomas Bulkowski, author: Invest for Two-Comma Wealth and the novel (fiction), Foresight (#Ad)
![]()
| Symbol | Chart Pattern | Bullish Bearish | Start | End | Industry |
| ACN | Triple top | 07/18/2024 | 08/01/2024 | IT Services | |
| AYI | Triple top | 04/03/2024 | 07/16/2024 | Furn/Home Furnishings | |
| AEIS | Double Top, Adam and Adam | 07/16/2024 | 07/31/2024 | Semiconductor | |
| ATSG | Double Top, Eve and Eve | 07/16/2024 | 07/31/2024 | Air Transport | |
| AXP | Double Top, Eve and Eve | 07/18/2024 | 07/31/2024 | Financial Services | |
| AFG | Horn top | 07/15/2024 | 07/29/2024 | Insurance (Prop/Casualty) | |
| AIG | Horn top | 07/15/2024 | 07/29/2024 | Insurance (Prop/Casualty) | |
| AMWD | Pipe top | 07/22/2024 | 07/29/2024 | Building Materials | |
| APA | Horn top | 07/15/2024 | 07/29/2024 | Petroleum (Producing) | |
| APOG | Pipe top | 07/22/2024 | 07/29/2024 | Building Materials | |
| ATR | Diamond top | 07/15/2024 | 08/08/2024 | Packaging and Container | |
| AWI | Pipe top | 07/22/2024 | 07/29/2024 | Building Materials | |
| ASH | Triple top | 07/17/2024 | 07/31/2024 | Chemical (Basic) | |
| AGO | Double Top, Eve and Eve | 07/17/2024 | 07/29/2024 | Insurance (Life) | |
| BECN | Double Top, Adam and Eve | 07/17/2024 | 07/31/2024 | Retail Building Supply | |
| BKH | Triple top | 07/17/2024 | 07/31/2024 | Electric Utility (West) | |
| BA | Broadening top | 07/01/2024 | 07/31/2024 | Aerospace/Defense | |
| BFH | Pipe top | 07/22/2024 | 07/29/2024 | Information Services | |
| CX | Pipe top | 07/08/2024 | 07/15/2024 | Cement and Aggregates | |
| CVX | Double Top, Adam and Adam | 07/18/2024 | 07/31/2024 | Petroleum (Integrated) | |
| CSCO | Double Top, Adam and Adam | 07/17/2024 | 07/31/2024 | Computers and Peripherals | |
| CLF | Head-and-shoulders top | 07/03/2024 | 07/24/2024 | Metals and Mining (Div.) | |
| CMCO | Pipe top | 07/22/2024 | 07/29/2024 | Machinery | |
| CMTL | Double Top, Eve and Eve | 07/12/2024 | 07/29/2024 | Telecom. Equipment | |
| CAG | Ugly double bottom | 07/11/2024 | 07/23/2024 | Food Processing | |
| CTS | Double Top, Adam and Adam | 07/17/2024 | 07/23/2024 | Electronics | |
| XRAY | Horn top | 07/15/2024 | 07/29/2024 | Medical Supplies | |
| ^DJT | Double Top, Adam and Adam | 07/16/2024 | 08/01/2024 | None | |
| ^DJI | Double Top, Adam and Adam | 07/18/2024 | 07/31/2024 | None | |
| EPAM | Double Top, Adam and Adam | 07/18/2024 | 08/01/2024 | IT Services | |
| EXPD | Pipe top | 07/22/2024 | 07/29/2024 | Air Transport | |
| FAST | Double Top, Adam and Eve | 07/18/2024 | 07/31/2024 | Retail Building Supply | |
| FIS | Multi-peaks | 05/20/2024 | 08/08/2024 | Computer Software and Svcs | |
| FLEX | Double Top, Eve and Adam | 05/30/2024 | 07/24/2024 | Electronics | |
| FLS | Double Top, Eve and Eve | 07/18/2024 | 07/30/2024 | Machinery | |
| FNV | Double Top, Adam and Eve | 07/17/2024 | 07/31/2024 | Metals and Mining (Div.) | |
| FCX | Head-and-shoulders complex top | 04/12/2024 | 07/12/2024 | Metals and Mining (Div.) | |
| GS | Double Top, Adam and Adam | 07/17/2024 | 07/31/2024 | Securities Brokerage | |
| GFF | Dead-cat bounce | 08/07/2024 | 08/07/2024 | Building Materials | |
| HE | Dead-cat bounce | 07/22/2024 | 07/22/2024 | Electric Utility (West) | |
| HQY | Double Top, Adam and Adam | 07/17/2024 | 07/26/2024 | Healthcare Information | |
| HP | Double Top, Adam and Adam | 07/17/2024 | 07/25/2024 | Petroleum (Producing) | |
| HSIC | Double Top, Adam and Eve | 07/18/2024 | 08/02/2024 | Medical Supplies | |
| HD | Double Top, Adam and Adam | 07/17/2024 | 07/31/2024 | Retail Building Supply | |
| HOV | Pipe top | 07/22/2024 | 07/29/2024 | Homebuilding | |
| HUBG | Double Top, Adam and Adam | 07/17/2024 | 08/01/2024 | Trucking/Transp. Leasing | |
| HUN | Double Top, Adam and Adam | 07/17/2024 | 07/31/2024 | Chemical (Specialty) | |
| ITW | Horn top | 07/15/2024 | 07/29/2024 | Metal Fabricating | |
| INCY | Pipe top | 07/22/2024 | 07/29/2024 | Drug | |
| IIIN | Pipe top | 07/29/2024 | 07/29/2024 | Building Materials | |
| INTC | Dead-cat bounce | 08/02/2024 | 08/02/2024 | Semiconductor | |
| IBKR | Double Top, Eve and Adam | 05/28/2024 | 07/03/2024 | Securities Brokerage | |
| KLAC | Double Top, Adam and Adam | 06/18/2024 | 07/11/2024 | Semiconductor Cap Equip. | |
| LHX | Double Top, Adam and Adam | 07/17/2024 | 07/25/2024 | Aerospace/Defense | |
| RAMP | Dead-cat bounce | 08/08/2024 | 08/08/2024 | Computer Software and Svcs | |
| MHO | Pipe top | 07/22/2024 | 07/29/2024 | Homebuilding | |
| MGY | Double Top, Adam and Adam | 07/18/2024 | 08/01/2024 | Petroleum (Producing) | |
| MAN | Double Top, Adam and Adam | 07/18/2024 | 07/31/2024 | Human Resources | |
| MRO | Triple top | 05/29/2024 | 07/18/2024 | Petroleum (Integrated) | |
| MRK | Three Falling Peaks | 06/25/2024 | 07/26/2024 | Drug | |
| MUR | Head-and-shoulders top | 06/28/2024 | 07/31/2024 | Petroleum (Integrated) | |
| NBR | Pipe top | 07/22/2024 | 07/29/2024 | Oilfield Svcs/Equipment | |
| NOV | Pipe top | 07/22/2024 | 07/29/2024 | Oilfield Svcs/Equipment | |
| OLN | Head-and-shoulders top | 01/26/2024 | 05/15/2024 | Chemical (Basic) | |
| ASGN | Pipe top | 07/15/2024 | 07/22/2024 | Human Resources | |
| PKE | Pipe top | 07/08/2024 | 07/15/2024 | Chemical (Specialty) | |
| PDCO | Double Top, Adam and Adam | 07/18/2024 | 07/30/2024 | Medical Supplies | |
| PTEN | Double Top, Adam and Adam | 07/17/2024 | 07/31/2024 | Oilfield Svcs/Equipment | |
| POR | Double Top, Eve and Adam | 07/25/2024 | 08/02/2024 | Electric Utility (West) | |
| PPL | Falling wedge | 05/29/2024 | 07/10/2024 | Electric Utility (East) | |
| ROK | Head-and-shoulders top | 06/28/2024 | 07/31/2024 | Diversified Co. | |
| RGLD | Triple top | 07/17/2024 | 08/02/2024 | Metals and Mining (Div.) | |
| CRM | Double Top, Adam and Eve | 07/05/2024 | 07/29/2024 | E-Commerce | |
| SBH | Horn top | 07/15/2024 | 07/29/2024 | Toiletries/Cosmetics | |
| SLB | Pipe top | 07/15/2024 | 07/22/2024 | Oilfield Svcs/Equipment | |
| STR | Head-and-shoulders top | 07/03/2024 | 07/31/2024 | Natural Gas (Diversified) | |
| SWX | Double Top, Adam and Eve | 07/17/2024 | 07/26/2024 | Natural Gas (Distributor) | |
| SXI | Triple top | 07/17/2024 | 07/31/2024 | Diversified Co. | |
| TPR | Double Top, Eve and Adam | 06/03/2024 | 07/12/2024 | Apparel | |
| TPX | Double Top, Adam and Eve | 07/18/2024 | 07/31/2024 | Furn/Home Furnishings | |
| TXT | Double Top, Eve and Adam | 07/18/2024 | 07/31/2024 | Diversified Co. | |
| TKR | Double Top, Adam and Adam | 07/18/2024 | 07/31/2024 | Metal Fabricating | |
| TSCO | Head-and-shoulders top | 05/20/2024 | 07/16/2024 | Retail Building Supply | |
| TREX | Horn top | 07/15/2024 | 07/29/2024 | Building Materials | |
| UGI | Double Top, Adam and Eve | 07/18/2024 | 08/01/2024 | Natural Gas (Distributor) | |
| VC | Double Top, Eve and Eve | 07/18/2024 | 07/31/2024 | Electronics | |
| WMT | Head-and-shoulders top | 07/10/2024 | 08/02/2024 | Retail Store | |
| WU | Double Top, Adam and Adam | 07/17/2024 | 07/30/2024 | Financial Services | |
| WWW | Pipe top | 07/22/2024 | 07/29/2024 | Shoe | |
| WDAY | Diamond top | 07/03/2024 | 07/31/2024 | Computer Software and Svcs | |
| FDN | Triple top | 04/11/2024 | 07/05/2024 | Internet | |
| MGK | Head-and-shoulders top | 03/08/2024 | 04/11/2024 | None |
![]()
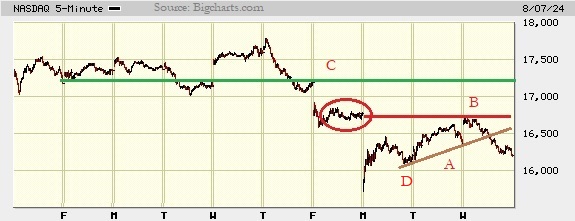
I show a picture of the Nasdaq composite on the 5-minute scale.
$ $ $
At line A, the index followed the trendline until bearish selling pushed the index lower today.
On the daily scale, it appears that the index might be trying to make a second bottom in the coming days. I still don't think it'll drop below the low posted on Monday, but it's possible. My guess is we'll head lower, but turn perhaps at D or slightly below that.
If the index rises, then look for resistance at line B. That resistance forms in the horizontal move I show circled.
Once we pass above that line, look for more resistance at green line C. On Friday and Monday (a week ago), the index move horizontally to slightly upward. I connected the line and forecast it to the right. It lines up with Friday's close, near C.
$ $ $
Here's a symbol list of 251 chart and candlestick patterns (13 "investment grade" candle patterns) found in today's securities using my version of Patternz: MMM, ANF, AXDX, AYI, ADBE, ADTN, AEIS, A, ATSG, ALGT, AFG, AIG, AMWD, AMGN, AR, APA, APOG, ARCB, ANET, AWI, ASH, AVNT, AZTA, BMI, BCPC, BZH, BERY, BIG, BAH, BRC, BFH, BCO, CBT, CDNS, CAL, CE, CNC, CENX, CRL, CHKP, CTAS, CGNX, CMCO, CONN, GLW, COTY, CR, CCRN, CSGS, DECK, XRAY, DSGR, DOV, EXP, EMN, ECL, EMR, EPAM, EFX, EQT, EL, EVH, EXC, EXPD, FFIV, FDS, FDX, FIS, FLEX, FLS, FCX, GPS, GE, GIS, GNW, GPN, GMS, GPRO, GFF, GES, HBI, HLIT, HAYN, HTLD, HSII, HNI, HOLX, HD, DHI, HOV, HWM, HUBG, IDA, ITW, INCY, INFN, NSP, IBP, IIIN, IPAR, TILE, IPI, INTU, KBH, KELYA, KFRC, KLAC, KSS, LZB, LH, LAMR, LEG, LEN, LNC, LMT, LOW, MHO, MTSI, M, MGY, MANH, MAN, MKTX, MRTN, MLM, MAS, MRCY, MGEE, MLKN, MS, NBR, ^IXIC, NOV, NTAP, JWN, NWPX, NVDA, OLN, OMCL, ON, OR, OXM, PKE, PATK, PTEN, PETS, PLXS, PHM, PSTG, QTWO, QCOM, RL, RTX, RGS, ROK, ROL, ^GSPC, SAIA, SBH, SAND, SLB, SCHW, SAIC, SEE, SRE, SMTC, NOW, SKX, TPR, TECH, TDY, TFX, TDC, TER, TEVA, TKR, TJX, TOL, TSCO, TDG, TRV, TZOO, TREX, UHAL, VLO, VMI, VRTX, VMC, WMT, WAT, WERN, WSC, WWW, WWD, XEL, ITA, IYC, IEZ, DDM, FTEC, FDN, QTEC, FXL, QQQ, IYH, IAT, IGV, IXN, SLV, ITB, QLD, IBB, DBA, PXJ, PJP, PHO, SSO, XLY, XHB, XLB, XRT, SPY, XLK, SMH, VHT, VIS, VAW, MGK, VONG. Click this link for details (pattern type, start and end dates).
For a list of small patterns (those a few days wide) click this link.
$ $ $
The following table shows where Fibonacci retrace values of the day's high-low range are plus pivot points, calculated on the Nasdaq composite, sorted by value. When several are near each other (small differences), the area might act as support or resistance.
-- Thomas Bulkowski, author: Invest for Two-Comma Wealth and the novel (fiction), Foresight" (#Ad)
![]()
| © 2024 ThePatternSite.com Metric | Value | Diff | Close (within 10% of the high-low range for the day)? |
| Monthly S2 | 15,061.61 | ||
| Monthly S1 | 15,628.71 | 567.10 | |
| Weekly S2 | 15,647.94 | 19.23 | Yes! The Weekly S2 is close to the Monthly S1. |
| Daily S2 | 15,831.44 | 183.50 | |
| Weekly S1 | 15,921.87 | 90.44 | |
| Daily S1 | 16,013.62 | 91.75 | |
| Low | 16,179.53 | 165.91 | |
| Close | 16,195.81 | 16.28 | Yes! The Close is close to the Low. |
| Daily Pivot | 16,361.72 | 165.91 | |
| 61.8% Down from Intraday High | 16,382.10 | 20.38 | Yes! The 61.8% Down from Intraday High is close to the Daily Pivot. |
| 50% Down from Intraday High | 16,444.67 | 62.57 | |
| 38.2% Down from Intraday High | 16,507.24 | 62.57 | |
| Daily R1 | 16,543.90 | 36.66 | Yes! The Daily R1 is close to the 38.2% Down from Intraday High. |
| Open | 16,622.31 | 78.41 | |
| High | 16,709.81 | 87.50 | |
| Weekly Pivot | 16,856.73 | 146.92 | |
| Daily R2 | 16,892.00 | 35.27 | Yes! The Daily R2 is close to the Weekly Pivot. |
| Weekly R1 | 17,130.66 | 238.67 | |
| Monthly Pivot | 17,149.89 | 19.23 | Yes! The Monthly Pivot is close to the Weekly R1. |
| Monthly R1 | 17,716.99 | 567.10 | |
| Weekly R2 | 18,065.52 | 348.53 | |
| Monthly R2 | 19,238.17 | 1,172.65 |
This is a picture of the chart pattern indicator on the daily scale. The indicator is the line chart below a chart of the S&P 500 composite.
After today's (Tuesday's) bounce, the CPI climbed from 0 to 25. That's still bearish, so the red bar on the far right of the chart remains.
I looked at the intraday chart of the Dow industrials and Nasdaq. In the last hour, the Dow tumbled about 300 points and the Nasdaq dropped about half that. To me, it suggests the indices will open lower tomorrow.
I don't expect them to drop below Monday's low, but they could. I'm hoping the recovery will continue.
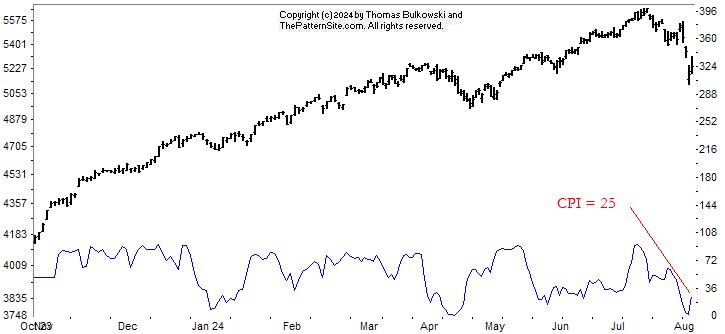
This shows the CPI line. To move into neutral territory, the CPI has to climb to 35. Bullish is a reading of 65.
$ $ $
Doug suggested I mention a trading setup using ugly double bottoms (a chart pattern) to bottom fish. See the associated link.
$ $ $
Here's a symbol list of 104 chart and candlestick patterns (13 "investment grade" candle patterns) found in today's securities using my version of Patternz: DDD, ABM, ADTN, ATSG, ALB, DOX, AFG, AIG, AMWD, AON, APA, APOG, ADM, AWI, AVA, AZTA, BAX, BIG, BFH, CAL, CNC, CVX, CNO, CMCO, CONN, CSGS, DHR, XRAY, BOOM, EPAM, EVH, EXPD, FIS, GE, GIS, GNW, GES, HBI, HTLD, HP, HSIC, HOV, ITW, INCY, IIIN, IPAR, INTU, LANC, LXU, MHO, MGY, MAN, MRCY, MLI, NBR, NOV, ASGN, PDCO, PTEN, PLXS, PPG, RTX, RGS, RCKY, SBH, SLB, SRE, NOW, SO, SCS, TGT, TDY, TFX, TDC, TXN, TKR, TSCO, TRV, TREX, UIS, VFC, VLO, VMI, VRSN, VMC, WAT, WERN, WWW, ITA, DDM, IYH, EWH, DBA, VHT. Click this link for details (pattern type, start and end dates).
For a list of small patterns (those a few days wide) click this link.
-- Thomas Bulkowski, author: Invest for Two-Comma Wealth (#Ad)
![]()
$ $ $
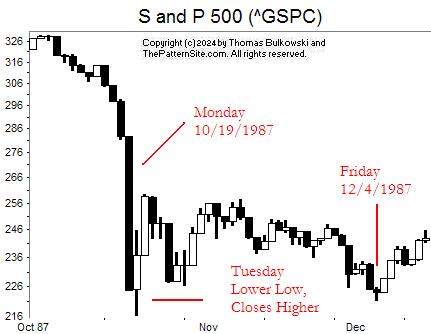
Let's dissect today's price action so we can know whether to panic or not, starting with a historical review.
We begin in 1987, October. On the 19th, the Dow industrials dropped 508 points or 22% from the prior close. In today's world, that's a drop of about 8,500 points.
Today (Monday), the Dow dropped only 1,000 points. A drop in the bucket. Nothing to worry about. Back in 1987, in just three days, the Dow dropped 31%, equivalent to about 12,000 points today.
Let's talk about the S&P 500 index.
Shown is a chart from that October 1987, showing the S&P. Notice that the big drop was on Monday. The next day, the index made a lower low, but closed higher. Three weeks later, we formed another bottom (a double bottom confirmed when the index climbed -- not shown). Will that happen again? (I'm thinking, Yes, because it will probably happen in October).
I expect the index to make a new low tomorrow, but close higher, just like it did in 1987. Let's see more ideas.
![]()
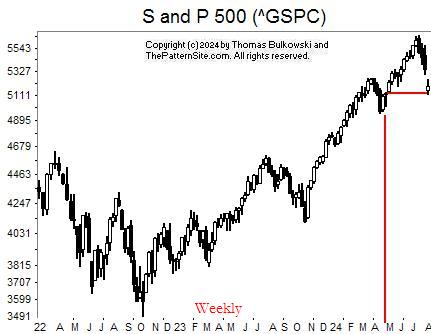
This is the S&P 500 index today, but on the weekly scale. I show this in case you're thinking of selling everything.
Selling is a rookie mistake. The drop from the July peak only takes us back to April. So you gave back a few months worth of gains. If you sell now, the market will spring back.
By the time you remember that you've a pile of cash sitting on the sidelines, waiting to be invested, it'll be too late. You'll be buying in at a much higher level.
What you don't want to do is sell low and buy high, which is what you'd likely be doing. Instead, consider buying now and selling higher, perhaps in December or January or even holding for the long term.
![]()
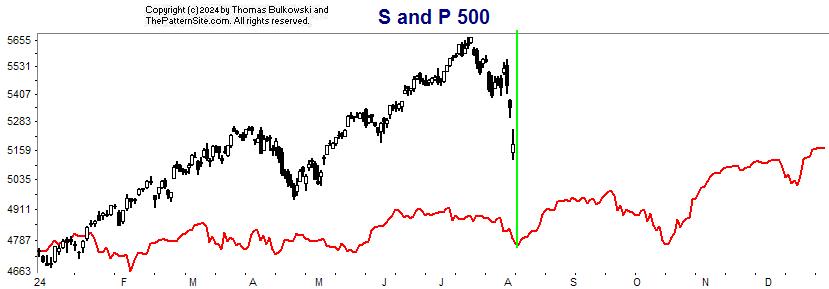
Near the start of each month, I update the 2024 forecast for the indices. This is the chart of the forecast as of today's (Monday's) close. Also notice that it forms a second bottom in October, which is what we saw back in 1987. Will history repeat? The month's are different (October to December 1987, versus August to October), of course, but the pattern is the same (if it recurs).
Notice the green vertical line. That marks the predicted low in the forecast and the index. It suggests tomorrow will be the low before a recovery.
If the index is going to rise, why sell now? Instead, you should be buying.
Remember each time you look at a long-term chart and say, "I wish I'd bought here." Now's your chance to buy the dip.
![]()
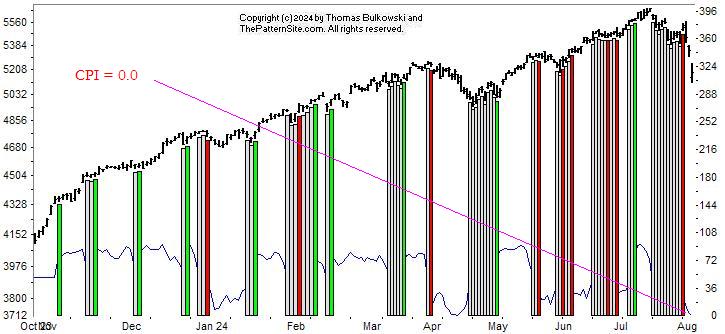
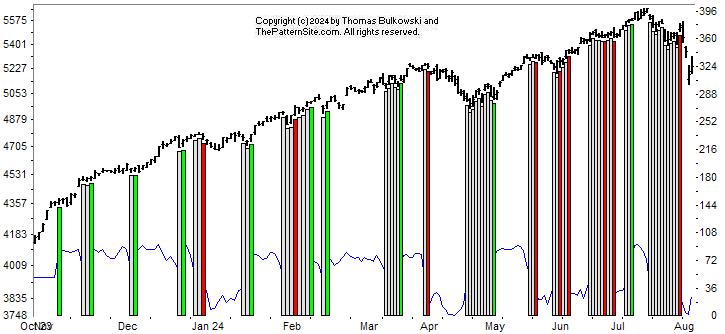
This is a picture of the CPI, which is the Chart Pattern Indicator, a forecasting tool I developed. The theory behind the indicator is that bearish patterns will appear at market tops and bullish ones will appear near market bottoms.
The scale is from 0 to 100. Today (Monday evening), the CPI reads 0. That's right. It's at the bottom of the scale (bearish). It can't go any lower, meaning it can only rise. The index might continue down, however, but it's expected to rise.
The CPI turned bearish on August 1, which is this past Thursday. By the way, red vertical bars on the chart are bearish, green ones are bullish, and white ones are neutral.
Nice timing, by the way.
![]()
Finally, this is a chart of today's price action.
Let's talk about gaps. Gap A is a breakaway gap because it breaks away from a congestion area (meaning it left an area where price moved sideways).
Gap B can be either of two types and it's unclear now which one it will be. It can be a continuation gap, which means the index is only midway in the move (with more to come).
Or, it can be an exhaustion gap. Exhaustion gaps can be quite tall (a large gap). The gap shown isn't that large. However, my guess is this is an exhaustion gap and not a continuation.
I think the index will make a lower low tomorrow, just on panic selling, but then the smart money will swoop in and push the index higher. It might even do that right from the open. As I write this, the futures are already pointing to a higher open on Tuesday (but that can change quickly enough).
Of course, all of this is just a guess. But the US and global markets are down on the US going into recession. With a possible expansion of the war in the Middle East, that won't be good for world markets. Balancing that is the Federal Reserve set to lower interest rates sometime between now and at the next meeting in September (which the markets will love, especially if it's by a half point. However, the markets may freak, too, thinking that the FED is worried of a recession, too).
I'm expecting a snap-back rally. That will happen if everyone buys near the open. It's a good time to do that. However, predicting what happens next is difficult at best, so I could be wrong about all of this.
One last item. At the top of this blog post is a prediction of how the Dow will do tomorrow. Slightly more than half the time, it closed higher after a large drop like we say today.
![]()
$ $ $
Here's a symbol list of 331 chart and candlestick patterns (13 "investment grade" candle patterns) found in today's securities using my version of Patternz: DDD, ABT, ABM, ADBE, ADTN, AEIS, ATSG, AKAM, ALRM, ALK, AA, ALKS, ALGT, ALL, AXP, AIG, AMN, AR, AON, APOG, ACGL, AWI, ASH, ADSK, ADP, AVNT, AXS, BMI, BCPC, BAX, BZH, BERY, BBY, BMRN, BAH, BSX, BFH, BCO, BR, BBW, BG, CBT, CDNS, CPB, CE, CNC, CENX, CHKP, CVX, CIEN, CI, CTAS, CLNE, CLF, CNO, CNX, CL, CMCO, CMTL, CAG, CONN, CXW, GLW, COTY, CR, CSGS, CTS, CW, XRAY, DDS, DFS, ^DJT, ^DJI, DOV, DRQ, BOOM, EMN, ELV, EPAM, EQT, EL, EXC, EXPD, FFIV, FARO, FDX, FIS, FISV, FIVN, FLS, FNV, FCX, FRD, GME, GPS, IT, GIS, GNW, GPN, GL, GS, GOOGL, GPRO, GGG, GES, HBI, HLIT, HQY, HL, HSII, HP, HNI, HOV, HWM, HUN, IIIN, ITGR, INTC, IPAR, IPG, IPI, INTU, KALU, K, KELYA, KEYS, KFRC, LHX, LZB, LAMR, RAMP, LPLA, LXU, M, MANH, MAN, MKTX, MTDR, MTRN, MTRX, MSFT, MLKN, MCO, MS, MOS, MUR, MYGN, NBR, ^IXIC, NOV, NTGR, NTAP, NEU, NWPX, NUS, OLN, OMCL, ASGN, ON, OTEX, ORCL, OR, OUT, OXM, PKE, PATK, PDCO, PTEN, PAYX, PYPL, PETS, PLXS, POR, PPG, PPL, PINC, PFG, PGR, PRU, PEG, PSTG, RRC, RCKY, ROG, ROST, RES, ^GSPC, SBH, SAND, SLB, SCHW, SAIC, SEE, SEIC, SIGI, STR, SKYW, SO, SCCO, LUV, SPSC, SCS, SSYS, TPR, TGT, TDY, TDC, TXN, TXT, TMO, TOL, TRV, TZOO, TG, UIS, UNM, VMI, VECO, VRSN, VC, VMC, WMT, WAT, WLK, WPM, WMB, WSC, WDAY, XEL, ITA, IYM, IAI, IYK, IYC, IYE, IEZ, IDU, DDM, FTEC, FDN, FXL, BOTZ, QQQ, IHF, IAT, IYZ, IEV, IGV, IXC, MXI, IXN, ILF, IGE, IEO, IYF, EWA, EWO, EWC, EEM, EWQ, EWG, EWI, EWW, EPP, EWS, EZA, EWY, EWP, EWD, EWL, EWT, THD, TUR, EWU, QLD, IBB, PPA, PBE, PXJ, PJP, PHO, SSO, ROBO, XLY, XLE, XLF, XLB, XRT, SPY, XAR, XLU, VAW, MGK, VONG. Click this link for details (pattern type, start and end dates).
For a list of small patterns (those a few days wide) click this link.
$ $ $
The following table shows where Fibonacci retrace values of the day's high-low range are plus pivot points, calculated on the Dow industrials, sorted by value. When several are near each other (small differences), the area might act as support or resistance.
-- Thomas Bulkowski, author: Invest for Two-Comma Wealth (#Ad)
![]()
| © 2024 ThePatternSite.com Metric | Value | Diff | Close (within 10% of the high-low range for the day)? |
| Monthly S2 | 37,367.68 | ||
| Weekly S2 | 37,913.58 | 545.90 | |
| Monthly S1 | 38,035.47 | 121.89 | |
| Daily S2 | 38,195.99 | 160.52 | |
| Weekly S1 | 38,308.42 | 112.43 | |
| Daily S1 | 38,449.63 | 141.21 | |
| Low | 38,499.27 | 49.64 | Yes! The Low is close to the Daily S1. |
| Close | 38,703.27 | 204.00 | |
| 61.8% Down from Intraday High | 38,712.01 | 8.74 | Yes! The 61.8% Down from Intraday High is close to the Close. |
| Daily Pivot | 38,752.91 | 40.90 | Yes! The Daily Pivot is close to the 61.8% Down from Intraday High. |
| 50% Down from Intraday High | 38,777.73 | 24.82 | Yes! The 50% Down from Intraday High is close to the Daily Pivot. |
| 38.2% Down from Intraday High | 38,843.45 | 65.71 | |
| Daily R1 | 39,006.55 | 163.11 | |
| Open | 39,056.19 | 49.64 | Yes! The Open is close to the Daily R1. |
| High | 39,056.19 | 0.00 | Yes! The High is close to the Open. |
| Daily R2 | 39,309.83 | 253.64 | |
| Monthly Pivot | 39,705.74 | 395.91 | |
| Weekly Pivot | 39,753.53 | 47.79 | Yes! The Weekly Pivot is close to the Monthly Pivot. |
| Weekly R1 | 40,148.38 | 394.85 | |
| Monthly R1 | 40,373.54 | 225.16 | |
| Weekly R2 | 41,593.48 | 1,219.94 | |
| Monthly R2 | 42,043.80 | 450.32 |
![]()
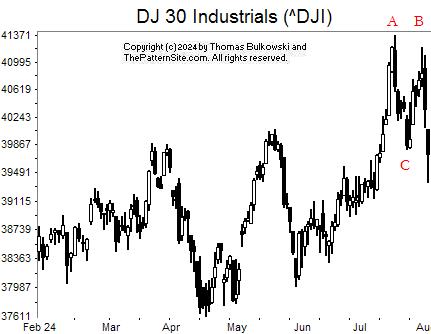
This is a chart of the Dow industrials on the daily scale.
Friday showed a lot of blood on the ledger. The Dow lost 610 points or 1.5% but the Nasdaq got hammered. It lost 418 point or 2.4%. My tech-heavy portfolio felt the pain.
The chart shows a confirmed double top at AB.
'Confirmed' means the index closed below the lowest valley between peaks AB. That happened at C.
This bearish pattern, now valid, suggests a continued decline. That matches the 2024 forecast, which shows weakness going into the start of August. However, we should get a nice bounce later next week.
![]()
The following is a brief review of how the markets performed over time. The numbers refer to the close-to-close move in the Dow industrials.
No options expire this week.
![]()
The following is based on an SFO article in December 2004 by John Seekinger, titled, "Take a two-dimensional approach." He offers these tips.
| Index | S2 | S1 | Pivot | R1 | R2 |
| Dow Industrials (^DJI): Daily | 39,007 | 39,372 | 39,724 | 40,089 | 40,440 |
| Weekly | 38,258 | 38,998 | 40,098 | 40,838 | 41,938 |
| Monthly | 37,712 | 38,725 | 40,050 | 41,063 | 42,388 |
| S&P500 (^GSPC): Daily | 5,262 | 5,304 | 5,344 | 5,386 | 5,426 |
| Weekly | 5,141 | 5,244 | 5,405 | 5,508 | 5,669 |
| Monthly | 5,072 | 5,209 | 5,439 | 5,577 | 5,807 |
| Nasdaq (^IXIC): Daily | 16,422 | 16,599 | 16,760 | 16,937 | 17,098 |
| Weekly | 15,841 | 16,309 | 17,050 | 17,518 | 18,259 |
| Monthly | 15,255 | 16,016 | 17,343 | 18,104 | 19,432 |
Here are the formulas:
![]()
Earnings season is either underway or should be starting soon. The sessions could be more volatile.
Here's a symbol list of 234 chart and candlestick patterns (13 "investment grade" candle patterns) found in today's securities using my version of Patternz: DDD, ANF, ATSG, ALK, AA, ALGT, ALL, AMZN, AIG, AME, APOG, AMAT, ARCB, AGO, BMI, BCPC, BERY, BBY, BKNG, BOOT, BSX, BBW, BG, CBT, CDNS, CAL, CE, CLS, CX, CNC, CENX, CVX, CIEN, CSCO, CLX, CNO, CTSH, CONN, CXW, CTS, CMI, DVN, FANG, DDS, ^DJT, ^DJI, DOV, ELV, EMR, EQT, EXC, EXPI, FARO, FDX, FIVN, FLS, FORM, FTV, FDP, GME, GPS, GD, GPN, GFS, GS, GOOGL, GPRO, GFF, GES, HQY, HTLD, HL, HP, HD, HON, HUBG, JBHT, HURC, INFN, ITGR, INTC, TILE, JNJ, KALU, KBH, KLIC, LHX, LRCX, RAMP, LOW, LPLA, MGY, MANH, MCHX, MKTX, MTDR, MU, MS, ^IXIC, NTAP, NEE, JWN, NTNX, OLN, ASGN, OMI, PKG, PANW, PRFT, PPG, PINC, PFG, PSTG, REGN, RCKY, ROG, RES, ^GSPC, SAIA, CRM, SAND, SLB, SHOP, SKYW, SMAR, SUM, SNPS, TPR, TGT, TPX, TDC, TXN, TTD, TMO, TSCO, TG, UHAL, VFC, VECO, MDRX, VRSN, V, WAT, WERN, WLK, WEX, WSC, WOLF, WWD, ZBRA, IYM, IAI, IYC, IDU, DDM, FTEC, FDN, QTEC, FXL, BOTZ, QQQ, IYZ, IEV, IGV, IXN, ILF, SOXX, IYF, EWO, EWZ, EWQ, EWG, EWH, EIS, EWJ, EWM, EWW, EWS, EWY, EWP, EWD, EWT, TUR, QLD, PPA, SSO, ROBO, XLY, XLB, XRT, SPY, XAR, XLK, USO, SMH, VAW, MGK, VONG. Click this link for details (pattern type, start and end dates).
For a list of small patterns (those a few days wide) click this link.
The below industries were the best (rank 1) or worst performing of those I follow.
|
-- Thomas Bulkowski, author: Invest for Two-Comma Wealth (#Ad)
![]()
$ $ $
Here's a symbol list of 196 chart and candlestick patterns (13 "investment grade" candle patterns) found in today's securities using my version of Patternz: ACIW, AFL, APD, ALRM, ALGT, ALL, AMZN, AEE, ANIK, AON, APOG, AAPL, ARCB, ACGL, ARW, AVA, BMI, BCPC, BSET, BZH, BIIB, BKH, BOOT, BBW, BG, CBT, CAL, CE, CNC, CIEN, CSCO, CLF, CLX, CNO, CGNX, ED, CONN, COTY, CTS, CMI, DVN, ^DJT, ^DJI, D, DRQ, ECL, ELV, EME, EFX, EVRG, EXC, EXPI, FARO, FDX, FMC, FORM, FDP, GME, GPS, GD, GNW, GS, GPRO, GFF, HTLD, HL, HELE, HP, HOLX, HD, HUBG, HUM, JBHT, HURC, IDXX, ILMN, TILE, ISRG, IRM, KBH, K, KEYS, LHX, LH, LRCX, LEN, LOW, MGY, MANH, MCHX, MAS, MTRX, MS, ^IXIC, NFG, NFLX, JWN, NTNX, NVDA, OMCL, ASGN, OTEX, PKG, PKE, PTEN, PYPL, PRFT, PPL, PINC, PHM, KWR, DGX, RJF, REGN, RLI, ROG, RES, ^GSPC, SAIA, CRM, SBH, SLB, SHOP, SKX, SKYW, SMAR, SWX, SSYS, SUM, TPR, TGT, TDOC, TPX, TSCO, TG, TREX, UHAL, UGI, UIS, VFC, VMI, VECO, VEEV, WAT, WU, WOLF, WWD, XEL, IYM, IYC, IDU, DDM, FDN, QQQ, IYZ, ILF, SLV, ITB, EWZ, EWQ, EIS, EWI, EWW, EWP, QLD, PPA, DBA, SSO, XLY, XLP, XLB, XRT, SPY, XAR, USO, VAW, MGK, VONG. Click this link for details (pattern type, start and end dates).
For a list of small patterns (those a few days wide) click this link.
$ $ $
You can find setups based on a Fibonacci retrace by clicking on the link.
The following patterns were found manually, not using Patternz. Mr. Bulkowski has excluded any securities he owns from appearing in the list. However, he may add any of the securities listed to his portfolio at any time, just as you can.
In the table below, the red and green colors are based on the historical breakout direction for the associated chart pattern. If a high and tight flag appears, the start and end dates highlight the flagpole only and not the flag.
For details about the chart patterns, click here.
-- Thomas Bulkowski, author: Invest for Two-Comma Wealth (#Ad)
![]()
| Symbol | Chart Pattern | Bullish Bearish | Start | End | Industry |
| DDD | Double Top, Eve and Adam | 07/17/2024 | 07/25/2024 | Electronics | |
| ABT | Triple bottom | 07/09/2024 | 07/29/2024 | Medical Supplies | |
| A | Double Bottom, Adam and Eve | 05/30/2024 | 07/09/2024 | Precision Instrument | |
| APD | Double Bottom, Adam and Adam | 07/02/2024 | 07/22/2024 | Chemical (Diversified) | |
| ALRM | Ugly double bottom | 06/21/2024 | 07/22/2024 | Computer Software and Svcs | |
| AME | Double Top, Adam and Adam | 07/16/2024 | 07/31/2024 | Industrial Services | |
| APOG | Horn bottom | 06/24/2024 | 07/08/2024 | Building Materials | |
| AMAT | Double Top, Adam and Adam | 06/18/2024 | 07/10/2024 | Semiconductor Cap Equip. | |
| ADM | Diamond top | 07/09/2024 | 07/29/2024 | Food Processing | |
| ANET | Double Bottom, Adam and Adam | 07/25/2024 | 07/30/2024 | E-Commerce | |
| BSX | Broadening top | 06/21/2024 | 07/30/2024 | Medical Services | |
| BRKR | Double Bottom, Eve and Eve | 07/09/2024 | 07/19/2024 | Precision Instrument | |
| CLS | Triple top | 05/28/2024 | 07/16/2024 | Electronics | |
| CDAY | Ugly double bottom | 07/09/2024 | 07/25/2024 | Information Services | |
| CF | Double Bottom, Eve and Adam | 07/09/2024 | 07/23/2024 | Chemical (Basic) | |
| CIEN | Triangle, symmetrical | 07/16/2024 | 07/29/2024 | Telecom. Equipment | |
| CGNX | Dead-cat bounce | 08/01/2024 | 08/01/2024 | Precision Instrument | |
| CTS | Pipe top | 07/15/2024 | 07/22/2024 | Electronics | |
| DHR | Double Bottom, Eve and Adam | 07/08/2024 | 07/19/2024 | Medical Services | |
| DFS | Double Top, Adam and Eve | 07/18/2024 | 07/31/2024 | Financial Services | |
| D | Ugly double bottom | 07/01/2024 | 07/24/2024 | Electric Utility (East) | |
| BOOM | Double Top, Adam and Eve | 06/14/2024 | 07/17/2024 | Metal Fabricating | |
| EXP | Ugly double bottom | 07/09/2024 | 07/19/2024 | Cement and Aggregates | |
| EME | Diamond top | 07/11/2024 | 08/01/2024 | Industrial Services | |
| EMR | Triple top | 07/16/2024 | 07/30/2024 | Computers and Peripherals | |
| EXPI | Double Top, Adam and Eve | 07/18/2024 | 07/29/2024 | E-Commerce | |
| FARO | Double Top, Adam and Adam | 07/16/2024 | 07/23/2024 | Precision Instrument | |
| FIVN | Double Top, Adam and Adam | 07/17/2024 | 07/29/2024 | Computer Software and Svcs | |
| HOLX | Ugly double bottom | 06/20/2024 | 07/26/2024 | Medical Supplies | |
| HUM | Double Top, Eve and Adam | 07/18/2024 | 07/30/2024 | Medical Services | |
| K | Double Bottom, Adam and Adam | 07/24/2024 | 07/30/2024 | Food Processing | |
| KMT | Ugly double bottom | 07/09/2024 | 07/22/2024 | Metal Fabricating | |
| LHX | Pipe top | 07/15/2024 | 07/22/2024 | Aerospace/Defense | |
| MLM | Double Bottom, Eve and Adam | 07/02/2024 | 07/24/2024 | Cement and Aggregates | |
| MA | Double Bottom, Adam and Adam | 07/10/2024 | 07/24/2024 | Financial Services | |
| MTRN | Double Top, Adam and Eve | 07/17/2024 | 07/31/2024 | Metals and Mining (Div.) | |
| META | Head-and-shoulders bottom | 07/17/2024 | 07/30/2024 | E-Commerce | |
| MGEE | Ugly double bottom | 07/03/2024 | 07/24/2024 | Electric Utility (Central) | |
| NFLX | Triple top | 06/20/2024 | 07/05/2024 | Internet | |
| NWL | Ugly double bottom | 07/10/2024 | 07/22/2024 | Household Products | |
| NOVT | Double Top, Adam and Eve | 07/17/2024 | 07/26/2024 | Precision Instrument | |
| ORCL | Triple top | 06/20/2024 | 07/15/2024 | Computer Software and Svcs | |
| OUT | Ugly double bottom | 06/17/2024 | 07/24/2024 | Advertising | |
| PYPL | Double Bottom, Adam and Adam | 07/01/2024 | 07/26/2024 | Financial Services | |
| PRU | Double Top, Adam and Adam | 07/17/2024 | 08/01/2024 | Insurance (Life) | |
| PEG | Double Bottom, Adam and Adam | 07/18/2024 | 07/25/2024 | Electric Utility (East) | |
| PSTG | Head-and-shoulders top | 05/30/2024 | 07/11/2024 | Computers and Peripherals | |
| QCOM | Head-and-shoulders top | 05/28/2024 | 07/16/2024 | Telecom. Equipment | |
| RCKY | Double Top, Eve and Eve | 07/17/2024 | 07/26/2024 | Shoe | |
| RES | Horn bottom | 07/08/2024 | 07/22/2024 | Oilfield Svcs/Equipment | |
| SAIA | Dead-cat bounce | 07/26/2024 | 07/26/2024 | Trucking/Transp. Leasing | |
| SMTC | Pipe top | 07/08/2024 | 07/15/2024 | Semiconductor Cap Equip. | |
| SUM | Ugly double bottom | 06/25/2024 | 07/24/2024 | Cement and Aggregates | |
| TECH | Ugly double bottom | 07/09/2024 | 07/19/2024 | Biotechnology | |
| TDC | Double Top, Eve and Adam | 06/28/2024 | 07/18/2024 | Computer Software and Svcs | |
| TEVA | Pipe bottom | 07/01/2024 | 07/08/2024 | Drug | |
| TDG | Broadening bottom | 07/15/2024 | 07/31/2024 | Aerospace/Defense | |
| VLO | Double Bottom, Eve and Eve | 07/11/2024 | 07/25/2024 | Petroleum (Integrated) | |
| VRSN | Double Bottom, Eve and Eve | 07/10/2024 | 07/24/2024 | Internet | |
| V | Broadening bottom | 06/27/2024 | 07/25/2024 | Financial Services | |
| WAT | Ugly double bottom | 07/09/2024 | 07/24/2024 | Precision Instrument | |
| WSO | Double Top, Adam and Adam | 07/16/2024 | 07/29/2024 | Retail Building Supply | |
| WWD | Triple top | 06/03/2024 | 07/17/2024 | Precision Instrument |
![]()
Here's the updated 2024 market forecast, presented in slider format.
$ $ $
Here's a symbol list of 179 chart and candlestick patterns (13 "investment grade" candle patterns) found in today's securities using my version of Patternz: ALRM, AA, AMZN, APH, AMAT, ACGL, ANET, ADP, AVY, AVA, AXS, BSET, BZH, BA, BOOT, BRC, BCO, BLDR, COR, CNC, CENX, CDAY, CHD, CIEN, CNA, CGNX, CONN, CTS, CW, DOV, DRQ, ELV, FDS, FARO, FDX, FNV, GPS, GD, GNW, GFS, GPRO, GGG, GFF, HTLD, HELE, HP, HUM, JBHT, IDA, ILMN, INCY, INTC, IPAR, TILE, ISRG, JAZZ, K, KEYS, KMB, KLAC, KSS, KLIC, LHX, LZB, LRCX, LEN, MTSI, MGY, MANH, MCHX, MKTX, MAS, MA, MRK, MU, MUR, NBR, ^IXIC, NTGR, NTAP, NEU, NTNX, NVDA, OMC, ASGN, OTEX, ORCL, PYPL, PCG, PINC, PEG, PHM, PSTG, QCOM, RRC, RJF, RES, ^GSPC, SLB, SMG, SMTC, SLGN, STR, SKX, SCCO, SNPS, TDOC, TER, TG, TREX, UIS, UNM, VMI, VEEV, MDRX, VRTX, VMC, WAT, WLK, IYM, IDU, FTEC, QTEC, FXL, BOTZ, QQQ, ICF, IYZ, IGV, MXI, IXN, SOXX, SLV, IGE, IEO, ITB, EWK, EWC, ECH, EEM, EWJ, EWM, EWS, EZA, EWY, EWD, EWL, EWT, THD, TUR, QLD, PXJ, SSO, ROBO, XLE, GLD, SPY, XLK, XLU, USO, SMH, VAW, MGK, VONG. Click this link for details (pattern type, start and end dates).
For a list of small patterns (those a few days wide) click this link.
$ $ $
The following table shows where Fibonacci retrace values of the day's high-low range are plus pivot points, calculated on the Nasdaq composite, sorted by value. When several are near each other (small differences), the area might act as support or resistance.
-- Thomas Bulkowski, author: Invest for Two-Comma Wealth (#Ad)
![]()
| © 2024 ThePatternSite.com Metric | Value | Diff | Close (within 10% of the high-low range for the day)? |
| Monthly S2 | 16,131.03 | ||
| Weekly S2 | 16,492.83 | 361.79 | |
| Monthly S1 | 16,865.22 | 372.39 | |
| Weekly S1 | 17,046.11 | 180.90 | |
| Daily S2 | 17,321.95 | 275.83 | |
| Low | 17,438.60 | 116.65 | |
| Daily S1 | 17,460.67 | 22.07 | Yes! The Daily S1 is close to the Low. |
| Open | 17,499.23 | 38.56 | |
| 61.8% Down from Intraday High | 17,536.15 | 36.92 | |
| 50% Down from Intraday High | 17,566.29 | 30.13 | |
| Daily Pivot | 17,577.33 | 11.04 | Yes! The Daily Pivot is close to the 50% Down from Intraday High. |
| Weekly Pivot | 17,587.25 | 9.92 | Yes! The Weekly Pivot is close to the Daily Pivot. |
| 38.2% Down from Intraday High | 17,596.42 | 9.18 | Yes! The 38.2% Down from Intraday High is close to the Weekly Pivot. |
| Close | 17,599.40 | 2.98 | Yes! The Close is close to the 38.2% Down from Intraday High. |
| High | 17,693.98 | 94.58 | |
| Daily R1 | 17,716.05 | 22.07 | Yes! The Daily R1 is close to the High. |
| Monthly Pivot | 17,768.14 | 52.09 | |
| Daily R2 | 17,832.71 | 64.56 | |
| Weekly R1 | 18,140.53 | 307.83 | |
| Monthly R1 | 18,502.33 | 361.79 | |
| Weekly R2 | 18,681.67 | 179.34 | |
| Monthly R2 | 19,405.25 | 723.59 |
Support this site! Clicking any of the books (below) takes you to
Amazon.com If you buy ANYTHING while there, they pay for the referral.
Legal notice for paid links: "As an Amazon Associate I earn from qualifying purchases."
|
My Stock Market Books
|
My Novels
Orb Foresight Rewrite Coming!
|