As of 05/06/2026
Indus: 49,911 +612.34 +1.2%
Trans: 20,366 +346.07 +1.7%
Utils: 1,136 -16.63 -1.4%
Nasdaq: 25,839 +512.81 +2.0%
S&P 500: 7,365 +105.90 +1.5%
|
YTD
+3.8%
+17.3%
+6.3%
+11.2%
+7.6%
|
|
As of 05/06/2026
Indus: 49,911 +612.34 +1.2%
Trans: 20,366 +346.07 +1.7%
Utils: 1,136 -16.63 -1.4%
Nasdaq: 25,839 +512.81 +2.0%
S&P 500: 7,365 +105.90 +1.5%
|
YTD
+3.8%
+17.3%
+6.3%
+11.2%
+7.6%
|
|
As of 05/06/2026
Indus: 49,911 +612.34 +1.2%
Trans: 20,366 +346.07 +1.7%
Utils: 1,136 -16.63 -1.4%
Nasdaq: 25,839 +512.81 +2.0%
S&P 500: 7,365 +105.90 +1.5%
|
YTD
+3.8%
+17.3%
+6.3%
+11.2%
+7.6%
| |
|
| ||

My book, Encyclopedia of Chart Patterns, 3rd Edition, pictured on the right, covers double bottom chart patterns extensively. Some of the information I share with you here.
If you click on the above link and then buy the book (or anything) while at Amazon.com, the referral will help support this site. Thanks.
$ $ $
Updated and added 10 examples on 8/4/25.
|
Eve & Adam Double Bottom
|
|
The above numbers are based on 759 perfect trades. See the glossary for definitions.
Consult the associated figure on the right.
| Characteristic | Discussion | 
The Double Bottom Setup
|
| Price trend | Downward leading to the pattern. | |
| Shape | Two distinct valleys that look different. Eve bottoms appear first and are wider and more rounded looking. Adam bottoms appear after Eve and are narrow, V-shaped, sometimes with one long price spike. Spikes that appear tend to be more numerous and shorter on Eve bottoms. | |
| Peak | The rise between bottoms should measure at least 10%, but allow variations. | |
| Bottom price | The price variation between bottoms is small, usually between 0% and 4%. The two valleys should appear to bottom near the same price, but be flexible. | |
| Separation | The twin valleys are several weeks apart with most falling in the 2 to 7 week range (the median is 23 days). | |
| Confirmation | The double bottom confirms as a true double bottom once price closes above the peak between the two valleys. That is the top red line on the figure to the right. | |
| Volume | Higher on the left bottom . |
![]() More (#ad)
More (#ad)
A trading setup related to double bottoms and throwbacks is located here.
Consult the associated figures on the right.
| Trading Tactic | Explanation |

The Measure Rule 
Handle 
Flat Base |
| Measure rule | Compute the height from the highest peak (A) to the lowest valley (B) in the pattern then multiply it by the above 'percentage meeting price target.' Add the result to the breakout price (the highest peak in the pattern, A) to get the target, C. | |
| Price reversal | Price must have something to reverse, so if the decline leading to the double bottom is small, expect a small rise. | |
| Big W | Look for a double bottom with a tall left side, one with a steep decline and few or no price consolidations along the way. Expect price to return to near where the downtrend began. Read the article at the link for more details. | |
| Confirmation | Wait for confirmation: price to close above the peak between the valleys. If you don't wait, there's a 48% chance that price will continue lower without confirming the double bottom. | |
| Handle | See the figure to the right. Sometimes price will confirm the double bottom then waffle up and down, forming a handle. When price breaks out of this region, it often moves up in a strong trend. | |
| Flat base | Expect a large rise if the double bottom appears after a long, flat base. Use the weekly scale to find the flat base -- the double bottom will look like a pothole in a road. | |
| Trends | A long-term decline (more than 6 months) leading to the double bottom results in the best post breakout performance, but it's only one percentage point above the gain posted by short-term declines (0 to 3 months). | |
| Yearly middle | Double bottoms in the middle third of the yearly price range perform best. | |
| Volume trend | A downward volume trend suggests good post breakout performance. | |
| Throwbacks | Throwbacks hurt post breakout performance |
![]() More (#ad)
More (#ad)

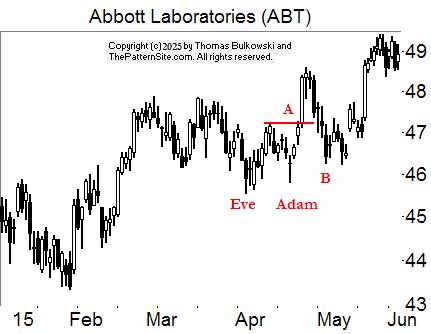
The figure to the right shows an example of an Eve & Adam double bottom chart pattern.
The Eve bottom has three days at about the same price level. Adam bottom has a long, single price spike. The two bottoms look different.
Eve is wider than Adam and more rounded looking.
The Eve & Adam double bottom chart pattern confirms when price closes above the high between the two bottoms, shown here as the breakout point.
![]() More (#ad)
More (#ad)
Refer to the following chart examples.

Chart 1: This chart shows an example of a triple bottom forming as part of a retrace in an uptrend, but the chart pattern could just as well be a double bottom. The two thick red lines show the primary trend, which is up (daily scale). From time to time, a stock will pause and retrace a portion of the gain as the stock rises. In this case, the retrace formed a reversal pattern called a triple bottom.
This setup, where the upward breakout from a double bottom (or other reversal pattern) rejoins the uptrend can lead to substantial gains (not always, of course). But it's a setup worth looking for.

Chart 2: In this example, price is dropping (shown by the thick red lines). A double bottom acts as a reversal of the downtrend (because price moves UP to A, confirming the double bottom as a valid reversal), but when the stock rejoins the current, the reversal collapses and the stock continues lower (to B).
This is a setup that you'll want to avoid.
![]() More (#ad)
More (#ad)
The following is a slide show. Click the right or left arrows, or the circles below the chart to navigate around the slides.
The chart of an Eve & Adam double makes the shape of the two bottoms clear. Eve is wide. Adam is thin. At A, an upward breakout happens and it confirms the chart pattern as valid. At B, a throwback completes.

AB is the double bottom. C confirms the double bottom with an upward breakout. Price strugglesd for about a month before gaining altitude.

Another Eve & Adam double bottom.

This Eve & Adam double bottom (AB) saw price climb to C before collapsing. When price closed below the bottom of the double bottom, it busted the upward breakout and signaled the start of a new trend: down.

Another Eve & Adam double bottom with A wider than B.

Eve & Adam double bottom AB.

This Eve & Adam double bottom doesn't see price rise much between bottoms A and B.

Double bottom AB.

Another Eve & Adam double bottom in a downtrend that continues downward soon after an upward breakout.

Eve & Adam double bottom (AB) breaks out upward and busts at C when price closes below the bottom of the chart pattern.
![]() More (#ad)
More (#ad)
-- Thomas Bulkowski
Support this site! Clicking any of the books (below) takes you to
Amazon.com If you buy ANYTHING while there, they pay for the referral.
Legal notice for paid links: "As an Amazon Associate I earn from qualifying purchases."
|
My Stock Market Books
|
My Novels
Orb Foresight Rewrite Coming!
|
If at first you do succeed, try not to look astonished.![]()
