As of 05/01/2026
Indus: 49,499 -152.87 -0.3%
Trans: 20,598 -195.32 -0.9%
Utils: 1,157 -8.12 -0.7%
Nasdaq: 25,114 +222.13 +0.9%
S&P 500: 7,230 +21.11 +0.3%
|
YTD
+3.0%
+18.7%
+8.3%
+8.1%
+5.6%
|
|
As of 05/01/2026
Indus: 49,499 -152.87 -0.3%
Trans: 20,598 -195.32 -0.9%
Utils: 1,157 -8.12 -0.7%
Nasdaq: 25,114 +222.13 +0.9%
S&P 500: 7,230 +21.11 +0.3%
|
YTD
+3.0%
+18.7%
+8.3%
+8.1%
+5.6%
|
|
As of 05/01/2026
Indus: 49,499 -152.87 -0.3%
Trans: 20,598 -195.32 -0.9%
Utils: 1,157 -8.12 -0.7%
Nasdaq: 25,114 +222.13 +0.9%
S&P 500: 7,230 +21.11 +0.3%
|
YTD
+3.0%
+18.7%
+8.3%
+8.1%
+5.6%
| |
|
| ||
Updated and added 10 examples on 6/18/25.
During writing of my book, Encyclopedia of Chart Patterns, I thought of broadening tops and bottoms then wondered if similar patterns would appear if the megaphone shape were tilted up. That is how I discovered the ascending broadening wedge chart pattern. I am not claiming to be the first one to identify it. The list of chart pattern analysts is long and chart patterns have been around for decades. Certainly someone before me probably discovered them.
If you click on the above link and then buy the book (or anything) while at Amazon.com, the referral will help support this site. Thanks.

The ascending broadening wedge is a chart pattern that tends to disappear in a bear market. Most often, you'll find them in a bull market with a downward breakout.
The above numbers are based on 690 perfect trades. See the glossary for definitions.
| Characteristic | Discussion |
| Price trend | Can be up or down leading to the pattern |
| Shape | A megaphone tilted up. Refer to the above figure. |
| Trendlines | Both trendlines slope upward. The top one slopes more steeply than the bottom one. |
| Touches | At least three peaks and three valleys should touch their respective trendline. |
| Volume | Irregular but trends upward 66% to 67% of the time. |
| Breakout | Downward 52% of the time. |
| Trading Tactic | Explanation | 
Measure rule for downward breakouts
|
| Measure rule | Refer to the two figures on the right. For downward breakouts, use the lowest valley in the pattern as the target. For upward breakouts, compute the difference between the highest peak (point A) and lowest valley (B) in the pattern to get the height. Multiply the height by the above 'percentage meeting price target' and add it to the breakout price (A) to get the price target (C). | |
| Intraformation trade | Since the bottom trendline slopes upward, do not short this pattern at the top trendline. Go long at the bottom when price bounces off the bottom trendline, heading up. | |
| Buy at 3rd touch | When price touches the bottom trendline for the third time and begins rising, buy. This is for aggressive traders because the breakout is often downward. | |
| Partial rise | A partial rise works 60% of the time. See the link on the left for more information. | |
| Partial decline | A partial decline works 65% of the time. See the link on the left for more information. | 
Measure rule for upward breakouts |
| Price trend | For upward breakouts, the best performing patterns are those with an intermediate-term (between 3 and 6 months) move leading to the pattern. Downward breakouts do better with a short-term move (less than 3 months) leading to the pattern. | |
| Yearly low | Downward breakouts perform best when the breakout is within a third of the yearly low. For upward breakouts, performance improves when the breakout is within a third of the yearly high. The link on the left provides statistics (probably outdated) and this link gives additional information. | |
| Throwbacks and pullbacks | Throwbacks and pullbacks hurt post breakout performance. The links on the left define throwbacks and pullbacks. These links for throwbacks and pullbacks discuss performance. | |
| Continuations/reversals | For the patterns which breakout upward, 81% of them act as continuations of the prevailing price trend. Those continuations tend to outperform reversals with gains averaging 42% versus 35%, respectively. For those which breakout downward, 81% of those act as reversals of the prevailing price trend. Continuations also work best for those, but only by one percentage point: 13% (for continuations) versus 12% (for reversals). |

The above figure shows an example of the ascending broadening wedge chart pattern. The only thing remarkable about this wedge is that a partial decline occurs after the breakout. Technically, that means a partial decline did not occur (because it is after the breakout), but it sure looks pretty on the chart.
I present the information in slider format, so be sure to click the left or right arrows to view another slide.
For targets, I used the pattern's height added to the top of the pattern (Patternz software automatically calculates this for you).
In my analysis of the ascending broadening wedge, I only looked at upward breakouts. The failure rate of upward breakouts is about half the rate for downward breakouts. Trade from the long side and wait for an upward breakout (a close above the top of the chart pattern, but you can use a buy stop to get you in when price touches a penny above the high).
Place a stop loss order a penny below the lowest price bar in the chart pattern.

This chart shows only a portion of a multi-peak chart pattern. That's when price reaches a high and moves horizontally, forming additional peaks. A bullish pattern forming within this cluster has a better chance of failing. This is an example of that. Price breaks out upward from the broadening wedge and then reverses, causing a losing trade.

The start of the uptrend is not shown because it won't fit on the chart and this slide show. However, it's clear that the wedge appears well into the uptrend, so caution is advised. This wedge breaks out downward (bad if you took a long-side position, looking for an upward breakout). This is an example of the need to wait for an upward breakout before entering a trade but also to find patterns you believe are closer to the trend start than the end.

This chart pattern breaks out downward, flips around, and breaks out upward, busting the downward breakout. The result is a nice rise. Look for busted patterns (downward breakouts) that turn around and breakout higher.

Here we see a head-and-shoulders top, unconfirmed (meaning it could just be squiggles on a price chart), with the broadening wedge (BWA) as part of it. Because the larger head-and-shoulders is a bearish chart pattern and it's obvious on the chart, I'd avoid this trade.
The following is a slide show. Click the right or left arrows, or the circles below the chart to navigate around the slides.
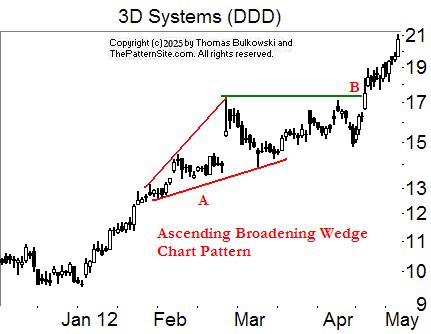
The ascending broadening wedge is at A, outlined in red. Green line B shows where an upward breakout happens. The loose-looking turns (trendline to trendline touches) in the pattern are not ideal. I prefer tighter turns without as much white space.

An ascending broadening wedge chart pattern, at A. This shows a better example of the wedge (better looking turns).

An ascending broadening wedge chart pattern. The small penetration of price on the middle bottom trendline is not a concern.

An ascending broadening wedge chart pattern.

An ascending broadening wedge chart pattern.

An ascending broadening wedge chart pattern.

An ascending broadening wedge chart pattern.

An ascending broadening wedge chart pattern. This one has an upward breakout, at A. At B, the pattern shows a terrific example of a partial decline, correctly predicting an upward breakout.

An ascending broadening wedge chart pattern. A partial rise at A fails to predict a downward breakout.

An ascending broadening wedge chart pattern. This one has a downward breakout (A) that's short-lived.
-- Thomas Bulkowski
Support this site! Clicking any of the books (below) takes you to
Amazon.com If you buy ANYTHING while there, they pay for the referral.
Legal notice for paid links: "As an Amazon Associate I earn from qualifying purchases."
|
My Stock Market Books
|
My Novels
Orb Foresight Rewrite Coming!
|
My kids rob me blind and then make me the getaway driver.![]()