As of 04/24/2026
Indus: 49,231 -79.61 -0.2%
Trans: 20,892 -198.95 -0.9%
Utils: 1,155 -2.30 -0.2%
Nasdaq: 24,837 +398.10 +1.6%
S&P 500: 7,165 +56.68 +0.8%
|
YTD
+2.4%
+20.4%
+8.1%
+6.9%
+4.7%
|
|
As of 04/24/2026
Indus: 49,231 -79.61 -0.2%
Trans: 20,892 -198.95 -0.9%
Utils: 1,155 -2.30 -0.2%
Nasdaq: 24,837 +398.10 +1.6%
S&P 500: 7,165 +56.68 +0.8%
|
YTD
+2.4%
+20.4%
+8.1%
+6.9%
+4.7%
|
|
As of 04/24/2026
Indus: 49,231 -79.61 -0.2%
Trans: 20,892 -198.95 -0.9%
Utils: 1,155 -2.30 -0.2%
Nasdaq: 24,837 +398.10 +1.6%
S&P 500: 7,165 +56.68 +0.8%
|
YTD
+2.4%
+20.4%
+8.1%
+6.9%
+4.7%
| |
|
| ||
Updated and added 10 examples on 6/13/25.

My book, Encyclopedia of Chart Patterns, 3rd Edition, pictured on the right, covers double bottom chart patterns extensively. Some of the information I share with you here.
Adam is a term that describes how the bottom looks, in this case, a narrow, pointed bottom, often composed of a one-day downward price spike. Eve bottoms are more rounded looking and wider. If an Eve bottom has spikes, they tend to be more numerous and shorter. Many times the difference between Adam and Eve is the width of each over their entire height. Adam bottoms tend to remain narrow but Eve bottoms widen over their height. When trying to decide which is which, ask yourself if the two bottoms appear different or similar. With Adam & Adam, the two should look similar (both narrow bottoms).
The chart pattern is a twin bottom formation that becomes a true double bottom when confirmed (that is, when price closes above the center peak). Only then is it safe to buy, but that does not guarantee success. If you buy the stock before confirmation, the probability of price continuing lower is 48%. Until confirmation, the squiggles on the chart are just that -- squiggles -- and not a double bottom.
|
Overall performance rank (1 is best): 26 out of 39
Break even failure rate: 16%
Average rise: 39%
Throwback rate: 67%
Percentage meeting price target: 73%
The above numbers are based on 1,154 perfect trades. See the glossary for definitions. |

Adam & Adam Double Bottom |
|
| Characteristic | Discussion |
| Price trend | Downward leading to the pattern |
| Shape | Two distinct valleys that look similar. Adam bottoms are narrow, V-shaped, sometimes with one long price spike. |
| Peak | The rise between bottoms should measure at least 10%, but allow wide variations. |
| Bottom price | The price variation between bottoms is small (the average is 1%, but allow variations). The two valleys should appear to bottom near the same price. |
| Separation | The twin valleys are usually several weeks apart (16 days is the median). |
| Confirmation | The double bottom confirms as a true double bottom once price closes above the peak between the two valleys. |
| Volume | Usually higher on formation of the first bottom. |
A trading setup related to double bottoms and throwbacks is located here.
| Trading Tactic | Explanation |
 Measure Rule
|
| Measure rule | Reference the figure to the right. Compute the height from the highest peak between the two bottoms (A) to the lowest valley (B) in the pattern then multiply it by the above 'percentage meeting price target.' Add the result to the breakout price (point A, the highest peak in the pattern) to get the target (C). | |
| Stop | Place a stop loss order slightly below the lower of the two bottoms (point B in the figure to the right). Check to make sure the stop is not too far below the entry price. If so, then either raise the stop (try a volatility stop) or abandon the trade for a more promising setup. | |
| Price reversal | Price must have something to reverse, so if the decline leading to the double bottom is small, expect a small rise. | |
| Big W | Look for a double bottom with a tall left side, one with a steep decline and few or no price consolidations along the way down. Expect price to return to near where the downtrend began. |  Handle |
| Confirmation | Wait for confirmation -- price to close above the peak between the valleys. If you don't wait, there's a 48% chance that price will continue lower without confirming the double bottom. | |
| Handle | Sometimes price will confirm the double bottom then waffle up and down, forming a handle. When price breaks out of this region, it often moves up in a strong trend. The figure to the right shows an example. | |
| Flat base | Expect a large rise if the double bottom appears after a long, flat base. Use the weekly scale to find the flat base -- the double bottom will look like a pothole in a road. The figure to the lower right shows an example. | |
| Trends | Anything except a short-term decline leading to the double bottom results in the best post breakout performance. |  Flat Base |
| Yearly low | Double bottoms within a third of the yearly low perform best. The link to the left discusses performance and this link provides more information. | |
| Volume trend | A downward volume trend happens most often. The link on the left shows an example and provides a list of chart patterns that perform best after a downward volume trend. | |
| Throwbacks | Throwbacks hurt post breakout performance. The link to the left defines a throwback and this link discusses performance. |

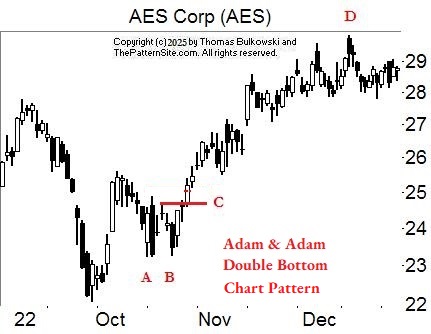
The figure shows an example of an Adam & Adam double bottom chart pattern. The two bottoms have a good rise between them (point B) and they appear after a downward price trend. The Adam & Adam double bottom confirms as a valid chart pattern when price closes above point B, shown as the lower horizontal blue line.
To calculate a price target, subtract the price of the lower of the two Adam valleys from the price at peak B (the highest high between the two bottoms) to get the height. Multiply the result by 73% (the percentage meeting price target from Important Bull Market Results table near the top of this page) and add the result to B. That gives a target slightly above C. Even though price fell short of the target, overhead resistance highlighted by the green line doubled as a good price target, indicating profits should be taken near there.
As of June 2025, I'd classify the first bottom as an Eve bottom and not Adam. The second bottom might be an Eve bottom also, so assigning labels to the pattern can be difficult. There is a slight performance difference between Adam and Eve combinations, so it can pay to make an accurate determination.
Refer to the following chart examples.

This chart shows an example of a triple bottom forming as part of a retrace in an uptrend, but the chart pattern could just as well be a double bottom. The two thick red lines show the primary trend, which is up (daily scale). From time to time, a stock will pause and retrace a portion of the gain as the stock rises. In this case, the retrace formed a reversal pattern called a triple bottom.
This setup, where the upward breakout from a double bottom (or other reversal pattern) rejoins the uptrend can lead to substantial gains (not always, of course). But it's a setup worth looking for.

In this example, price is dropping (shown by the thick red lines). A double bottom acts as a reversal of the downtrend (because price moves UP to A, confirming the double bottom as a valid reversal), but when the stock rejoins the current, the reversal collapses and the stock continues lower (to B).
This is a setup that you'll want to avoid.
The following is a slide show. Click the right or left arrows, or the circles below the chart to navigate around the slides.
The Adam & Adam double bottom is at AB. It confirms as a valid chart pattern when the stock closes above the red line, at C. The ultimate high is at D. The ultimate high is the highest price reached before the stock drops by at least 20%.

This is another example of an Adam & Adam double bottom (AB). It confirms at C. Price, so far this year, has meandered upward. Notice that there wasn't much of a downtrend leading to valley A. What's there to reverse? Maybe that explains the sideway move after confirmation.

AB shows another Adam & Adam double bottom, confirmed at C with a throwback to D. Twin bottom EF is not a double bottom because price didn't confirm the pattern.
What's that mean? It means the stock did not close above the highest peak between the EF bottoms (which I show as the red line). Instead, the stock dropped to G.

AB is an unusual looking Adam & Adam double bottom. The two bottoms should be near in price to one another, but allow some variance as in this example. CD is a better case of an Adam & Adam double bottom. The ultimate high is at E. Notice that the lower in the uptrend you buy in (pattern AB), the higher the potential profit.

AB is the double bottom, the red line is confirmation, and C is the ultimate high. The rise after confirmation didn't amount to much.

This (AB) is another example of a failed Adam & Adam double bottom. Confirmation is at C, the ultimate high is at D, with a low at E below the double bottom. A stop placed a penny below the lower of the two bottoms (B) would have triggered for a losing trade.

This is another example of an Adam & Adam double bottom (AB).

AB shows the Adam & Adam double bottom. Notice that this also forms the dual head of a complex head-and-shoulders bottom. LS is the left shoulder, the double bottom is the dual head, and RS is the right shoulder.

AB is an Adam & Adam double bottom. However, CD is an Adam & Eve double bottom. Notice how Eve is wider than Adam. Peak E is the ultimate high for both patterns.

AB is an Adam & Adam double bottom with an ultimate high at E. CD is an Adam & Adam double top.
-- Thomas Bulkowski
Support this site! Clicking any of the books (below) takes you to
Amazon.com If you buy ANYTHING while there, they pay for the referral.
Legal notice for paid links: "As an Amazon Associate I earn from qualifying purchases."
|
My Stock Market Books
|
My Novels
Orb Foresight Rewrite Coming!
|
Give me ambiguity or give me something else.![]()