
As of 04/17/2026
Indus: 49,447 +868.71 +1.8%
Trans: 22,422 +609.39 +2.8%
Utils: 1,158 -6.73 -0.6%
Nasdaq: 24,468 +365.78 +1.5%
S&P 500: 7,126 +84.78 +1.2%
|
YTD
+2.9%
+29.2%
+8.4%
+5.3%
+4.1%
|
|
As of 04/17/2026
Indus: 49,447 +868.71 +1.8%
Trans: 22,422 +609.39 +2.8%
Utils: 1,158 -6.73 -0.6%
Nasdaq: 24,468 +365.78 +1.5%
S&P 500: 7,126 +84.78 +1.2%
|
YTD
+2.9%
+29.2%
+8.4%
+5.3%
+4.1%
| |
|
| ||

I need some social media buzz, and I'm hoping you can provide it.
My latest book (Invest for Two-Comma Wealth, pictured on the right) is self-published (does not use a traditional publisher) and struggling to reach its intended audience. Here's how you can help.
If you have a blog or use social media such as X/twitter or meta/facebook, could you post a note saying the book is available?
Maybe say something like, "Thomas Bulkowski has released a new book titled, Invest for Two-Comma wealth. It's an entry-level yet comprehensive book about investing in the securities markets to grow your net worth. It's available for $20 at Amazon.com."
If you want to say more about the book, you can visit Amazon.com's detail page here and use the text and book image.
If you do post a note, then let me know at ![]()
Thanks!
$ $ $
Here's a symbol list of 158 chart and candlestick patterns (13 "investment grade" candle patterns) found in today's securities using my version of Patternz: ANF, AES, A, ALK, ALGT, AMED, AEL, ANIK, AR, APA, ARCB, ARW, ASH, AIZ, ATO, ADSK, AVA, BECN, BZH, BERY, BIG, BA, BAH, BRC, BCO, CPB, CLS, COR, CLF, CNA, CNX, CAG, CONN, XRAY, DVN, DSGR, EIX, EOG, EQT, EG, EXC, EXPD, XOM, FICO, FARO, FDX, FIS, FE, FIVN, FLEX, FCX, GME, IT, GIS, GGG, HBI, THG, HLIT, HP, HOV, ILMN, IPI, JNJ, KBH, K, KSS, LZB, LEG, LEN, L, MHO, MRO, MDC, MLKN, MUR, NFG, NEU, NEE, NI, NOC, NUS, PDCO, PTEN, PAYX, PCTY, PFE, PCG, PXD, PPL, PFG, PGR, PSTG, DGX, RGS, ROP, R, SAND, SHW, SLGN, SKX, SMAR, SCCO, SWN, SCS, SUM, SRDX, TGT, TDOC, TDC, TTD, TDG, RIG, TRV, TZOO, TG, UIS, VFC, WRB, WPM, WSC, WOLF, IAI, IYK, IYE, ITB, IEZ, IHE, IAT, IGE, IYF, ECH, EWW, EWD, EWL, EWU, IBB, PXJ, GLD, UNG, VHT. Click this link for details (pattern type, start and end dates).
For a list of small patterns (those a few days wide) click this link.
-- Thomas Bulkowski
![]()
Since I post this the night before, check how the futures are trading before market open. Large moves can affect the opening direction.
$ $ $
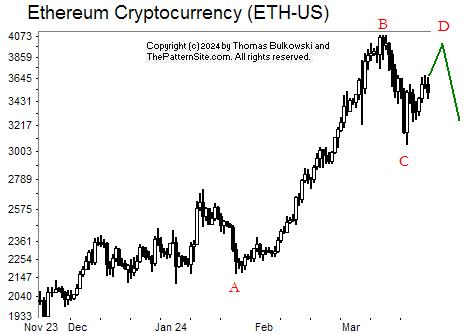
The chart shows Ethereum on the daily scale.
After making a strong push higher from the low at A to the peak at B, the cryptocurrency retraced to C. That's what I've expected to see happen in the major indices (Dow industrials, Nasdaq, and so on), but those are stubborn and haven't complied.
The currency has climbed from C to approach what I believe will be a peak at D. The D peak will likely remain below the top at B, so watch for that. After peaking, I expect it to drop, as the green line shows.
$ $ $
I added a trading lesson to cup with handle patterns. I found price retraces 47% of the time after a breakout, dropping substantially. That's something traders should know.
The link will take you there for your viewing pleasure. ![]()
$ $ $
Here's a symbol list of 183 chart and candlestick patterns (13 "investment grade" candle patterns) found in today's securities using my version of Patternz: DDD, ANF, AXDX, ACIW, AYI, ADTN, AES, AKAM, ALK, ALGT, AXP, AR, ARCB, ASH, AGO, BAX, BIG, BMRN, BA, BOOT, BRC, CBT, CPB, CLS, CX, CNC, CNP, CNX, CL, ED, CONN, COP, GLW, COTY, CRH, CCK, XRAY, DVN, ^DJU, ^DJI, DRQ, DTE, ELV, WIRE, EQT, EVRG, EVH, XOM, FFIV, FICO, FARO, FDX, FE, FIVN, FLEX, GPN, GFS, THG, HLIT, HELE, HNI, HON, HOV, HUN, IDA, IDXX, ILMN, INFN, ITGR, KALU, KELYA, KSS, LH, LEG, LDOS, LEN, LNC, MGY, MRO, MTRN, MRK, MLKN, MUR, NFG, NEE, NKE, NI, NVDA, OGE, ORI, OMC, OTEX, PANW, PDCO, PTEN, PYPL, PNW, PXD, PLXS, POR, PPL, PSTG, RRC, RLI, RCKY, ROP, R, SLB, SRE, SMTC, SLGN, SMAR, LUV, SWX, SWN, SR, SPSC, SUM, TPR, TGT, TTD, TMO, TJX, TZOO, UHAL, UIS, VMI, VECO, VRTX, VC, WRB, WSO, WEX, WPM, WOLF, IYK, IYE, IEZ, DDM, QTEC, ICF, IHF, SOXX, IGE, IYF, EWO, EWK, ECH, EWH, EIS, EWS, EWP, EWL, THD, EWU, PPA, PBE, PXJ, PJP, PHO, ROBO, XLE, XLK, UNG. Click this link for details (pattern type, start and end dates).
For a list of small patterns (those a few days wide) click this link.
$ $ $
The following table shows where Fibonacci retrace values of the day's high-low range are plus pivot points, calculated on the Nasdaq composite, sorted by value. When several are near each other (small differences), the area might act as support or resistance.
-- Thomas Bulkowski, author: Invest for Two-Comma Wealth (Ad)
![]()
| © 2024 ThePatternSite.com Metric | Value | Diff | Close (within 10% of the high-low range for the day)? |
| Monthly S2 | 15,042.80 | ||
| Weekly S2 | 15,709.75 | 666.95 | |
| Monthly S1 | 15,721.16 | 11.41 | Yes! The Monthly S1 is close to the Weekly S2. |
| Weekly S1 | 16,054.63 | 333.47 | |
| Monthly Pivot | 16,130.01 | 75.38 | |
| Daily S2 | 16,217.52 | 87.51 | |
| Low | 16,279.17 | 61.65 | |
| Weekly Pivot | 16,296.75 | 17.58 | |
| Daily S1 | 16,308.52 | 11.77 | Yes! The Daily S1 is close to the Weekly Pivot. |
| 61.8% Down from Intraday High | 16,337.48 | 28.96 | |
| 50% Down from Intraday High | 16,355.50 | 18.01 | |
| Daily Pivot | 16,370.17 | 14.67 | Yes! The Daily Pivot is close to the 50% Down from Intraday High. |
| 38.2% Down from Intraday High | 16,373.51 | 3.34 | Yes! The 38.2% Down from Intraday High is close to the Daily Pivot. |
| Close | 16,399.52 | 26.01 | |
| Open | 16,424.76 | 25.24 | |
| High | 16,431.82 | 7.06 | Yes! The High is close to the Open. |
| Daily R1 | 16,461.17 | 29.35 | |
| Daily R2 | 16,522.82 | 61.65 | |
| Weekly R1 | 16,641.63 | 118.81 | |
| Monthly R1 | 16,808.37 | 166.74 | |
| Weekly R2 | 16,883.75 | 75.38 | |
| Monthly R2 | 17,217.22 | 333.47 |
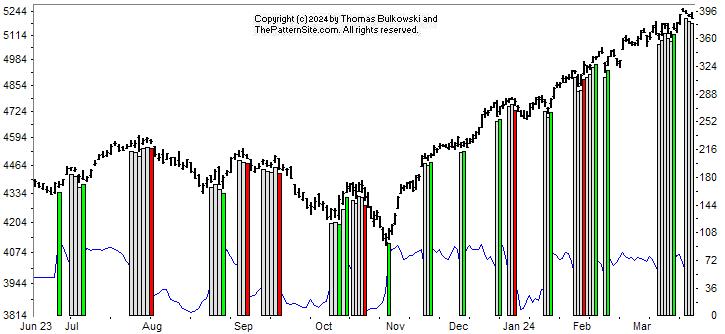
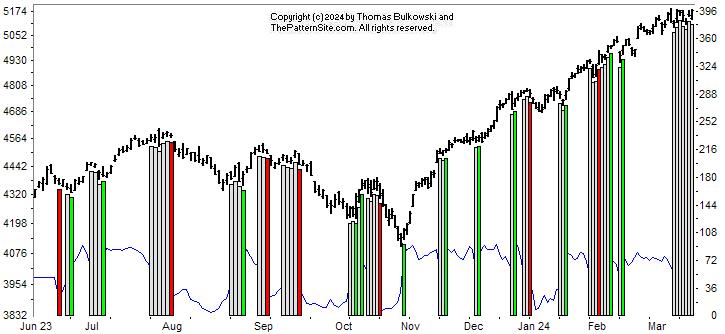
This is a picture of the chart pattern indicator on the daily scale. The indicator is the line chart below a chart of the S&P 500 composite.
This is a broken record, but I'm still waiting for the indices to make a big retrace. They are overdue.
The CPI shows a neutral rating. Using the right scale, I'm looking for a retrace back to 288 (about the level of early January).
I'm not saying the retrace has begun. I've been waiting for it for a few months now and it hasn't happened. Plus, I don't know if it'll really drop that far.
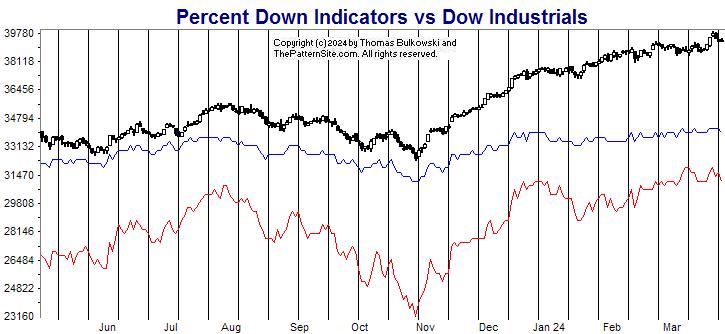
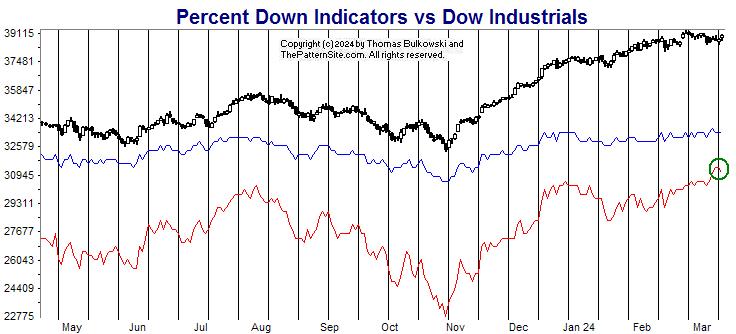
The red line is the percentage of stocks at least 20% below their 1-year high (plotted upside down). The blue line is the average percentage drop of stocks below their 1-year high (plotted upside down).
On Tuesday, 25% of stocks in my database are in bear market territory (down at least 20% from their 1-year high).A week ago, it was 25%.The fewest was 22% on 03/21/2024.And the most was 56% on 10/27/2023.
The 514 stocks in my database are down an average of 13% from their yearly high.A week ago, the average was 13%.The peak was 12% on 03/21/2024.And the bottom was 25% on 10/27/2023.
Both lines show no change from a week ago.
The overall trend, however, is upward from the November low.
Unless something changes, I expect the uptrend to continue. Just keep in mind that a retrace can begin at any time.
$ $ $
Here's a symbol list of 166 chart and candlestick patterns (13 "investment grade" candle patterns) found in today's securities using my version of Patternz: MMM, ANF, AES, ALGT, AEL, AXP, AR, AON, AMAT, ARCB, ADM, ASH, BMI, BIG, BIO, BKH, BA, CLS, CX, COR, CVX, CNX, CMTL, CAG, CONN, XRAY, FANG, DRQ, DTE, BOOM, EQT, EVH, XOM, FICO, FARO, FDX, FISV, FIVN, FLEX, FTNT, FCX, GNW, GFS, GL, GPRO, HLIT, HELE, HP, HD, HOV, ILMN, INCY, INFN, ITGR, TILE, JBLU, KLAC, KSS, LRCX, LAMR, LDOS, LEN, RAMP, LPLA, LXU, MTSI, MANH, MKTX, MGEE, MUR, NBR, NFG, NOV, NFLX, NTGR, NJR, NEE, NOVT, NVDA, OXY, OMCL, PKE, PTEN, PYPL, PXD, PFG, PEG, PSTG, QTWO, RRC, RTX, ROP, RGLD, RES, SLB, STR, SMAR, SCCO, LUV, SSYS, SUM, TGT, TDOC, TER, TXN, TTD, RIG, TZOO, TREX, TWLO, UIS, UPS, VECO, WRB, WOLF, ZBRA, IYM, IYE, IEZ, IDU, FTEC, FXI, QQQ, IYH, IYZ, IXC, MXI, IXN, IEO, EWA, EWK, ECH, EWG, EZA, QLD, SSO, ROBO, XLE, XLK, XLU, UNG, SMH, MGK, VONG. Click this link for details (pattern type, start and end dates).
For a list of small patterns (those a few days wide) click this link.
-- Thomas Bulkowski, author: Invest for Two-Comma Wealth (Ad)
![]()
$ $ $
I show another slider trading quiz featuring ascending broadening wedges.
$ $ $
Here's a symbol list of 131 chart and candlestick patterns (13 "investment grade" candle patterns) found in today's securities using my version of Patternz: ANF, A, ALL, DOX, AEP, AME, AMN, APH, ATR, ARW, ATO, ADP, BMI, BAX, BIIB, BKH, BKNG, BFH, BR, BBW, CPB, CX, CENX, CRL, CHKP, CHD, CNX, CL, COTY, XRAY, FANG, DFS, DSGR, DRQ, EBAY, ECL, EIX, EL, EVRG, EXPI, XOM, FARO, FDX, FISV, FIVN, FLEX, FTV, FNV, IT, GMS, GPRO, HE, HQY, HP, HWM, HUM, JBHT, ITW, ILMN, INFN, IIIN, ITGR, IPAR, IPG, JBLU, KALU, KFRC, LHX, LANC, MHO, MRCY, MGEE, MCO, MS, MUR, NJR, NEU, NKE, NVDA, OMC, OMI, PKG, PKE, PTEN, PEN, PXD, PSTG, RL, RRC, RJF, RGS, RHI, ROST, CRM, SBH, SEE, SKYW, SCCO, SWN, SXI, TGT, TFX, TTD, TKR, TJX, TZOO, TREX, VRSN, WAT, WERN, ZBRA, IYC, IGE, EWO, EWK, EWH, THD, PPA, DBA, XLF. Click this link for details (pattern type, start and end dates).
For a list of small patterns (those a few days wide) click this link.
$ $ $
The following table shows where Fibonacci retrace values of the day's high-low range are plus pivot points, calculated on the Dow industrials, sorted by value. When several are near each other (small differences), the area might act as support or resistance.
-- Thomas Bulkowski, author: Invest for Two-Comma Wealth (Ad)
![]()
| © 2024 ThePatternSite.com Metric | Value | Diff | Close (within 10% of the high-low range for the day)? |
| Monthly S2 | 37,629.95 | ||
| Weekly S2 | 38,192.90 | 562.95 | |
| Monthly S1 | 38,471.80 | 278.90 | |
| Weekly S1 | 38,753.27 | 281.47 | |
| Monthly Pivot | 39,180.42 | 427.15 | |
| Daily S2 | 39,212.47 | 32.05 | |
| Daily S1 | 39,263.05 | 50.58 | |
| Low | 39,296.03 | 32.98 | |
| Close | 39,313.64 | 17.61 | |
| Weekly Pivot | 39,321.16 | 7.52 | Yes! The Weekly Pivot is close to the Close. |
| Daily Pivot | 39,346.61 | 25.45 | |
| 61.8% Down from Intraday High | 39,347.27 | 0.66 | Yes! The 61.8% Down from Intraday High is close to the Daily Pivot. |
| 50% Down from Intraday High | 39,363.10 | 15.83 | |
| 38.2% Down from Intraday High | 39,378.93 | 15.83 | |
| Daily R1 | 39,397.20 | 18.27 | |
| Open | 39,410.54 | 13.34 | Yes! The Open is close to the Daily R1. |
| High | 39,430.17 | 19.63 | |
| Daily R2 | 39,480.75 | 50.58 | |
| Weekly R1 | 39,881.53 | 400.78 | |
| Monthly R1 | 40,022.27 | 140.73 | |
| Weekly R2 | 40,449.42 | 427.16 | |
| Monthly R2 | 40,730.89 | 281.47 |
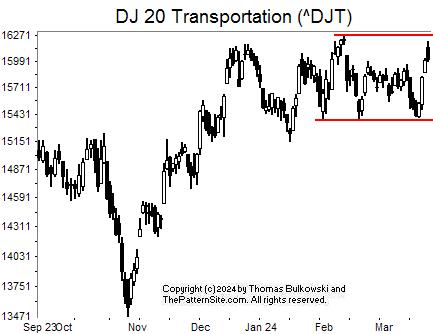
I show the Dow transports on the daily scale.
The chart doesn't show much happening. Indeed, the recent price movement has formed a rectangle top chart pattern.
That pattern sees price swing between the top and bottom of the rectangle, shown here by the two red lines.
Rectangle tops, according to the statistics, breakout upward 63% of the time. So that's the way to bet.
That's potentially good news for airline and other transport stocks.
![]()
The following is a brief review of how the markets performed over time. The numbers refer to the close-to-close move in the Dow industrials.
No options expire this week.
![]()
The following is based on an SFO article in December 2004 by John Seekinger, titled, "Take a two-dimensional approach." He offers these tips.
| Index | S2 | S1 | Pivot | R1 | R2 |
| Dow Industrials (^DJI): Daily | 39,235 | 39,355 | 39,590 | 39,711 | 39,945 |
| Weekly | 38,247 | 38,861 | 39,375 | 39,990 | 40,504 |
| Monthly | 37,684 | 38,580 | 39,235 | 40,130 | 40,785 |
| S&P500 (^GSPC): Daily | 5,220 | 5,227 | 5,237 | 5,244 | 5,253 |
| Weekly | 5,079 | 5,157 | 5,209 | 5,286 | 5,338 |
| Monthly | 4,832 | 5,033 | 5,147 | 5,348 | 5,462 |
| Nasdaq (^IXIC): Daily | 16,313 | 16,371 | 16,419 | 16,477 | 16,526 |
| Weekly | 15,720 | 16,074 | 16,307 | 16,661 | 16,894 |
| Monthly | 15,053 | 15,741 | 16,140 | 16,828 | 17,227 |
Here are the formulas:
![]()
Earnings season is over.
Here's a symbol list of 189 chart and candlestick patterns (13 "investment grade" candle patterns) found in today's securities using my version of Patternz: ANF, ABM, ACN, ACIW, A, DOX, AEP, AFG, AIG, AME, AMN, APH, ATR, ATO, ADP, AVY, AVNT, AVA, BSET, BAX, BERY, BBY, BIG, BIIB, BAH, BFH, BR, CACI, CALM, CE, CX, CNP, CENX, CF, CHKP, CIEN, CINF, CLF, CLX, CXW, CSGP, CCK, DECK, XRAY, DVN, DFS, DSGR, DUK, EBAY, EIX, ELV, EOG, EL, EVRG, EXC, EXPD, FDS, FARO, FDX, FMC, FTV, FCX, GME, IT, GPN, GL, GMS, GPRO, GFF, HE, HQY, HSII, HELE, HP, HSIC, HNI, HWM, JBHT, IDA, ITW, IBP, IIIN, IPAR, TILE, IPG, KFRC, LHX, LZB, LAMR, LEG, L, MHO, MGY, MAN, MRO, MRTN, MDC, MRCY, MCO, MS, MUR, NBR, NFG, NOV, NTAP, NOVT, OXY, ORI, OMCL, OMC, ASGN, OMI, PKG, PKE, PTEN, PAYX, PYPL, PEN, PETS, PFG, RL, RTX, RHI, R, CRM, SAIC, SEE, SEIC, SIGI, SHW, SO, SSYS, TFX, TPX, TKR, RIG, TRV, TZOO, SLCA, UGI, UIS, VRSN, WRB, WAT, WSO, WERN, IEZ, IAT, IYZ, IYF, THD, PPA, DBA, PXJ, XLF, VIS. Click this link for details (pattern type, start and end dates).
For a list of small patterns (those a few days wide) click this link.
The below industries were the best (rank 1) or worst performing of those I follow.
|
-- Thomas Bulkowski, author: Invest for Two-Comma Wealth (Ad)
![]()
If you're new to trading stocks, then consider buying a copy of my latest book, Invest for Two-Comma Wealth. I focus on investing and not trading. That's important. You can do both (invest and trade). Why not invest (buy and hold) and grow your net worth while you learn to trade? That's a type of diversification.
That reasoning also applies to traders who struggle to become profitable. You can buy an ETF like the QQQs while you trade to your heart's content.
If you're a seasoned trader, build your portfolio by investing in long-term hold securities (ETFs are my favorite).
Investing instead of trading removes the stress and the time-consuming day-to-day grind of watching price move up and down. Buy the QQQs and look at them once a quarter or year (or whatever). Wouldn't you like to become wealthy without the worry and stress of trading?
For those of you in retirement or approaching retirement. The actions you take before retirement can influence how much money you'll be taxed in retirement. I'm talking about IRMAA and NIIT. If you don't know what they are, then buy the book. The amount you may save is well worth the cost of the $20 book. You'll want to transition from owning individual stocks to ETFs or mutual funds so you can avoid single stock risk. That's important for both retirees and novices.
Click the link to start building your net worth. Buy Invest for Two-Comma Wealth.Price $20, soft cover, print only, 300+ pages.
![]()
$ $ $
Here's a symbol list of 194 chart and candlestick patterns (13 "investment grade" candle patterns) found in today's securities using my version of Patternz: ANF, ACN, AYI, AFL, APD, ALB, ALKS, ALL, AEE, AEO, AXP, AFG, APH, APA, APOG, ASH, AVA, BAX, BZH, BBY, BAH, BFH, BCO, BMY, BRKR, BLDR, CDNS, CALM, CPB, CX, CNP, CDAY, CF, CRL, CLF, CLX, CNO, CL, GLW, COTY, CR, CROX, DECK, DVN, DSGR, ^DJI, DUK, EMR, WIRE, EOG, EFX, EZPW, FARO, FAST, FISV, GFS, GL, GS, GOOGL, GPRO, GFF, GES, HBI, THG, HAYN, HP, HSIC, HNI, HD, DHI, JBHT, HURC, IDA, ILMN, INCY, INFN, IBP, IIIN, IBKR, TILE, IRM, JBLU, K, KFRC, LEN, LNC, LOW, MHO, MGY, MANH, MRO, MAS, MA, MGEE, MSFT, MCO, MS, MLI, MUR, MYGN, NTGR, NEE, NOC, NWPX, ORI, PKE, PRFT, PETS, PPL, PFG, QTWO, RL, RJF, REGN, ROL, ^GSPC, CRM, SAND, SLB, SCHW, SMG, SEE, SO, SCCO, SWX, SCS, SRDX, TPR, TGT, TER, TXT, TOL, RIG, TZOO, TG, TREX, SLCA, UIS, VC, WSO, WU, WPM, WSM, IAI, IYC, ITB, IEZ, DDM, FDN, IGV, IXC, ILF, EIS, EWJ, EWM, EWS, EWY, TUR, PPA, PBE, PEJ, SSO, XLY, XLF, XHB, XLI, SPY, XLK, VIS, VAW, MGK, VONG. Click this link for details (pattern type, start and end dates).
For a list of small patterns (those a few days wide) click this link.
$ $ $
You can find setups based on a Fibonacci retrace by clicking on the link.
The following patterns were found manually, not using Patternz. Mr. Bulkowski has excluded any securities he owns from appearing in the list. However, he may add any of the securities listed to his portfolio at any time, just as you can.
In the table below, the red and green colors are based on the historical breakout direction for the associated chart pattern. If a high and tight flag appears, the start and end dates highlight the flagpole only and not the flag.
For details about the chart patterns, click here.
-- Thomas Bulkowski, author: Invest for Two-Comma Wealth (Ad)
![]()
| Symbol | Chart Pattern | Bullish Bearish | Start | End | Industry |
| ACN | Double Top, Adam and Adam | 03/04/2024 | 03/07/2024 | IT Services | |
| ACIW | Triangle, symmetrical | 02/28/2024 | 03/19/2024 | IT Services | |
| DOX | Double Top, Adam and Adam | 03/08/2024 | 03/14/2024 | IT Services | |
| AMWD | Triple bottom | 03/05/2024 | 03/14/2024 | Building Materials | |
| AMN | Ugly double bottom | 02/26/2024 | 03/15/2024 | Human Resources | |
| APA | Triple bottom | 02/05/2024 | 02/23/2024 | Petroleum (Producing) | |
| BKNG | Double Bottom, Eve and Eve | 03/06/2024 | 03/15/2024 | Internet | |
| BAH | Double Top, Adam and Eve | 02/26/2024 | 03/04/2024 | IT Services | |
| BBW | Flag | 03/15/2024 | 03/21/2024 | Retail (Special Lines) | |
| CIEN | Pipe top | 02/26/2024 | 03/04/2024 | Telecom. Equipment | |
| CLX | Double Top, Adam and Eve | 02/02/2024 | 03/13/2024 | Household Products | |
| CNX | Ugly double bottom | 02/14/2024 | 03/12/2024 | Natural Gas (Diversified) | |
| GLW | Triangle, symmetrical | 01/23/2024 | 03/21/2024 | Telecom. Equipment | |
| CSGP | Ugly double bottom | 02/20/2024 | 03/07/2024 | Information Services | |
| CTS | Triangle, descending | 02/13/2024 | 03/20/2024 | Electronics | |
| DSGR | Pipe bottom | 03/04/2024 | 03/11/2024 | Metal Fabricating | |
| EPAM | Triple top | 02/16/2024 | 03/08/2024 | IT Services | |
| EXPI | Double Top, Adam and Adam | 02/29/2024 | 03/08/2024 | E-Commerce | |
| FDS | Double Top, Eve and Eve | 02/02/2024 | 03/20/2024 | Information Services | |
| GS | Roof, inverted | 02/22/2024 | 03/20/2024 | Securities Brokerage | |
| HUN | Double Top, Adam and Adam | 02/23/2024 | 03/07/2024 | Chemical (Specialty) | |
| INCY | Head-and-shoulders top | 02/13/2024 | 03/11/2024 | Drug | |
| IIIN | Double Bottom, Adam and Adam | 03/05/2024 | 03/14/2024 | Building Materials | |
| JNJ | Triple top | 02/23/2024 | 03/12/2024 | Medical Supplies | |
| KMT | Broadening bottom | 02/07/2024 | 03/19/2024 | Metal Fabricating | |
| LHX | Diamond top | 02/20/2024 | 03/14/2024 | Aerospace/Defense | |
| MRCY | Double Top, Adam and Eve | 02/14/2024 | 03/11/2024 | Computers and Peripherals | |
| MLKN | Roof, inverted | 02/27/2024 | 03/21/2024 | Furn/Home Furnishings | |
| MOS | Triangle, ascending | 02/22/2024 | 03/21/2024 | Chemical (Diversified) | |
| NTGR | Pipe bottom | 02/05/2024 | 02/12/2024 | Telecom. Equipment | |
| JWN | Double Bottom, Eve and Adam | 03/07/2024 | 03/18/2024 | Retail Store | |
| ON | Double Top, Adam and Adam | 02/12/2024 | 03/07/2024 | Semiconductor | |
| OTEX | Head-and-shoulders bottom | 02/21/2024 | 03/19/2024 | E-Commerce | |
| KWR | Triangle, symmetrical | 02/13/2024 | 03/19/2024 | Chemical (Specialty) | |
| RL | Pipe bottom | 03/04/2024 | 03/11/2024 | Apparel | |
| SCS | Scallop, descending | 02/29/2024 | 03/20/2024 | Furn/Home Furnishings | |
| UHAL | Triangle, symmetrical | 01/31/2024 | 03/20/2024 | Trucking/Transp. Leasing |
![]()
Since I post this the night before, check how the futures are trading before market open. Large moves can affect the opening direction.
$ $ $
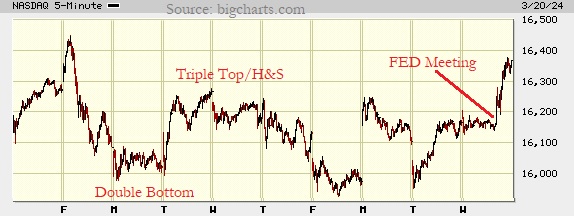
I show a picture of the Nasdaq composite on the 5-minute scale.
This is a complicated chart, so let's go through it from left to right.
We see a double bottom Monday and Tuesday. After it confirmed (that is, after price closed above the peak between the two bottoms), the index made a good move higher to the triple top.
The triple top is a three peak pattern, with all three peaks near the same price. You might want to label this a head-and-shoulders top. Often with triple tops, the center peak is slightly below the other two (but not in this case).
Regardless of what you call this pattern, it's bearish and down the index tumbles.
There's a triple bottom, which I didn't call out, on Friday to Tuesday. I do show the results of the market reaction after the FED meeting.
Such a strong move higher suggests to me that the market will retrace (some of the move up) tomorrow (Thursday). After that, it'll probably resume going higher.
$ $ $
Here's a symbol list of 145 chart and candlestick patterns (13 "investment grade" candle patterns) found in today's securities using my version of Patternz: MMM, ANF, AXDX, AMD, AFL, APD, DOX, AEL, APH, AR, APOG, ARCB, ACGL, ADM, ASH, AGO, ATO, ADSK, BALL, BAX, BZH, BBY, BOOT, BAH, BR, BLDR, CACI, CALM, CPB, CENX, CTAS, CNO, CNX, CMCO, GLW, CROX, CSGS, CTS, CMI, DVN, DDS, DSGR, ^DJI, DRQ, DUK, EXP, ELV, EOG, EFX, FFIV, FDS, FDX, FNV, FRD, GME, GMS, GS, GPRO, GES, THG, HLIT, HAYN, HP, HON, IDA, IBP, IIIN, INTC, IPAR, KBH, KMT, KFRC, LEG, LEN, LNC, MHO, MAN, MCHX, MAS, MTRN, MUR, MYGN, NTGR, NTAP, NJR, NKE, JWN, ASGN, OXM, PKE, PHM, QCOM, RL, RRC, RGA, RHI, ROL, R, SAND, SEE, SCI, SLGN, SWX, SWN, SR, TPX, TTD, TOL, RIG, TZOO, UIS, MDRX, VC, WRB, WMT, WU, WSC, IYC, IEZ, DDM, FDN, IAT, IEV, ILF, SLV, EWK, EWQ, IBB, DBA, PBE, PEJ, XLY, XRT, XLK. Click this link for details (pattern type, start and end dates).
For a list of small patterns (those a few days wide) click this link.
$ $ $
The following table shows where Fibonacci retrace values of the day's high-low range are plus pivot points, calculated on the Nasdaq composite, sorted by value. When several are near each other (small differences), the area might act as support or resistance.
-- Thomas Bulkowski, author: Invest for Two-Comma Wealth (Ad)
![]()
| © 2024 ThePatternSite.com Metric | Value | Diff | Close (within 10% of the high-low range for the day)? |
| Monthly S2 | 15,092.20 | ||
| Monthly S1 | 15,730.81 | 638.60 | |
| Weekly S2 | 15,840.72 | 109.91 | |
| Daily S2 | 16,041.48 | 200.77 | |
| Monthly Pivot | 16,090.25 | 48.77 | |
| Weekly S1 | 16,105.06 | 14.81 | Yes! The Weekly S1 is close to the Monthly Pivot. |
| Low | 16,127.48 | 22.42 | Yes! The Low is close to the Weekly S1. |
| Open | 16,185.76 | 58.28 | |
| Weekly Pivot | 16,190.26 | 4.50 | Yes! The Weekly Pivot is close to the Open. |
| Daily S1 | 16,205.45 | 15.19 | Yes! The Daily S1 is close to the Weekly Pivot. |
| 61.8% Down from Intraday High | 16,222.96 | 17.52 | Yes! The 61.8% Down from Intraday High is close to the Daily S1. |
| 50% Down from Intraday High | 16,252.46 | 29.50 | |
| 38.2% Down from Intraday High | 16,281.96 | 29.50 | |
| Daily Pivot | 16,291.44 | 9.49 | Yes! The Daily Pivot is close to the 38.2% Down from Intraday High. |
| Close | 16,369.41 | 77.97 | |
| High | 16,377.44 | 8.03 | Yes! The High is close to the Close. |
| Weekly R1 | 16,454.60 | 77.16 | |
| Daily R1 | 16,455.41 | 0.80 | Yes! The Daily R1 is close to the Weekly R1. |
| Weekly R2 | 16,539.80 | 84.39 | |
| Daily R2 | 16,541.40 | 1.61 | Yes! The Daily R2 is close to the Weekly R2. |
| Monthly R1 | 16,728.86 | 187.46 | |
| Monthly R2 | 17,088.30 | 359.45 |
This is a picture of the chart pattern indicator on the daily scale. The indicator is the line chart below a chart of the S&P 500 composite.
The CPI is in the neutral zone, as the white vertical bars on the far right of the chart shows.
It means the index is moving sideways, looking for a direction. It could be that the market was waiting for the FED to keep interest rates the same. I see that the markets closed up today (Tuesday). It's a two-day meeting so we'll see tomorrow.
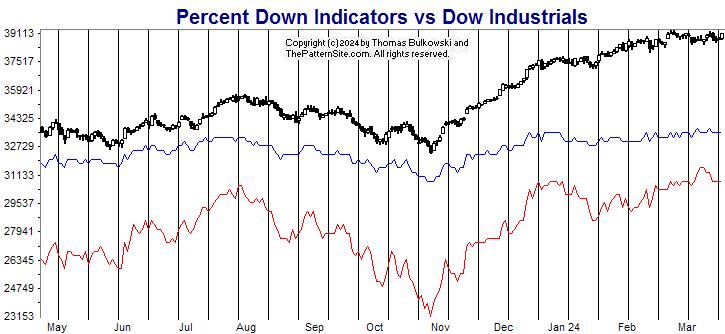
The red line is the percentage of stocks at least 20% below their 1-year high (plotted upside down). The blue line is the average percentage drop of stocks below their 1-year high (plotted upside down).
On Tuesday, 25% of stocks in my database are in bear market territory (down at least 20% from their 1-year high).A week ago, it was 23%.The fewest was 22% on 03/11/2024.And the most was 56% on 10/27/2023.
The 514 stocks in my database are down an average of 13% from their yearly high.A week ago, the average was 13%.The peak was 13% on 03/07/2024.And the bottom was 25% on 10/27/2023.
The red line is worse this week compared to a week ago, but the blue line held steady.
This past week the red line made a new high (the highest peak on the chart). It's about time. That's quite a recovery from the October 2023 low.
What does this all mean? I'm not sure. Both charts are neutral, I think. The CPI chart is showing weakness (no longer bullish). This chart shows the red line trending higher over the past year. Let's see what the FED says.
$ $ $
Here's a symbol list of 125 chart and candlestick patterns (13 "investment grade" candle patterns) found in today's securities using my version of Patternz: ANF, ACIW, AMD, AFL, APD, ATSG, AKAM, AMZN, AMED, AMWD, APOG, AGO, BCPC, BAX, BIO, CBT, CAL, CVX, CLF, CLX, CNO, CGNX, CMTL, CONN, CXW, CW, DVN, FANG, DDS, DSGR, DRQ, BOOM, EMN, EBAY, EMR, FAST, FORM, GME, GD, GFS, HAYN, HL, HP, HNI, HD, HOV, HUN, IDA, IBP, IIIN, INTC, IPAR, IPG, IPI, KALU, KBH, KFRC, KLAC, LEG, LDOS, LXU, M, MLM, MTDR, MTRN, MDC, MRK, NBR, NOV, NTAP, NJR, NEU, NWPX, ASGN, PATK, PRFT, PCG, PEG, RL, RMBS, RRC, RTX, RGLD, RES, SLB, SEE, SCI, SKYW, SWX, SUM, TDC, TXN, RIG, TZOO, TG, UHAL, WRB, WU, IHE, SOXX, IGE, IEO, IYF, EEM, EWH, EWY, EWL, THD, PPA, PBE, PJP, SSO, XLE, SPY, MGK, VONG. Click this link for details (pattern type, start and end dates).
For a list of small patterns (those a few days wide) click this link.
-- Thomas Bulkowski, author: Invest for Two-Comma Wealth (Ad)
![]()
I released a new stock market book titled, Invest for Two-Comma Wealth (Ad). It's available from Amazon.com at the link.
Invest for Two-Comma Wealth ($1,000,000) is an entry-level yet comprehensive book about investing in the securities markets to grow your net worth. From annuities, bonds, and CDs, to common stocks, meme stocks, and cryptocurrency, the book explains each topic in an easy-to-understand manner.
It teaches you about scams, and how to avoid them, including those “free” lunch seminars that try to sell you something, either immediately or months later. It explains why owning your home may not be a good investment and buying gold coins with huge sales charges put you at a disadvantage.
Follow Susan as she does everything right and Basketcase Bob who serves as an example of what not to do.
If knowledge is the way to wealth, then this book is for you. Use the information in this book to invest for the long term and discover that one day you’ve joined the two-comma club.
Price $20, soft cover, print only, 300+ pages.
Here's an abbreviated list of contents.
-- Thomas Bulkowski, author: Invest for Two-Comma Wealth (Ad)
![]()
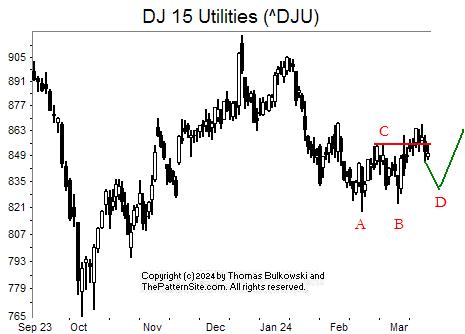
I show the Dow utilities on the daily scale.
A double bottom appears at AB. It confirms as a valid chart pattern when the index closes above the red line, which connects the highest peak between the two bottoms.
When confirmed, it becomes a valid chart pattern, suggesting a rise in price.
However, I'm looking for the index to retrace following the green line. This idea is to form a complex head-and-shoulders bottom, with two heads at AB, a left shoulder during the January low, and a new right shoulder yet to appear (D).
I don't know if this will play out, but it's worth watching.
![]()
The following is a brief review of how the markets performed over time. The numbers refer to the close-to-close move in the Dow industrials.
No options expire this week.
![]()
The following is based on an SFO article in December 2004 by John Seekinger, titled, "Take a two-dimensional approach." He offers these tips.
| Index | S2 | S1 | Pivot | R1 | R2 |
| Dow Industrials (^DJI): Daily | 38,444 | 38,579 | 38,754 | 38,889 | 39,064 |
| Weekly | 38,081 | 38,398 | 38,800 | 39,117 | 39,519 |
| Monthly | 37,437 | 38,076 | 38,679 | 39,318 | 39,921 |
| S&P500 (^GSPC): Daily | 5,087 | 5,102 | 5,119 | 5,135 | 5,152 |
| Weekly | 5,041 | 5,079 | 5,129 | 5,168 | 5,218 |
| Monthly | 4,807 | 4,962 | 5,076 | 5,231 | 5,345 |
| Nasdaq (^IXIC): Daily | 15,855 | 15,914 | 15,985 | 16,044 | 16,114 |
| Weekly | 15,709 | 15,841 | 16,058 | 16,190 | 16,408 |
| Monthly | 14,960 | 15,467 | 15,958 | 16,465 | 16,956 |
Here are the formulas:
![]()
Earnings season is over.
Here's a symbol list of 181 chart and candlestick patterns (13 "investment grade" candle patterns) found in today's securities using my version of Patternz: DDD, MMM, ABT, ABM, AXDX, ACN, ACIW, AFL, ALB, AA, ALL, DOX, AMED, AMWD, APH, ANIK, APOG, ACGL, ADM, AWI, ASH, AIZ, BMI, BCPC, BSET, BECN, BERY, BBY, BIG, BR, BG, CAL, CPB, CX, CIEN, CSCO, CNO, CNX, CTSH, CL, CMCO, ED, CSGP, CW, DFS, DRQ, EMN, ECL, WIRE, EVRG, FLEX, FTNT, FDP, GIS, GNW, GMS, GS, HLIT, HIG, HQY, HP, HSIC, HOLX, HWM, JBHT, IDA, ITW, IIIN, IPAR, JKHY, KALU, KFRC, LNC, LXU, MCHX, MTRX, MU, MLKN, MOS, MLI, NOV, NFLX, NWL, NOC, NWPX, NUS, ORI, OLN, OMCL, PKE, PATK, PDCO, PEN, PLXS, PFG, PRU, RJF, RTX, RGA, RLI, ROL, RES, CRM, SAND, SCHW, SMG, SEE, SEIC, STR, SMAR, SCCO, SPLK, SXI, SCS, SRDX, TECH, TDY, TKR, TSCO, TZOO, TG, SLCA, UGI, VFC, VLO, VECO, MDRX, VRTX, WRB, WMT, WAT, WLK, WMB, WWW, WWD, ZBRA, IYC, IHE, QTEC, FXL, FXI, IGV, SLV, EWA, EWK, EEM, EWG, EWH, EWJ, EWM, EPP, EZA, EWY, EWP, EWL, TUR, PEJ, PXJ, XLY, XLF. Click this link for details (pattern type, start and end dates).
For a list of small patterns (those a few days wide) click this link.
The below industries were the best (rank 1) or worst performing of those I follow.
|
-- Thomas Bulkowski
![]()
$ $ $
Here's a symbol list of 142 chart and candlestick patterns (13 "investment grade" candle patterns) found in today's securities using my version of Patternz: DDD, ADTN, AES, ALB, ALKS, DOX, AMED, AIG, AMWD, AMN, APH, AAPL, ATO, ADSK, AVA, BSET, BIG, BAH, BBW, BLDR, CACI, CX, CNC, CDAY, CF, CRL, CIEN, CSCO, CNX, CTSH, CMCO, CONN, COP, CXW, DFS, EMN, WIRE, EFX, EXC, FISV, FIVN, FLS, FORM, IT, GMS, GS, GFF, HLIT, HQY, HNI, JBHT, HUN, ITW, PODD, TILE, IPI, IRM, JKHY, KMT, KFRC, LHX, LAMR, LEG, LPLA, MCHX, MKTX, MRTN, MA, MDT, META, NKE, NUS, OXM, PATK, PDCO, PEN, PETS, PHM, RTX, RGS, ROK, ROP, ROST, R, SLB, SEE, SEIC, SIGI, SWX, SPLK, SCS, SRDX, TDY, TFX, TDC, TTD, TKR, UPS, VFC, VLO, VECO, VEEV, MDRX, VRTX, V, VMC, WMT, WSO, WSC, WWD, IYK, IYC, IDU, IEO, EEM, EWQ, EWJ, EWS, EWY, TUR, PPA, DBA, PBE, PEJ, PHO, XLY, XLF, XLI, XAR, USO, VIS. Click this link for details (pattern type, start and end dates).
For a list of small patterns (those a few days wide) click this link.
$ $ $
You can find setups based on a Fibonacci retrace by clicking on the link.
The following patterns were found manually, not using Patternz. Mr. Bulkowski has excluded any securities he owns from appearing in the list. However, he may add any of the securities listed to his portfolio at any time, just as you can.
In the table below, the red and green colors are based on the historical breakout direction for the associated chart pattern. If a high and tight flag appears, the start and end dates highlight the flagpole only and not the flag.
For details about the chart patterns, click here.
-- Thomas Bulkowski
![]()
| Symbol | Chart Pattern | Bullish Bearish | Start | End | Industry |
| MMM | Double Bottom, Eve and Eve | 02/20/2024 | 03/04/2024 | Diversified Co. | |
| ADBE | Double Bottom, Eve and Eve | 02/20/2024 | 03/06/2024 | Computer Software and Svcs | |
| ALK | Double Bottom, Adam and Adam | 03/04/2024 | 03/11/2024 | Air Transport | |
| AZTA | Double Top, Adam and Adam | 03/04/2024 | 03/08/2024 | Semiconductor Cap Equip. | |
| BECN | Diamond top | 02/14/2024 | 03/14/2024 | Retail Building Supply | |
| BERY | Ugly double bottom | 02/07/2024 | 02/28/2024 | Packaging and Container | |
| BIG | Pipe top | 02/26/2024 | 03/04/2024 | Retail Store | |
| BKH | Double Bottom, Eve and Eve | 01/19/2024 | 02/07/2024 | Electric Utility (West) | |
| CNP | Head-and-shoulders bottom | 01/24/2024 | 03/01/2024 | Electric Utility (Central) | |
| CSCO | Double Bottom, Eve and Adam | 02/20/2024 | 03/01/2024 | Computers and Peripherals | |
| CLF | Head-and-shoulders top | 03/01/2024 | 03/13/2024 | Metals and Mining (Div.) | |
| CNX | Double Bottom, Eve and Eve | 01/18/2024 | 02/14/2024 | Natural Gas (Diversified) | |
| CMTL | Dead-cat bounce | 03/13/2024 | 03/13/2024 | Telecom. Equipment | |
| CSGS | Double Top, Adam and Eve | 02/12/2024 | 02/28/2024 | IT Services | |
| ^DJU | Double Bottom, Adam and Adam | 02/13/2024 | 03/01/2024 | None | |
| ^DJT | Triangle, symmetrical | 02/20/2024 | 03/11/2024 | None | |
| EFX | Double Top, Adam and Eve | 02/29/2024 | 03/08/2024 | Information Services | |
| FICO | Double Top, Eve and Eve | 02/09/2024 | 03/08/2024 | IT Services | |
| FARO | Triple top | 01/30/2024 | 02/28/2024 | Precision Instrument | |
| FLS | Triangle, symmetrical | 02/16/2024 | 03/05/2024 | Machinery | |
| GME | Broadening top, right-angled and descending | 01/17/2024 | 02/26/2024 | Retail (Special Lines) | |
| HUBG | Double Top, Eve and Eve | 12/26/2023 | 01/23/2024 | Trucking/Transp. Leasing | |
| HURC | Dead-cat bounce | 03/08/2024 | 03/08/2024 | Machinery | |
| IDA | Double Bottom, Adam and Adam | 02/14/2024 | 03/01/2024 | Electric Utility (West) | |
| IDXX | Double Top, Eve and Eve | 02/06/2024 | 03/01/2024 | Drug | |
| IPG | Double Bottom, Adam and Adam | 02/09/2024 | 03/01/2024 | Advertising | |
| KFRC | Double Top, Adam and Adam | 03/04/2024 | 03/08/2024 | Human Resources | |
| KMB | Broadening bottom | 12/13/2023 | 03/13/2024 | Household Products | |
| M | Double Bottom, Adam and Adam | 01/19/2024 | 02/29/2024 | Retail Store | |
| MRO | Triple bottom | 01/18/2024 | 02/13/2024 | Petroleum (Integrated) | |
| MLI | Diamond top | 02/27/2024 | 03/13/2024 | Metal Fabricating | |
| NBR | Double Bottom, Adam and Adam | 02/05/2024 | 02/13/2024 | Oilfield Svcs/Equipment | |
| ^IXIC | Diamond top | 02/23/2024 | 03/14/2024 | None | |
| NOC | Triangle, descending | 02/26/2024 | 03/14/2024 | Aerospace/Defense | |
| OLN | Triple bottom | 02/05/2024 | 02/20/2024 | Chemical (Basic) | |
| OMC | Pipe bottom | 02/05/2024 | 02/12/2024 | Advertising | |
| PTEN | Double Top, Eve and Eve | 02/16/2024 | 03/08/2024 | Oilfield Svcs/Equipment | |
| POR | Head-and-shoulders bottom | 01/24/2024 | 03/01/2024 | Electric Utility (West) | |
| PRU | Triangle, symmetrical | 02/15/2024 | 03/01/2024 | Insurance (Life) | |
| QCOM | Pipe bottom | 01/29/2024 | 02/05/2024 | Telecom. Equipment | |
| ROP | Triangle, symmetrical | 01/30/2024 | 03/14/2024 | Industrial Services | |
| SLB | Head-and-shoulders bottom | 01/30/2024 | 02/28/2024 | Oilfield Svcs/Equipment | |
| SRE | Head-and-shoulders bottom | 01/24/2024 | 03/04/2024 | Electric Utility (West) | |
| STR | Ugly double bottom | 02/05/2024 | 02/23/2024 | Natural Gas (Diversified) | |
| LUV | Triple top | 02/22/2024 | 03/08/2024 | Air Transport | |
| TPX | Broadening top | 02/29/2024 | 03/13/2024 | Furn/Home Furnishings | |
| RIG | Pipe bottom | 02/20/2024 | 02/26/2024 | Oilfield Svcs/Equipment | |
| TREX | Diamond top | 03/04/2024 | 03/14/2024 | Building Materials | |
| VECO | Pipe top | 02/26/2024 | 03/04/2024 | Precision Instrument | |
| WPM | Pipe bottom | 02/20/2024 | 02/26/2024 | Metals and Mining (Div.) |
![]()
Since I post this the night before, check how the futures are trading before market open. Large moves can affect the opening direction.
$ $ $
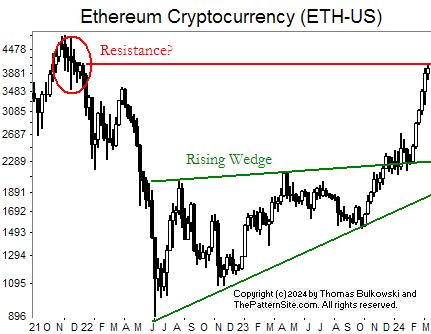
I show a picture of the Ethereum (ETH-USD) on the weekly scale.
Ethereum is a cryptocurrency. A rising wedge appears highlighted in green on the chart. Those breakout downward most often. In this case, the breakout was upward and it led to a strong rally.
I drew a red line from the current price backward in time to the left, just so I could see where it lines up with overhead resistance (circled in red). The crypto is right in the middle of resistance. That means the upward run could stall, even reverse.
However, the trend upward over the last two weeks or so is strong. It might continue. I'd like to say that the rally is overextended, and it is, but these upward runs can last longer than we imagine.
So, yes, I think the upward move will continue.
$ $ $
Here's a symbol list of 137 chart and candlestick patterns (13 "investment grade" candle patterns) found in today's securities using my version of Patternz: DDD, ABM, AXDX, ADTN, AES, ATSG, ALB, ALGT, AEP, AEL, AMWD, APA, ADSK, AVY, AVA, BAX, BZH, BIG, BIO, BA, BSX, BFH, CDNS, CX, CDAY, CF, CRL, CVX, CIEN, CMTL, COP, CROX, DVN, FANG, DDS, DSGR, DOV, BOOM, EMN, WIRE, EOG, EXC, FIVN, FTNT, FCX, GPS, GNW, GL, GFF, GES, HE, HP, DHI, PODD, IPG, JAZZ, KMB, LHX, LEN, MGY, MRO, MCHX, MTDR, MTRX, MDT, MUR, NOV, NEE, NTNX, OXY, ASGN, ORCL, PATK, PEN, PETS, PINC, PSTG, KWR, RCKY, ROG, ROP, ROST, RES, SBH, SAND, SLB, SEE, STR, SCCO, LUV, SWN, SPLK, SRDX, TRGP, TFX, RIG, UPS, UNH, VLO, VECO, MDRX, WRB, WU, WSM, WWW, IYK, IYE, IEZ, IEV, IXC, MXI, IGE, IEO, EWO, EWC, ECH, EWQ, EWH, EWI, EPP, EWS, EZA, EWP, EWD, TUR, EWU, PXJ, XLE, XLB, VHT. Click this link for details (pattern type, start and end dates).
For a list of small patterns (those a few days wide) click this link.
$ $ $
The following table shows where Fibonacci retrace values of the day's high-low range are plus pivot points, calculated on the Nasdaq composite, sorted by value. When several are near each other (small differences), the area might act as support or resistance.
-- Thomas Bulkowski
![]()
| © 2024 ThePatternSite.com Metric | Value | Diff | Close (within 10% of the high-low range for the day)? |
| Monthly S2 | 15,028.32 | ||
| Weekly S2 | 15,576.30 | 547.97 | |
| Monthly S1 | 15,603.05 | 26.75 | |
| Weekly S1 | 15,877.03 | 273.99 | |
| Monthly Pivot | 16,026.37 | 149.34 | |
| Daily S2 | 16,094.84 | 68.47 | |
| Daily S1 | 16,136.31 | 41.46 | |
| Low | 16,143.34 | 7.03 | Yes! The Low is close to the Daily S1. |
| Weekly Pivot | 16,163.37 | 20.03 | |
| 61.8% Down from Intraday High | 16,177.71 | 14.34 | |
| Close | 16,177.77 | 0.06 | Yes! The Close is close to the 61.8% Down from Intraday High. |
| Daily Pivot | 16,184.80 | 7.03 | Yes! The Daily Pivot is close to the Close. |
| 50% Down from Intraday High | 16,188.32 | 3.52 | Yes! The 50% Down from Intraday High is close to the Daily Pivot. |
| 38.2% Down from Intraday High | 16,198.94 | 10.62 | |
| Open | 16,220.11 | 21.17 | |
| Daily R1 | 16,226.27 | 6.16 | Yes! The Daily R1 is close to the Open. |
| High | 16,233.30 | 7.03 | Yes! The High is close to the Daily R1. |
| Daily R2 | 16,274.76 | 41.46 | |
| Weekly R1 | 16,464.10 | 189.34 | |
| Monthly R1 | 16,601.10 | 136.99 | |
| Weekly R2 | 16,750.44 | 149.34 | |
| Monthly R2 | 17,024.42 | 273.99 |
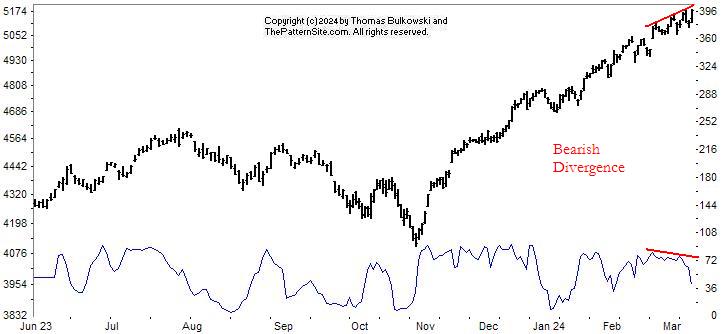
This is a picture of the chart pattern indicator on the daily scale. The indicator is the line chart below a chart of the S&P 500 composite.
This week the charts are a little confusing.
Even though the indices made a big move today (Dow industrials up 235 points, Nasdaq up 246), the CPI fell. That's quite a drop.
There's also bearish divergence where the CPI has been trending lower even as the index rises. Of course, you can argue that the two have been diverging for months now. It suggests the index is going to retrace but it doesn't tell when. Indeed, it might not happen at all or the drop may not be significant.
The red line is the percentage of stocks at least 20% below their 1-year high (plotted upside down). The blue line is the average percentage drop of stocks below their 1-year high (plotted upside down).
On Tuesday, 23% of stocks in my database are in bear market territory (down at least 20% from their 1-year high).A week ago, it was 26%.The fewest was 22% on 03/11/2024.And the most was 56% on 10/27/2023.
The 516 stocks in my database are down an average of 13% from their yearly high.A week ago, the average was 14%.The peak was 13% on 03/07/2024.And the bottom was 25% on 10/27/2023.
This chart shows the red line drops today, which is weird given that the indices climbed.
Both red and blue lines show improvement this week.
The prior chart is bearish (the divergence forecasts a downturn) but this chart is bullish. Of the two charts, the CPI is more important. I guess what we can say is that the trend will end when it ends.
$ $ $
Here's a symbol list of 123 chart and candlestick patterns (13 "investment grade" candle patterns) found in today's securities using my version of Patternz: DDD, MMM, ADTN, AEIS, ATSG, ALRM, ALB, AXP, AMWD, APH, APA, ADM, ANET, BERY, BIG, BIO, BMRN, BA, BMY, BRKR, CAL, CX, CNC, CENX, CIEN, CLNE, CLX, CL, COTY, DECK, XRAY, EMN, WIRE, EOG, EQT, EXPD, EZPW, FE, FLEX, FDP, GME, GD, GOOGL, GFF, HE, HUBG, ILMN, NSP, PODD, IPAR, IPG, JKHY, JBLU, KBH, KEYS, LNC, LXU, MCHX, META, MOS, MYGN, NFLX, NEU, NWPX, ORCL, PKE, PATK, PETS, PLXS, PINC, CRM, SAIC, SEE, SMTC, NOW, SKX, SWN, SRDX, TTD, TOL, UHAL, VECO, MDRX, VRTX, WRB, WU, WSC, IYK, IEZ, DDM, FXI, IGV, IXC, MXI, IEO, ECH, EEM, EWH, EIS, EWM, EWW, EWY, EWD, EWL, EWT, TUR, EWU, IBB, PHO, XLI. Click this link for details (pattern type, start and end dates).
For a list of small patterns (those a few days wide) click this link.
-- Thomas Bulkowski
![]()
$ $ $
I show another slider trading quiz featuring broadening formation, right angled and ascending.
$ $ $
Here's a symbol list of 178 chart and candlestick patterns (13 "investment grade" candle patterns) found in today's securities using my version of Patternz: ADTN, AFL, ATSG, ALK, AA, AFG, AIG, APH, APA, AAPL, ATR, ARCB, ANET, ARW, BBY, BIG, BIO, BA, BMY, BR, BBW, BLDR, CACI, CDNS, CPB, CX, CNP, CI, CLNE, CL, CMTL, COST, CCK, CW, DFS, DOV, EPAM, EQT, EXC, EXPD, FFIV, FISV, FIVN, FLS, FMC, FORM, FCX, FRD, GPS, GIS, GNW, GFS, GGG, HE, HSIC, HSY, HON, DHI, HOV, HWM, HUM, HURC, IDXX, NSP, ITGR, JBLU, KALU, KEYS, LH, L, MTSI, MCHX, MAS, MDT, MRK, MU, ^IXIC, NFG, NOV, NTGR, NJR, NI, JWN, NUS, NVDA, ORI, ORCL, PKE, PEN, PFE, PPL, PRU, KWR, DGX, RL, RMBS, RGS, RGA, RNG, ROP, RES, ^GSPC, SAND, SLB, SRE, SMTC, SHW, SKYW, SO, LUV, SR, SPSC, SRDX, TRGP, TDOC, TPX, RIG, TRV, TREX, UGI, MDRX, VRTX, WRB, WEX, WPM, WSC, WOLF, XEL, ITB, IEZ, IHE, IDU, FTEC, FXL, BOTZ, QQQ, IHF, IXC, IXN, ILF, SOXX, IYF, EWO, EWZ, EIS, EWI, EWJ, EWM, QLD, PPA, DBA, PBE, PXJ, PHO, SSO, XLE, XHB, XLI, SPY, XAR, XLK, XLU, SMH, VIS, VONG. Click this link for details (pattern type, start and end dates).
For a list of small patterns (those a few days wide) click this link.
$ $ $
The following table shows where Fibonacci retrace values of the day's high-low range are plus pivot points, calculated on the Dow industrials, sorted by value. When several are near each other (small differences), the area might act as support or resistance.
-- Thomas Bulkowski
![]()
| © 2024 ThePatternSite.com Metric | Value | Diff | Close (within 10% of the high-low range for the day)? |
| Monthly S2 | 37,454.85 | ||
| Monthly S1 | 38,112.25 | 657.41 | |
| Weekly S2 | 38,141.75 | 29.50 | Yes! The Weekly S2 is close to the Monthly S1. |
| Daily S2 | 38,371.05 | 229.29 | |
| Weekly S1 | 38,455.71 | 84.66 | |
| Low | 38,483.25 | 27.54 | Yes! The Low is close to the Weekly S1. |
| Daily S1 | 38,570.35 | 87.10 | |
| 61.8% Down from Intraday High | 38,602.25 | 31.89 | |
| 50% Down from Intraday High | 38,639.00 | 36.76 | |
| Open | 38,667.21 | 28.21 | Yes! The Open is close to the 50% Down from Intraday High. |
| 38.2% Down from Intraday High | 38,675.76 | 8.55 | Yes! The 38.2% Down from Intraday High is close to the Open. |
| Daily Pivot | 38,682.56 | 6.80 | Yes! The Daily Pivot is close to the 38.2% Down from Intraday High. |
| Monthly Pivot | 38,697.27 | 14.71 | Yes! The Monthly Pivot is close to the Daily Pivot. |
| Close | 38,769.66 | 72.39 | |
| Weekly Pivot | 38,771.79 | 2.13 | Yes! The Weekly Pivot is close to the Close. |
| High | 38,794.76 | 22.98 | Yes! The High is close to the Weekly Pivot. |
| Daily R1 | 38,881.86 | 87.10 | |
| Daily R2 | 38,994.07 | 112.20 | |
| Weekly R1 | 39,085.74 | 91.67 | |
| Monthly R1 | 39,354.67 | 268.93 | |
| Weekly R2 | 39,401.81 | 47.14 | |
| Monthly R2 | 39,939.69 | 537.88 |
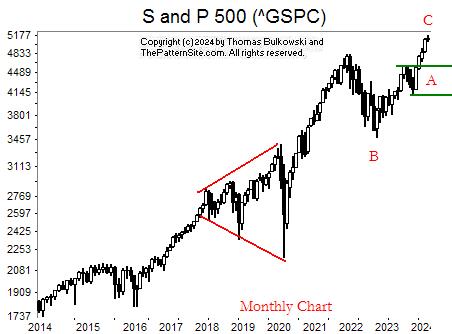
This is a chart of the S&P 500 index on the monthly scale, for a change. The daily chart shows the index climbing in a straight-line run.
I picked this scale to show something interesting.
A nicely-shaped broadening top chart pattern appears on the chart highlight in red. A nice up move happened after the pattern completed.
Recently, we see a new chart pattern called a measured move up. That's the move from B to C (wherever it tops out) with a corrective phase A.
I expect the index to retrace back to somewhere between the two green lines (C) but don't know when it might happen. Of course, it might not happen at all but the stats say it will.
Sometime . . .
![]()
The following is a brief review of how the markets performed over time. The numbers refer to the close-to-close move in the Dow industrials.
Many options expire this week, so traders will be looking to close out their positions, and that suggests increased volatility (large daily price swings).
![]()
The following is based on an SFO article in December 2004 by John Seekinger, titled, "Take a two-dimensional approach." He offers these tips.
| Index | S2 | S1 | Pivot | R1 | R2 |
| Dow Industrials (^DJI): Daily | 38,534 | 38,628 | 38,800 | 38,894 | 39,066 |
| Weekly | 38,126 | 38,424 | 38,756 | 39,054 | 39,386 |
| Monthly | 37,439 | 38,081 | 38,682 | 39,323 | 39,924 |
| S&P500 (^GSPC): Daily | 5,072 | 5,098 | 5,143 | 5,169 | 5,215 |
| Weekly | 4,991 | 5,057 | 5,123 | 5,190 | 5,256 |
| Monthly | 4,806 | 4,965 | 5,077 | 5,236 | 5,348 |
| Nasdaq (^IXIC): Daily | 15,808 | 15,947 | 16,198 | 16,337 | 16,588 |
| Weekly | 15,545 | 15,815 | 16,132 | 16,402 | 16,720 |
| Monthly | 14,997 | 15,541 | 15,995 | 16,539 | 16,994 |
Here are the formulas:
![]()
Earnings season is over.
Here's a symbol list of 173 chart and candlestick patterns (13 "investment grade" candle patterns) found in today's securities using my version of Patternz: AYI, ADTN, A, ATSG, ALK, ALB, ALKS, AEL, APH, APA, ATR, ARCB, ADM, ANET, ASH, BMI, BIG, BOOT, BRC, BR, BLDR, BG, CACI, CDNS, CAL, CF, CRL, CSCO, CLF, CL, COP, COTY, CROX, CCK, CW, ^DJT, DOV, DUK, EPAM, EL, EXPD, FICO, FLS, FORM, FTNT, FWRD, GPS, GE, GIS, GGG, HAYN, HSII, HSIC, HSY, HOLX, HON, DHI, HOV, HWM, HURC, ITGR, INTC, JBLU, KEYS, KFRC, KMB, LEG, LEN, MTSI, MANH, MCHX, MAS, MTRN, MTRX, MGEE, MU, MOS, ^IXIC, NFG, NOV, NWPX, NVDA, ASGN, OXM, PEN, PRFT, PEG, RL, RMBS, REGN, RNG, RES, ^GSPC, SAIA, SAND, SMG, SIGI, SMTC, SHW, SKYW, SMAR, SO, LUV, SPLK, SPSC, SUM, SRDX, SNPS, TGT, TECH, TDY, TPX, TER, TXT, RIG, TREX, TWLO, WAT, WLK, WPM, WOLF, WWD, ITB, FTEC, FDN, FXL, BOTZ, QQQ, IGV, MXI, IXN, ILF, SOXX, EWO, EWZ, ECH, EIS, EWI, EWJ, EPP, EWS, EWY, EWD, EWL, THD, TUR, QLD, PPA, PXJ, PHO, SSO, GLD, XHB, XLI, XLB, SPY, XAR, XLK, SMH, VIS, MGK, VONG. Click this link for details (pattern type, start and end dates).
For a list of small patterns (those a few days wide) click this link.
The below industries were the best (rank 1) or worst performing of those I follow.
|
-- Thomas Bulkowski
![]()
$ $ $
Here's a symbol list of 153 chart and candlestick patterns (13 "investment grade" candle patterns) found in today's securities using my version of Patternz: ABT, ACN, AYI, A, APD, AMZN, DOX, AEO, AXP, ATR, ARCB, ADM, AVY, AZTA, BSET, BAX, BECN, BERY, BBY, BIG, BAH, CBT, CE, CX, CNP, CF, CRL, CSCO, CLF, CNX, CL, CAG, GLW, CSGP, COST, COTY, DVN, DSGR, D, FICO, FISV, FLS, IT, GE, GIS, GNW, GS, GGG, HAYN, HSIC, DHI, HOV, HUN, INCY, IPAR, IBKR, IPG, KBH, K, KMB, KLIC, LHX, LEG, LEN, LMT, MANH, MAN, MRO, MCHX, MU, NJR, JWN, NOVT, NVDA, OMC, ASGN, PKG, PETS, PFE, PPG, PEG, PHM, QTWO, QCOM, RL, RMBS, RLI, ^GSPC, SAIA, SAND, SLB, SMTC, SHW, SLGN, STR, SKYW, SWX, SUM, SRDX, TPR, TGT, TPX, TEVA, TOL, RIG, UHAL, V, VMC, WAT, WPM, WOLF, WWW, IYM, IAI, IYE, ITB, IDU, FXL, IEV, IXC, MXI, SOXX, IGE, IHI, EWA, EWK, EWC, EWQ, EWG, EWM, EPP, EWS, EWY, EWP, EWD, EWL, EWT, THD, EWU, PEJ, PXJ, SSO, XLE, XLF, XHB, XLB, SMH, VAW. Click this link for details (pattern type, start and end dates).
For a list of small patterns (those a few days wide) click this link.
$ $ $
You can find setups based on a Fibonacci retrace by clicking on the link.
The following patterns were found manually, not using Patternz. Mr. Bulkowski has excluded any securities he owns from appearing in the list. However, he may add any of the securities listed to his portfolio at any time, just as you can.
In the table below, the red and green colors are based on the historical breakout direction for the associated chart pattern. If a high and tight flag appears, the start and end dates highlight the flagpole only and not the flag.
For details about the chart patterns, click here.
-- Thomas Bulkowski
![]()
| Symbol | Chart Pattern | Bullish Bearish | Start | End | Industry |
| DDD | Dead-cat bounce | 02/28/2024 | 02/28/2024 | Electronics | |
| AEIS | Triple bottom | 02/07/2024 | 02/28/2024 | Semiconductor | |
| APD | Pipe bottom | 02/05/2024 | 02/12/2024 | Chemical (Diversified) | |
| ALB | Head-and-shoulders bottom | 01/19/2024 | 02/13/2024 | Chemical (Diversified) | |
| AA | Double Bottom, Adam and Adam | 02/13/2024 | 02/26/2024 | Aerospace/Defense | |
| AEO | Triple bottom | 01/05/2024 | 02/01/2024 | Apparel | |
| ARW | Triple bottom | 02/01/2024 | 02/13/2024 | Electronics | |
| AXS | Double Top, Eve and Eve | 02/20/2024 | 02/28/2024 | Insurance (Prop/Casualty) | |
| BMI | Ugly double bottom | 02/06/2024 | 02/22/2024 | Precision Instrument | |
| BSET | Triangle, symmetrical | 12/27/2023 | 03/07/2024 | Furn/Home Furnishings | |
| BKNG | Double Top, Eve and Adam | 02/08/2024 | 02/22/2024 | Internet | |
| BCO | Triple bottom | 01/17/2024 | 02/28/2024 | Industrial Services | |
| BR | Double Bottom, Adam and Adam | 02/01/2024 | 02/13/2024 | Information Services | |
| CENX | Head-and-shoulders bottom | 02/13/2024 | 03/05/2024 | Metals and Mining (Div.) | |
| CLNE | Triple top | 02/12/2024 | 02/28/2024 | Natural Gas (Distributor) | |
| CNX | Broadening bottom | 12/12/2023 | 02/21/2024 | Natural Gas (Diversified) | |
| ED | Triple bottom | 02/13/2024 | 03/01/2024 | Electric Utility (East) | |
| CSGS | Pipe bottom | 01/29/2024 | 02/05/2024 | IT Services | |
| DVN | Double Bottom, Eve and Eve | 01/18/2024 | 02/05/2024 | Natural Gas (Diversified) | |
| DSGR | Pipe top | 02/05/2024 | 02/12/2024 | Metal Fabricating | |
| DUK | Double Bottom, Eve and Eve | 02/13/2024 | 03/01/2024 | Electric Utility (East) | |
| EOG | Triple bottom | 01/19/2024 | 02/23/2024 | Natural Gas (Distributor) | |
| FARO | Horn top | 01/29/2024 | 02/12/2024 | Precision Instrument | |
| FLEX | Double Bottom, Adam and Adam | 02/21/2024 | 02/28/2024 | Electronics | |
| FORM | Pipe bottom | 01/29/2024 | 02/05/2024 | Semiconductor | |
| FNV | Triple bottom | 01/11/2024 | 02/28/2024 | Metals and Mining (Div.) | |
| FCX | Head-and-shoulders bottom | 01/22/2024 | 03/05/2024 | Metals and Mining (Div.) | |
| GPS | Triangle, descending | 01/31/2024 | 02/29/2024 | Apparel | |
| HL | Triangle, symmetrical | 02/12/2024 | 02/28/2024 | Metals and Mining (Div.) | |
| HP | Triangle, symmetrical | 02/13/2024 | 03/07/2024 | Petroleum (Producing) | |
| HON | Head-and-shoulders bottom | 01/17/2024 | 03/01/2024 | Aerospace/Defense | |
| DHI | Triple bottom | 01/24/2024 | 02/20/2024 | Homebuilding | |
| ILMN | Multi-peaks | 01/09/2024 | 03/07/2024 | Biotechnology | |
| INFN | Broadening top | 01/26/2024 | 03/07/2024 | Telecom. Equipment | |
| NSP | Double Bottom, Adam and Adam | 02/08/2024 | 02/14/2024 | Human Resources | |
| INTC | Double Bottom, Adam and Adam | 02/02/2024 | 02/28/2024 | Semiconductor | |
| IPAR | Double Top, Adam and Eve | 02/12/2024 | 02/27/2024 | Toiletries/Cosmetics | |
| JKHY | Triangle, symmetrical | 02/12/2024 | 03/07/2024 | IT Services | |
| JBLU | Broadening top, right-angled and descending | 12/13/2023 | 02/07/2024 | Air Transport | |
| KLIC | Double Bottom, Eve and Adam | 02/02/2024 | 02/29/2024 | Semiconductor Cap Equip. | |
| RAMP | Double Top, Adam and Adam | 01/18/2024 | 02/08/2024 | Computer Software and Svcs | |
| LXU | Pipe top | 01/22/2024 | 01/29/2024 | Building Materials | |
| MTSI | Double Bottom, Eve and Eve | 01/05/2024 | 02/06/2024 | Semiconductor | |
| MANH | Double Bottom, Adam and Adam | 02/13/2024 | 02/21/2024 | IT Services | |
| MGEE | Double Bottom, Adam and Adam | 02/06/2024 | 03/01/2024 | Electric Utility (Central) | |
| MU | Pipe bottom | 02/12/2024 | 02/20/2024 | Semiconductor | |
| MS | Double Bottom, Adam and Adam | 01/19/2024 | 02/13/2024 | Securities Brokerage | |
| MUR | Double Bottom, Adam and Adam | 01/25/2024 | 02/05/2024 | Petroleum (Integrated) | |
| NOV | Triangle, descending | 02/12/2024 | 03/05/2024 | Oilfield Svcs/Equipment | |
| NOVT | Double Bottom, Adam and Adam | 02/21/2024 | 02/27/2024 | Precision Instrument | |
| NTNX | Pipe bottom | 02/12/2024 | 02/20/2024 | E-Commerce | |
| NVDA | Flag, high and tight | 01/04/2024 | 03/07/2024 | Semiconductor | |
| PNW | Head-and-shoulders bottom | 01/17/2024 | 02/28/2024 | Electric Utility (West) | |
| RL | Pipe top | 02/20/2024 | 02/26/2024 | Apparel | |
| RMBS | Triple bottom | 02/07/2024 | 02/21/2024 | Semiconductor Cap Equip. | |
| ROK | Ugly double bottom | 01/31/2024 | 02/21/2024 | Diversified Co. | |
| SAND | Double Bottom, Eve and Adam | 02/13/2024 | 02/28/2024 | Metals and Mining (Div.) | |
| SMG | Head-and-shoulders bottom | 01/17/2024 | 02/22/2024 | Chemical (Basic) | |
| SLGN | Double Top, Adam and Adam | 02/12/2024 | 02/23/2024 | Packaging and Container | |
| STR | Head-and-shoulders bottom | 01/19/2024 | 02/23/2024 | Natural Gas (Diversified) | |
| SCS | Channel | 01/18/2024 | 03/07/2024 | Furn/Home Furnishings | |
| SRDX | Horn top | 02/12/2024 | 02/26/2024 | Medical Supplies | |
| TFX | Multi-peaks | 12/18/2023 | 02/16/2024 | Diversified Co. | |
| TDC | Double Top, Adam and Adam | 01/22/2024 | 02/12/2024 | Computer Software and Svcs | |
| TXN | Double Bottom, Eve and Adam | 02/01/2024 | 02/13/2024 | Semiconductor | |
| TWLO | Double Bottom, Eve and Adam | 02/21/2024 | 03/05/2024 | E-Commerce | |
| SLCA | Head-and-shoulders bottom | 01/17/2024 | 02/23/2024 | Metals and Mining (Div.) | |
| MDRX | Dead-cat bounce | 02/26/2024 | 03/01/2024 | Healthcare Information | |
| WERN | Double Top, Adam and Eve | 01/23/2024 | 02/12/2024 | Trucking/Transp. Leasing | |
| WWW | Double Top, Adam and Eve | 02/23/2024 | 03/04/2024 | Shoe | |
| WDAY | Double Top, Adam and Eve | 02/09/2024 | 02/26/2024 | Computer Software and Svcs |
![]()
Since I post this the night before, check how the futures are trading before market open. Large moves can affect the opening direction.
$ $ $
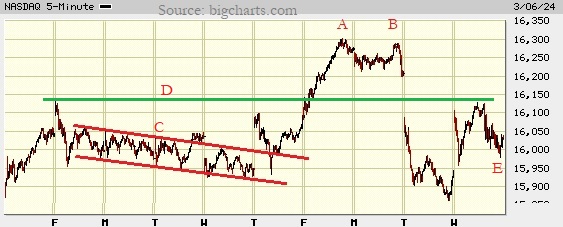
I show a picture of the Nasdaq composite on the 5-minute scale.
At AB, a double top appears. It confirms as valid when the index closes below the low between peaks A and B. That happens and leads to a large decline.
C is a channel. It's unusual because it's long even though price pierces the border a few times.
Green line D is one of support/resistance (depending on which side price is on). I drew it just to see where the Wednesday peak touches or nears the prior price movement. Point E looks to be resting on support formed by the channel. That suggests an upward move will happen tomorrow (Thursday, but that's a guess).
$ $ $
Here's a symbol list of 145 chart and candlestick patterns (13 "investment grade" candle patterns) found in today's securities using my version of Patternz: ADBE, AMD, AFL, A, APD, ALRM, ALB, AMZN, AEO, AEP, AMN, AAPL, ACGL, AVY, AXS, BERY, BAH, BMY, BBW, CX, CENX, CDAY, CF, CRL, CVX, CI, CLF, CNO, CNX, CL, DFS, DSGR, ^DJI, DRQ, EBAY, FLEX, GNW, GFS, GS, GOOGL, GFF, THG, HE, HSII, HSIC, HOV, JBHT, INFN, NSP, IIIN, JAZZ, JBLU, KMB, LAMR, L, MTSI, M, MCHX, MTRX, MLKN, MYGN, ^IXIC, NFLX, NUS, NVDA, OUT, OXM, PAYX, PRFT, PLXS, PRU, PSTG, RL, RNG, RES, ^GSPC, CRM, SAND, SAIC, SEE, SMTC, SLGN, SWX, SRDX, TPR, TGT, RIG, SLCA, UGI, UNM, VC, WPM, WOLF, WWW, IYK, IYC, IYE, DDM, FTEC, QTEC, FXL, QQQ, IEV, IGV, IXC, MXI, IXN, IGE, EWA, EWC, ECH, EWH, EWI, EWJ, EZA, EWY, EWP, EWD, EWT, TUR, EWU, QLD, SSO, ROBO, XLY, XLE, XLF, XRT, SPY, XLK, SMH, MGK, VONG. Click this link for details (pattern type, start and end dates).
For a list of small patterns (those a few days wide) click this link.
$ $ $
The following table shows where Fibonacci retrace values of the day's high-low range are plus pivot points, calculated on the Nasdaq composite, sorted by value. When several are near each other (small differences), the area might act as support or resistance.
-- Thomas Bulkowski
![]()
| © 2024 ThePatternSite.com Metric | Value | Diff | Close (within 10% of the high-low range for the day)? |
| Monthly S2 | 14,687.01 | ||
| Monthly S1 | 15,359.27 | 672.27 | |
| Weekly S2 | 15,708.65 | 349.37 | |
| Monthly Pivot | 15,830.76 | 122.11 | |
| Daily S2 | 15,867.02 | 36.26 | |
| Weekly S1 | 15,870.09 | 3.07 | Yes! The Weekly S1 is close to the Daily S2. |
| Daily S1 | 15,949.28 | 79.19 | |
| Low | 15,956.66 | 7.38 | Yes! The Low is close to the Daily S1. |
| 61.8% Down from Intraday High | 16,022.33 | 65.67 | |
| Close | 16,031.54 | 9.21 | Yes! The Close is close to the 61.8% Down from Intraday High. |
| Daily Pivot | 16,038.92 | 7.38 | Yes! The Daily Pivot is close to the Close. |
| 50% Down from Intraday High | 16,042.61 | 3.69 | Yes! The 50% Down from Intraday High is close to the Daily Pivot. |
| 38.2% Down from Intraday High | 16,062.89 | 20.28 | |
| Weekly Pivot | 16,086.17 | 23.27 | |
| Open | 16,092.00 | 5.83 | Yes! The Open is close to the Weekly Pivot. |
| Daily R1 | 16,121.18 | 29.18 | |
| High | 16,128.56 | 7.38 | Yes! The High is close to the Daily R1. |
| Daily R2 | 16,210.82 | 82.26 | |
| Weekly R1 | 16,247.61 | 36.79 | |
| Weekly R2 | 16,463.69 | 216.07 | |
| Monthly R1 | 16,503.02 | 39.34 | |
| Monthly R2 | 16,974.51 | 471.48 |
$ $ $
I show another slider trading quiz featuring ascending triangles.
$ $ $
Here's a symbol list of 174 chart and candlestick patterns (13 "investment grade" candle patterns) found in today's securities using my version of Patternz: ANF, AMD, AES, A, AMED, AR, APA, AAPL, ATO, AZTA, BZH, BERY, BIO, BKH, BA, BCO, BBW, BG, COR, CF, CIEN, CLNE, CLF, CNA, CNX, CTSH, CL, CMCO, ED, COST, COTY, DHR, DECK, DSGR, ^DJU, DRQ, DUK, EXP, EMN, EME, EVRG, EXPI, FICO, FAST, FE, FLEX, FLS, FTNT, FRD, GME, IT, GILD, GFS, GMS, GFF, HLIT, HL, HSII, HOV, HURC, IDA, IDXX, INFN, NSP, IIIN, INTU, JBLU, K, KELYA, KFRC, KSS, LEN, LLY, LXU, M, MANH, MRO, MLM, MTDR, MTRX, MDC, MU, MS, NKE, NTNX, NVDA, OXY, OGE, OR, OXM, PTEN, PETS, PFE, PNW, PXD, PLXS, POR, PFG, PEG, PSTG, QCOM, RHI, RGLD, RES, R, SAND, SAIC, SEIC, SIGI, SMTC, SKX, SKYW, SCCO, SWN, SSYS, SRDX, SNPS, TPX, TXT, TKR, TDG, TZOO, TREX, SLCA, UPS, UNM, VFC, MDRX, VRSN, WRB, WAT, WU, WDAY, IAI, IYE, IHE, FXL, BOTZ, IAT, IXC, IXN, SLV, IEO, IYF, IHI, ECH, EWY, EWT, TUR, PPA, PEJ, PXJ, PJP, XLF, GLD, XAR, XLU, UNG, USO, SMH, VIS, VAW. Click this link for details (pattern type, start and end dates).
For a list of small patterns (those a few days wide) click this link.
$ $ $
The following table shows where Fibonacci retrace values of the day's high-low range are plus pivot points, calculated on the Dow industrials, sorted by value. When several are near each other (small differences), the area might act as support or resistance.
-- Thomas Bulkowski
![]()
| © 2024 ThePatternSite.com Metric | Value | Diff | Close (within 10% of the high-low range for the day)? |
| Monthly S2 | 37,472.12 | ||
| Monthly S1 | 38,230.97 | 758.86 | |
| Weekly S2 | 38,488.26 | 257.29 | |
| Weekly S1 | 38,739.04 | 250.79 | |
| Monthly Pivot | 38,756.63 | 17.58 | |
| Daily S2 | 38,822.44 | 65.81 | |
| Daily S1 | 38,906.13 | 83.70 | |
| Low | 38,913.30 | 7.17 | Yes! The Low is close to the Daily S1. |
| Open | 38,968.77 | 55.47 | |
| 61.8% Down from Intraday High | 38,979.98 | 11.21 | Yes! The 61.8% Down from Intraday High is close to the Open. |
| Close | 38,989.83 | 9.85 | Yes! The Close is close to the 61.8% Down from Intraday High. |
| Weekly Pivot | 38,992.46 | 2.64 | Yes! The Weekly Pivot is close to the Close. |
| Daily Pivot | 38,997.00 | 4.53 | Yes! The Daily Pivot is close to the Weekly Pivot. |
| 50% Down from Intraday High | 39,000.58 | 3.58 | Yes! The 50% Down from Intraday High is close to the Daily Pivot. |
| 38.2% Down from Intraday High | 39,021.18 | 20.60 | |
| Daily R1 | 39,080.70 | 59.52 | |
| High | 39,087.86 | 7.16 | Yes! The High is close to the Daily R1. |
| Daily R2 | 39,171.56 | 83.70 | |
| Weekly R1 | 39,243.25 | 71.70 | |
| Weekly R2 | 39,496.68 | 253.42 | |
| Monthly R1 | 39,515.48 | 18.81 | |
| Monthly R2 | 40,041.14 | 525.65 |
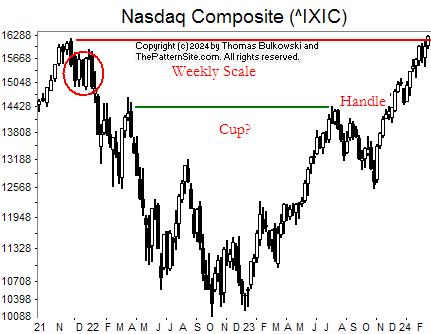
This is a chart of the Nasdaq composite on the weekly scale (not the usual daily).
The red horizontal line near the top of the chart shows overhead resistance setup by the prior peak.
I'd like to suggest that resistance will turn the indicator down. However, the circled knot didn't impede the upward move at all. I consider that unusual.
I shows a rugged looking cup with handle pattern highlighted in green with a red handle. The index made an nice move afterward.
![]()
The following is a brief review of how the markets performed over time. The numbers refer to the close-to-close move in the Dow industrials.
No options expire this week.
![]()
The following is based on an SFO article in December 2004 by John Seekinger, titled, "Take a two-dimensional approach." He offers these tips.
| Index | S2 | S1 | Pivot | R1 | R2 |
| Dow Industrials (^DJI): Daily | 38,750 | 38,918 | 39,019 | 39,188 | 39,289 |
| Weekly | 38,521 | 38,804 | 39,025 | 39,308 | 39,529 |
| Monthly | 37,505 | 38,296 | 38,789 | 39,581 | 40,074 |
| S&P500 (^GSPC): Daily | 5,078 | 5,107 | 5,124 | 5,154 | 5,170 |
| Weekly | 5,029 | 5,083 | 5,112 | 5,166 | 5,195 |
| Monthly | 4,746 | 4,941 | 5,041 | 5,237 | 5,336 |
| Nasdaq (^IXIC): Daily | 16,019 | 16,147 | 16,225 | 16,353 | 16,430 |
| Weekly | 15,790 | 16,032 | 16,167 | 16,410 | 16,545 |
| Monthly | 14,768 | 15,522 | 15,912 | 16,665 | 17,056 |
Here are the formulas:
![]()
Earnings season is over.
Here's a symbol list of 151 chart and candlestick patterns (13 "investment grade" candle patterns) found in today's securities using my version of Patternz: ABT, AXDX, AYI, AMD, A, ALK, AEO, AMWD, AMGN, ANIK, AAPL, AMAT, ADM, ANET, AIZ, BERY, BG, CDNS, CLS, CNP, CF, CRL, CHKP, CVX, CTAS, CAG, COP, CR, FANG, EMN, EBAY, EMR, EG, EVH, EXPI, XOM, FAST, FTNT, GME, IT, GD, GNW, GL, GPRO, GGG, HAYN, HQY, HTLD, HELE, HNI, HD, HON, IDXX, IIIN, JAZZ, JBLU, KEYS, KLAC, LRCX, LANC, LEN, LNC, LMT, LXU, MGY, MANH, MAS, MTDR, MDC, META, MU, MLKN, MCO, MUR, NFLX, NTAP, NJR, NTNX, ORI, OR, PETS, PXD, PEG, RMBS, RLI, ROK, RCKY, R, SAIC, SEIC, SIGI, SMTC, STR, SWN, SPSC, SCS, TRGP, TDY, TMO, TZOO, TG, TWLO, SLCA, UNH, UNM, VFC, MDRX, VC, WRB, WAT, WWD, XEL, IYC, IYE, IHE, DDM, FDN, FXI, IXC, SOXX, IGE, IEO, EWC, ECH, EEM, EWH, EWJ, EZA, EWP, EWD, XLE, GLD, UNG, USO, SMH. Click this link for details (pattern type, start and end dates).
For a list of small patterns (those a few days wide) click this link.
The below industries were the best (rank 1) or worst performing of those I follow.
|
-- Thomas Bulkowski
![]()
I'll be making some appearance changes to the website in the coming days, mostly to the home page. The order of the links won't change. I'll be removing the background image and changing some of the colors. This is courtesy of "A reader." -- Thanks!
$ $ $
Here's the updated 2024 market forecast, presented in slider format.
$ $ $
Here's a symbol list of 162 chart and candlestick patterns (13 "investment grade" candle patterns) found in today's securities using my version of Patternz: MMM, ABT, ABM, ACN, ACIW, AMD, ALK, ALB, ALL, AEE, AEL, APOG, AAPL, AIZ, BSET, BECN, BIO, BKNG, BOOT, BAH, CBT, CPB, CLS, CHKP, CIEN, CTAS, CLF, CL, CR, CRH, CMI, DHR, FANG, DDS, DFS, EBAY, EPAM, EVH, EZPW, FICO, FAST, FDX, FE, FORM, FTV, FDP, IT, GD, GNW, GL, GES, THG, HQY, HTLD, HL, HELE, HP, DHI, IEX, NSP, IIIN, IRM, JAZZ, JBLU, KBH, KMT, LEG, LEN, RAMP, LXU, MHO, M, MANH, MAN, MTRN, MTRX, MGEE, MU, NTAP, NKE, NOC, NWPX, NOVT, NTNX, ORI, OMI, OXM, PKG, PKE, PFE, PINC, PEG, REGN, RLI, RHI, ROL, ROST, R, SBH, SAND, SMG, SEIC, SMTC, SCI, STR, SCCO, SXI, SCS, SSYS, TPX, TDC, TER, TOL, TDG, SLCA, UNH, UNM, VC, WU, WMB, WWD, XEL, IYC, IHE, FDN, FXI, ICF, IYH, IHF, SOXX, EWO, EWK, ECH, EWQ, EWH, EIS, EWM, EZA, EWP, EWD, EWL, THD, PBE, PEJ, XLF, GLD, UNG. Click this link for details (pattern type, start and end dates).
For a list of small patterns (those a few days wide) click this link.
![]()
Support this site! Clicking any of the books (below) takes you to
Amazon.com If you buy ANYTHING while there, they pay for the referral.
Legal notice for paid links: "As an Amazon Associate I earn from qualifying purchases."
|
My Stock Market Books
|
My Novels
Orb Foresight Rewrite Coming!
|