
As of 04/28/2026
Indus: 49,142 -25.86 -0.1%
Trans: 20,733 -111.00 -0.5%
Utils: 1,157 +1.83 +0.2%
Nasdaq: 24,664 -223.30 -0.9%
S&P 500: 7,139 -35.11 -0.5%
|
YTD
+2.2%
+19.4%
+8.3%
+6.1%
+4.3%
|
|
As of 04/28/2026
Indus: 49,142 -25.86 -0.1%
Trans: 20,733 -111.00 -0.5%
Utils: 1,157 +1.83 +0.2%
Nasdaq: 24,664 -223.30 -0.9%
S&P 500: 7,139 -35.11 -0.5%
|
YTD
+2.2%
+19.4%
+8.3%
+6.1%
+4.3%
| |
|
| ||
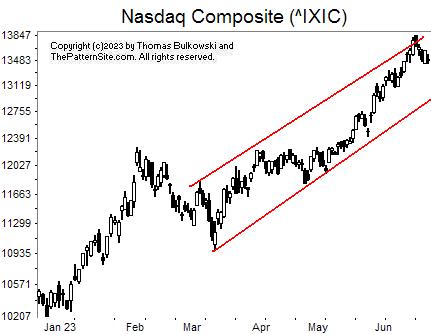
There's not much going on in this chart of the Nasdaq composite on the daily scale.
I drew two nearly parallel lines, shown here in red, highlighting the upward trend. The index touched the top trendline and bounced off it, suggesting it'll fall to the lower red line.
I'm not sure if that'll happen or not. I have my doubts.
One thing is clear: The index has made a nice move up since the low in March. I'm expecting continued gains.
![]()
The following is a brief review of how the markets performed over time. The numbers refer to the close-to-close move in the Dow industrials.
No options expire this week.
![]()
The following is based on an SFO article in December 2004 by John Seekinger, titled, "Take a two-dimensional approach." He offers these tips.
| Index | S2 | S1 | Pivot | R1 | R2 |
| Dow Industrials (^DJI): Daily | 35,250 | 35,354 | 35,460 | 35,565 | 35,670 |
| Weekly | 35,012 | 35,235 | 35,440 | 35,664 | 35,869 |
| Monthly | 32,870 | 34,165 | 34,905 | 36,200 | 36,940 |
| S&P500 (^GSPC): Daily | 4,553 | 4,567 | 4,579 | 4,594 | 4,605 |
| Weekly | 4,494 | 4,538 | 4,573 | 4,617 | 4,651 |
| Monthly | 4,227 | 4,405 | 4,506 | 4,684 | 4,785 |
| Nasdaq (^IXIC): Daily | 14,127 | 14,222 | 14,283 | 14,378 | 14,439 |
| Weekly | 13,862 | 14,089 | 14,225 | 14,452 | 14,588 |
| Monthly | 12,920 | 13,619 | 14,033 | 14,731 | 15,145 |
Here are the formulas:
![]()
Earnings season is either underway or should be starting soon. The sessions could be more volatile.
Here's a symbol list of 108 chart and candlestick patterns (13 "investment grade" candle patterns) found in today's securities using my version of Patternz: AXDX, ATSG, ALL, AMZN, DOX, ANIK, ATR, ACGL, ANET, AGO, AXS, BCPC, BMRN, BR, CBT, CNP, CVX, CHD, CIEN, CINF, CLX, CNA, CTSH, CMCO, DRQ, DTE, EXP, EIX, EME, FLEX, FORM, FDP, GPRO, GFF, HIG, HAYN, HON, HOV, ITW, PODD, ITGR, INTC, TILE, ISRG, IRM, KEYS, KLIC, LH, LAMR, LEN, L, LXU, MCHX, MRTN, MDT, NTGR, NJR, JWN, NTNX, PRFT, PG, QCOM, RHI, ROK, ROL, RGLD, SBH, SKX, SO, SXI, SSYS, TKR, TWLO, VEEV, WRB, WU, WEX, WSC, WOLF, WDAY, IAI, FTEC, QTEC, FXL, FXI, QQQ, ICF, IXN, EWA, EWK, EEM, EWQ, EWH, EWS, EZA, EWY, TUR, QLD, XLY, GLD, XLK, UNG, USO. Click this link for details (pattern type, start and end dates).
For a list of small patterns (those a few days wide) click this link.
The below industries were the best (rank 1) or worst performing of those I follow.
|
-- Thomas Bulkowski
![]()
$ $ $
Here's a symbol list of 260 chart and candlestick patterns (13 "investment grade" candle patterns) found in today's securities using my version of Patternz: ACIW, ATVI, AJRD, AES, AFL, ATSG, ALL, AYX, AMZN, DOX, AMED, AXP, AME, ANIK, AR, AAPL, AMAT, ACGL, ADM, AWI, AIZ, AZTA, BMI, BCPC, BALL, BECN, BBY, BAH, BMY, BR, CACI, CAL, CPB, CLS, CNP, CENX, CDAY, CRL, CVX, CHS, CNA, CNX, CTSH, CMTL, CXW, GLW, CSGP, COST, CROX, CCRN, XRAY, DVN, FANG, ^DJI, DTE, BOOM, EPAM, EL, FDS, FISV, FMC, FWRD, FDP, GPS, GD, GILD, GPN, GMS, GPRO, GES, HQY, HSY, HOLX, HON, HOV, JBHT, HUN, IDXX, INFN, IBP, PODD, ITGR, IBKR, IPI, ISRG, IRM, KALU, KEYS, KLIC, LRCX, LAMR, LANC, LDOS, LEN, LNC, RAMP, MAN, MRO, MLM, MA, MTDR, MTRX, MDT, MRK, META, MU, MSFT, MUR, MYGN, ^IXIC, NFG, NOV, NTGR, NTAP, NEWR, NXGN, NKE, JWN, NUS, NTNX, NVDA, OXY, OMC, ASGN, ON, OR, OUT, OMI, PANW, PKE, PYPL, PRFT, PETS, PPG, PG, PHM, QTWO, QCOM, DGX, RL, RGS, RGA, ^GSPC, SAIA, SBH, SLB, SEE, NOW, SHW, SHOP, LUV, SWX, SPLK, SCS, SSYS, SUM, SRDX, TRGP, TJX, RIG, TZOO, UGI, UNH, VECO, VEEV, VC, VMC, WRB, WMT, WU, WSC, WOLF, WWW, WDAY, IYM, IAI, IYK, IYC, ITB, IEZ, DDM, FDN, BOTZ, ICF, IYH, IHF, IAT, IXC, MXI, ILF, SOXX, IGE, IYF, IHI, EWA, EWO, EWC, EEM, EWH, EWM, EPP, EWS, EZA, EWD, EWT, THD, TUR, EWU, IBB, PPA, PBE, PEJ, PXJ, PHO, SSO, XLY, XLP, XLF, XLV, XLI, XLB, XRT, SPY, XAR, USO, SMH, VHT, VIS, VAW, MGK. Click this link for details (pattern type, start and end dates).
For a list of small patterns (those a few days wide) click this link.
$ $ $
You can find setups based on a Fibonacci retrace by clicking on the link.
The following patterns were found manually, not using Patternz. Mr. Bulkowski has excluded any securities he owns from appearing in the list. However, he may add any of the securities listed to his portfolio at any time, just as you can.
In the table below, the red and green colors are based on the historical breakout direction for the associated chart pattern. If a high and tight flag appears, the start and end dates highlight the flagpole only and not the flag.
For details about the chart patterns, click here.
-- Thomas Bulkowski
![]()
| Symbol | Chart Pattern | Bullish Bearish | Start | End | Industry |
| AFL | Three Rising Valleys | 05/31/2023 | 07/17/2023 | Insurance (Diversified) | |
| AA | Triangle, symmetrical | 05/31/2023 | 07/27/2023 | Aerospace/Defense | |
| ALL | Pipe bottom | 07/10/2023 | 07/17/2023 | Insurance (Prop/Casualty) | |
| AMN | Double Top, Adam and Eve | 07/11/2023 | 07/20/2023 | Human Resources | |
| AIZ | Three Rising Valleys | 06/28/2023 | 07/17/2023 | Insurance (Diversified) | |
| AVA | Pipe bottom | 07/03/2023 | 07/10/2023 | Electric Utility (West) | |
| BSX | Broadening bottom | 07/11/2023 | 07/27/2023 | Medical Services | |
| CL | Double Bottom, Adam and Adam | 06/28/2023 | 07/11/2023 | Household Products | |
| CSGP | Double Top, Adam and Eve | 06/30/2023 | 07/19/2023 | Information Services | |
| ^DJU | Triangle, ascending | 06/16/2023 | 07/19/2023 | None | |
| D | Triple bottom | 06/29/2023 | 07/18/2023 | Electric Utility (East) | |
| BOOM | Double Bottom, Adam and Adam | 06/05/2023 | 06/23/2023 | Metal Fabricating | |
| EXPD | Rising wedge | 06/16/2023 | 07/27/2023 | Air Transport | |
| FFIV | Triple bottom | 06/23/2023 | 07/07/2023 | Internet | |
| FE | Triangle, ascending | 05/11/2023 | 07/20/2023 | Electric Utility (East) | |
| HOLX | Double Bottom, Eve and Adam | 07/06/2023 | 07/19/2023 | Medical Supplies | |
| HON | Double Top, Adam and Eve | 07/12/2023 | 07/21/2023 | Aerospace/Defense | |
| ISRG | Pipe top | 07/10/2023 | 07/17/2023 | Medical Supplies | |
| MU | Pipe bottom | 07/03/2023 | 07/10/2023 | Semiconductor | |
| OXY | Double Bottom, Adam and Adam | 05/11/2023 | 06/23/2023 | Petroleum (Producing) | |
| OGE | Triple bottom | 06/29/2023 | 07/18/2023 | Electric Utility (Central) | |
| PDCO | Triangle, symmetrical | 06/30/2023 | 07/24/2023 | Medical Supplies | |
| PETS | Head-and-shoulders bottom | 06/22/2023 | 07/24/2023 | Medical Services | |
| PLXS | Double Top, Adam and Adam | 07/19/2023 | 07/25/2023 | Electronics | |
| DGX | Double Top, Adam and Eve | 06/23/2023 | 07/24/2023 | Medical Services | |
| SBH | Rectangle top | 06/07/2023 | 07/27/2023 | Toiletries/Cosmetics | |
| SO | Triple bottom | 06/02/2023 | 07/18/2023 | Electric Utility (East) | |
| TDOC | Pipe bottom | 07/03/2023 | 07/10/2023 | Healthcare Information | |
| TDY | Head-and-shoulders top | 06/30/2023 | 07/26/2023 | Aerospace/Defense | |
| TSCO | Double Bottom, Eve and Adam | 07/17/2023 | 07/25/2023 | Retail Building Supply | |
| TG | Ugly double bottom | 06/16/2023 | 07/06/2023 | Chemical (Specialty) |
![]()
Since I post this the night before, check how the futures are trading before market open. Large moves can affect the opening direction.
$ $ $
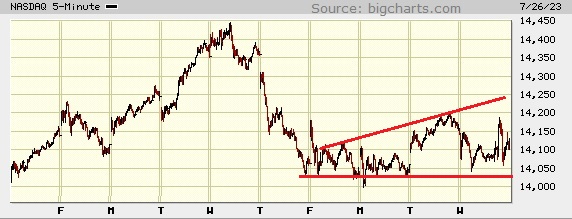
I show a picture of the Nasdaq composite on the 5-minute scale.
The chart shows a broadening formation, right-angled and ascending, which I often abbreviate RABFA.
The index touches the bottom trendline (red line) multiple times and even pierces it early on. The top trendline (red line) also has plenty of touches.
However, Wednesday's trading was all over the place, likely caused by a report of an interest rate rise by the FED. Traders couldn't decide if the news was good or bad.
What does the indecision say about the coming price action? I've no idea. ![]()
$ $ $
Here's a symbol list of 127 chart and candlestick patterns (13 "investment grade" candle patterns) found in today's securities using my version of Patternz: ABT, ACIW, ATSG, ALK, ALKS, ALL, AYX, AMZN, APH, ADM, ANET, ADP, AZTA, BMI, BBY, BIG, BA, BKNG, CHS, CTAS, CNA, CNX, CGNX, CMTL, ED, CXW, CR, CCRN, ^DJT, ^DJI, DTE, EIX, ELV, EVRG, FARO, GPS, GIS, GFS, GS, GOOGL, HLIT, HSY, HOV, TILE, IPI, ISRG, IRM, JBLU, KSS, LHX, LDOS, LLY, LNC, MANH, MKTX, META, MSFT, MLI, MYGN, NBR, NFLX, NTAP, NWL, NEU, JWN, NOVT, NVDA, OTEX, ORCL, OR, PKE, PFG, PRU, PHM, QTWO, KWR, RRC, RHI, R, SBH, SAIC, SMG, SEE, SO, SWN, SR, TDY, TJX, TOL, TREX, SLCA, UNH, UNM, VLO, VEEV, WRB, WSO, WOLF, WWW, IYC, IDU, DDM, FXI, ICF, IXN, EWK, EWZ, EEM, EWM, EWS, TUR, PEJ, PJP, XLF, SPY, XLU. Click this link for details (pattern type, start and end dates).
For a list of small patterns (those a few days wide) click this link.
$ $ $
The following table shows where Fibonacci retrace values of the day's high-low range are plus pivot points, calculated on the Nasdaq composite, sorted by value. When several are near each other (small differences), the area might act as support or resistance.
-- Thomas Bulkowski
![]()
| © 2023 ThePatternSite.com Metric | Value | Diff | Close (within 10% of the high-low range for the day)? |
| Monthly S2 | 12,857.29 | ||
| Monthly S1 | 13,492.28 | 635.00 | |
| Weekly S2 | 13,771.99 | 279.71 | |
| Weekly S1 | 13,949.64 | 177.64 | |
| Monthly Pivot | 13,969.42 | 19.78 | |
| Daily S2 | 13,973.46 | 4.04 | Yes! The Daily S2 is close to the Monthly Pivot. |
| Low | 14,041.95 | 68.49 | |
| Daily S1 | 14,050.37 | 8.42 | Yes! The Daily S1 is close to the Low. |
| 61.8% Down from Intraday High | 14,097.49 | 47.12 | |
| 50% Down from Intraday High | 14,114.65 | 17.16 | |
| Daily Pivot | 14,118.86 | 4.21 | Yes! The Daily Pivot is close to the 50% Down from Intraday High. |
| Open | 14,123.52 | 4.66 | Yes! The Open is close to the Daily Pivot. |
| Close | 14,127.28 | 3.76 | Yes! The Close is close to the Open. |
| 38.2% Down from Intraday High | 14,131.81 | 4.53 | Yes! The 38.2% Down from Intraday High is close to the Close. |
| High | 14,187.35 | 55.54 | |
| Daily R1 | 14,195.77 | 8.42 | Yes! The Daily R1 is close to the High. |
| Weekly Pivot | 14,198.09 | 2.32 | Yes! The Weekly Pivot is close to the Daily R1. |
| Daily R2 | 14,264.26 | 66.17 | |
| Weekly R1 | 14,375.74 | 111.48 | |
| Monthly R1 | 14,604.41 | 228.68 | |
| Weekly R2 | 14,624.19 | 19.78 | |
| Monthly R2 | 15,081.55 | 457.35 |
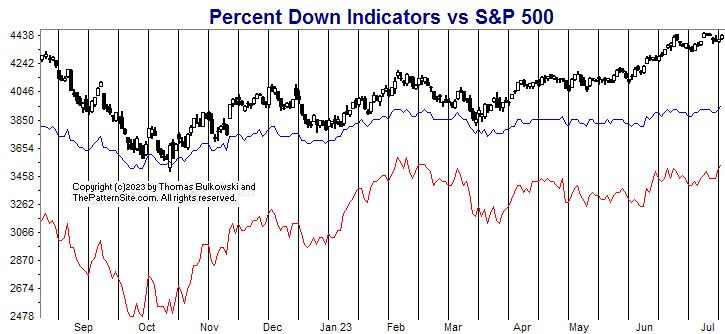
This is a picture of the chart pattern indicator on the daily scale. The indicator is the line chart below a chart of the S&P 500 composite.
The CPI is trending lower as the chart shows (look at the thin blue line near chart bottom). It's not a good sign but don't panic yet.
As it is right now, there's bearish divergence between the indicator and the index.
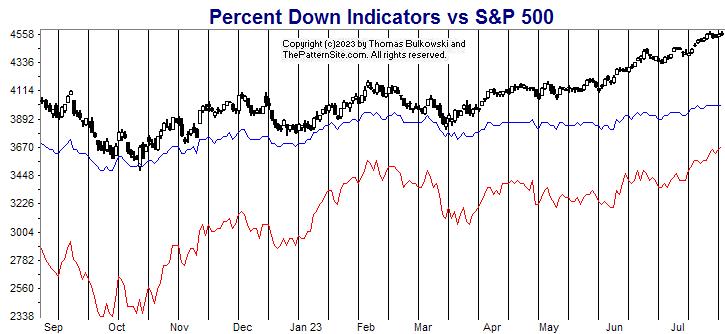
The red line is the percentage of stocks at least 20% below their 1-year high (plotted upside down). The blue line is the average percentage drop of stocks below their 1-year high (plotted upside down).
On Tuesday, 27% of stocks in my database are in bear market territory (down at least 20% from their 1-year high).A week ago, it was 31%.The fewest was 27% on 07/25/2023.And the most was 77% on 09/26/2022.
The 523 stocks in my database are down an average of 14% from their yearly high.A week ago, the average was 15%.The peak was 14% on 07/25/2023.And the bottom was 34% on 09/30/2022.
Both lines show improvement this week compared to a week ago. That's the good news. The bad news is I'm not sure what it means. The prior chart is bullish but shows a change coming.
This chart is still bullish. My guess is we'll see a retrace soon. Perhaps as soon as tomorrow (Wednesday) after the FED reports.
$ $ $
Here's a symbol list of 139 chart and candlestick patterns (13 "investment grade" candle patterns) found in today's securities using my version of Patternz: DDD, MMM, ANF, ACIW, ADTN, AEIS, AFL, ALRM, ALL, AMZN, ANIK, ATR, ASH, ADSK, AZTA, BSET, BIIB, BKH, BSX, BCO, BR, BBW, CNP, CHKP, CHD, CI, CGNX, CMTL, ED, CONN, CXW, CSGP, CCRN, DTE, DUK, BOOM, EBAY, EIX, EXPI, FFIV, FICO, FARO, FCX, GE, GIS, GPRO, HE, HTLD, HOV, ITW, ISRG, JBLU, JNJ, KLAC, LHX, LH, LDOS, LEN, L, MRO, MAS, MDC, META, NFG, NXGN, NOC, NTNX, NVDA, ON, PKG, PPL, PHM, DGX, RTX, RNG, RGLD, SBH, SAIC, SEE, SIGI, SCI, SHW, STR, SKX, SCCO, LUV, SNPS, TPR, TDY, TFX, TJX, TOL, TDG, TREX, TWLO, UGI, VFC, VMI, VEEV, WRB, WEX, WOLF, IYM, DDM, FXI, IAT, MXI, ILF, EWA, EWQ, EWH, EIS, EWM, EPP, EZA, EWY, EWT, THD, TUR, PJP, XLB, SPY, UNG, USO, SMH. Click this link for details (pattern type, start and end dates).
For a list of small patterns (those a few days wide) click this link.
-- Thomas Bulkowski
![]()
$ $ $
I show another slider trading quiz featuring United Technologies: UTX stock.
$ $ $
Here's a symbol list of 142 chart and candlestick patterns (13 "investment grade" candle patterns) found in today's securities using my version of Patternz: ADBE, AES, ALB, ALKS, AYX, AFG, ABC, ATR, ADM, ADP, AVA, BKH, BOOT, BSX, BMY, BBW, CACI, CLS, CX, CENX, CF, CRL, CVX, CHS, CNX, CL, COP, CXW, CTS, CMI, DECK, XRAY, DDS, DFS, ^DJI, DTE, EIX, EOG, EFX, EL, EG, EZPW, GIS, GPRO, THG, HQY, HTLD, HOLX, ITW, NSP, ITGR, TILE, IPG, ISRG, JNJ, KBH, LH, LAMR, MAN, MRO, MDC, MU, MS, MUR, NEU, JWN, NOVT, NUS, OXY, OGE, ORI, OLN, OMCL, PKG, PKE, PFE, PPG, PEG, PSTG, QTWO, RNG, RHI, RCKY, RES, SBH, SEE, SIGI, SCI, STR, SKX, SWX, SCS, SRDX, TRGP, TDOC, TFX, TJX, TDG, SLCA, VLO, WRB, WU, WWD, IYE, DDM, FXI, IYZ, IXC, SLV, IGE, IEO, IYF, IHI, EWO, EWC, EEM, EWH, EIS, EWM, EZA, EWY, TUR, DBA, PBE, PJP, XLE, GLD, USO. Click this link for details (pattern type, start and end dates).
For a list of small patterns (those a few days wide) click this link.
$ $ $
The following table shows where Fibonacci retrace values of the day's high-low range are plus pivot points, calculated on the Dow industrials, sorted by value. When several are near each other (small differences), the area might act as support or resistance.
-- Thomas Bulkowski
![]()
| © 2023 ThePatternSite.com Metric | Value | Diff | Close (within 10% of the high-low range for the day)? |
| Monthly S2 | 33,035.66 | ||
| Weekly S2 | 34,113.53 | 1,077.87 | |
| Monthly S1 | 34,223.45 | 109.92 | |
| Weekly S1 | 34,762.38 | 538.93 | |
| Monthly Pivot | 34,798.11 | 35.73 | |
| Weekly Pivot | 35,067.58 | 269.47 | |
| Daily S2 | 35,135.49 | 67.91 | |
| Low | 35,230.79 | 95.30 | |
| Open | 35,230.79 | 0.00 | Yes! The Open is close to the Low. |
| Daily S1 | 35,273.36 | 42.57 | |
| 61.8% Down from Intraday High | 35,319.86 | 46.50 | |
| 50% Down from Intraday High | 35,347.38 | 27.52 | |
| Daily Pivot | 35,368.67 | 21.29 | Yes! The Daily Pivot is close to the 50% Down from Intraday High. |
| 38.2% Down from Intraday High | 35,374.89 | 6.23 | Yes! The 38.2% Down from Intraday High is close to the Daily Pivot. |
| Close | 35,411.24 | 36.34 | |
| High | 35,463.97 | 52.73 | |
| Daily R1 | 35,506.54 | 42.57 | |
| Daily R2 | 35,601.85 | 95.30 | |
| Weekly R1 | 35,716.43 | 114.59 | |
| Monthly R1 | 35,985.90 | 269.46 | |
| Weekly R2 | 36,021.63 | 35.73 | |
| Monthly R2 | 36,560.56 | 538.93 |
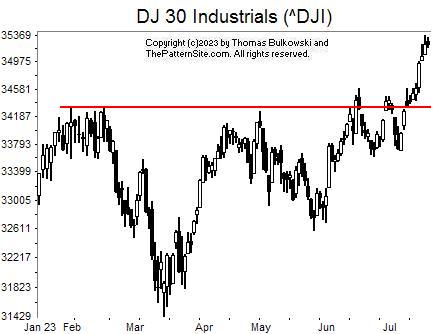
Not much is happening in the Industrials this week. I show the chart on the daily scale, by the way.
A line of overhead resistance should have stopped the advance, and it did, but only for a few peaks in June before the index busted through upward. The resulting move was a nice deposit in my wallet.
As they say, a rising tide lifts all boats.
What's next? The CPI chart (Chart Pattern Indicator not consumer price index, not shown) is trending lower. That suggests the upward move is running out of steam. Of course, it's being powered by earnings reports now. Maybe we'll have some companies miss and will pull the index lower.
I'm doing some selling in anticipation of a lower value in September when I'll buy back in.
![]()
The following is a brief review of how the markets performed over time. The numbers refer to the close-to-close move in the Dow industrials.
No options expire this week.
![]()
The following is based on an SFO article in December 2004 by John Seekinger, titled, "Take a two-dimensional approach." He offers these tips.
| Index | S2 | S1 | Pivot | R1 | R2 |
| Dow Industrials (^DJI): Daily | 35,097 | 35,162 | 35,251 | 35,317 | 35,406 |
| Weekly | 34,052 | 34,640 | 35,006 | 35,594 | 35,960 |
| Monthly | 32,974 | 34,101 | 34,737 | 35,864 | 36,499 |
| S&P500 (^GSPC): Daily | 4,523 | 4,530 | 4,542 | 4,549 | 4,562 |
| Weekly | 4,466 | 4,501 | 4,540 | 4,575 | 4,613 |
| Monthly | 4,231 | 4,383 | 4,481 | 4,634 | 4,731 |
| Nasdaq (^IXIC): Daily | 13,919 | 13,976 | 14,077 | 14,134 | 14,236 |
| Weekly | 13,741 | 13,887 | 14,167 | 14,313 | 14,593 |
| Monthly | 12,826 | 13,429 | 13,938 | 14,541 | 15,050 |
Here are the formulas:
![]()
Earnings season is either underway or should be starting soon. The sessions could be more volatile.
Here's a symbol list of 180 chart and candlestick patterns (13 "investment grade" candle patterns) found in today's securities using my version of Patternz: ATVI, AMD, ATSG, AKAM, ALB, ALKS, AYX, AMED, AMWD, ABC, AMN, AR, AON, ADM, AWI, AIZ, AGO, ATO, AVA, AXS, BMI, BALL, BZH, BIO, BOOT, BAH, BCO, BG, CX, CNC, CENX, CNX, CGNX, CTSH, ED, COP, CXW, CMI, CW, DHR, ^DJU, DRQ, DTE, DUK, EMN, EBAY, EIX, EPAM, EFX, EQT, EL, EXPI, EZPW, FCX, FDP, GPS, IT, GNW, GFS, GPRO, GGG, GES, HBI, THG, HLIT, HAYN, HQY, HELE, HOLX, HWM, JBHT, IBP, IPG, IPI, KBH, KELYA, KMT, KLAC, LAMR, LEG, LNC, LOW, LPLA, LXU, M, MAN, MRO, MGEE, MU, MLKN, ^IXIC, NFLX, NEE, NOVT, OMC, OR, OXM, PKG, PATK, PDCO, PETS, PLXS, PEG, RL, RJF, RHI, ROP, SBH, SIGI, SMTC, SCI, STR, SKX, SWN, SCS, SRDX, TDOC, TDG, UNM, VC, WRB, WLK, WSM, WOLF, WWD, IYC, IDU, FDN, QTEC, FXL, BOTZ, QQQ, ICF, IAT, IXN, ILF, SOXX, SLV, IHI, EWO, ECH, EEM, EIS, EWJ, EWY, EWD, THD, QLD, PPA, PJP, PHO, ROBO, XLY, GLD, XHB, XLU, USO, SMH, VIS. Click this link for details (pattern type, start and end dates).
For a list of small patterns (those a few days wide) click this link.
The below industries were the best (rank 1) or worst performing of those I follow.
|
-- Thomas Bulkowski
![]()
Consider tax loss harvesting now. The markets are high and if you have a stock/ETF/mutualfund losing money, it might be the time to sell. You have to wait MORE than 30 days before you buy back the same or similar shares otherwise the tax loss will be disallowed (but it raises the cost basis for the next time you sell, so the deduction isn't lost, just postponed). When the markets drop in September (weakest month of the year or October, you'll have the cash available.
You could sell now and buy back a security that isn't similar. What's that mean? The government doesn't say, but doing something like selling a stock and buying a diversified ETF or mutual fund will work. By diversified, I mean a fund that has more than one security in it. Making a switch from an ETF to another ETF, especially if they both have the same benchmark (like the Nasdaq) is high risk of triggering the wash sale rule and may or may not cause a problem. If you do that, make sure you choose a different fund company (such as moving from iShares to Vanguard). It's best to make a move like selling the QQQs (which follows the Nasdaq) and buying SMH (semiconductors). In other words, change industries on the benchmark.
$ $ $
Here's a symbol list of 168 chart and candlestick patterns (13 "investment grade" candle patterns) found in today's securities using my version of Patternz: ACN, AMD, ALB, ALKS, ALL, AYX, ANIK, AMAT, ADM, ASH, ATO, AVY, AVA, AXS, AZTA, BMI, BCPC, BAX, BZH, BIIB, BSX, BMY, BG, CBT, CACI, CX, CENX, CHS, CINF, CNO, CNX, CMTL, GLW, COST, CRH, CROX, ^DJU, ^DJI, DRQ, EMN, EIX, EL, EVH, FICO, FARO, FAST, FDX, FLEX, FTNT, FCX, GPS, GNW, GFS, GL, GGG, GES, HBI, HAYN, HQY, DHI, HOV, IEX, ITW, INCY, INFN, IBP, IIIN, PODD, IPAR, IBKR, ISRG, NVTA, JAZZ, JNJ, KBH, KELYA, KLAC, KLIC, LHX, LZB, LEG, LEN, RAMP, LXU, MHO, MDC, MU, MYGN, ORI, OMCL, ORCL, OR, OUT, PKG, PETS, PPG, PEG, PHM, QTWO, RL, RMBS, RGLD, SCHW, SIGI, SCI, SKX, SCCO, SPSC, SUM, SRDX, SNPS, TRGP, TECH, TDOC, TDC, TER, TSCO, RIG, UGI, VLO, VEEV, WSC, ZBRA, ITA, ITB, IEZ, IHE, IDU, DDM, BOTZ, ILF, SOXX, SLV, IHI, EWK, EWC, EWH, EWS, EWY, EWT, PBE, XLP, GLD, XHB, XLU, UNG, SMH. Click this link for details (pattern type, start and end dates).
For a list of small patterns (those a few days wide) click this link.
$ $ $
You can find setups based on a Fibonacci retrace by clicking on the link.
The following patterns were found manually, not using Patternz. Mr. Bulkowski has excluded any securities he owns from appearing in the list. However, he may add any of the securities listed to his portfolio at any time, just as you can.
In the table below, the red and green colors are based on the historical breakout direction for the associated chart pattern. If a high and tight flag appears, the start and end dates highlight the flagpole only and not the flag.
For details about the chart patterns, click here.
-- Thomas Bulkowski
![]()
| Symbol | Chart Pattern | Bullish Bearish | Start | End | Industry |
| ABM | Double Bottom, Adam and Adam | 06/23/2023 | 07/07/2023 | Industrial Services | |
| A | Double Bottom, Adam and Adam | 06/28/2023 | 07/06/2023 | Precision Instrument | |
| AA | Diamond bottom | 04/25/2023 | 05/19/2023 | Aerospace/Defense | |
| ALKS | Pipe bottom | 07/03/2023 | 07/10/2023 | Drug | |
| AYX | Triple top | 06/16/2023 | 07/12/2023 | Computer Software and Svcs | |
| ATR | Triple bottom | 05/31/2023 | 07/06/2023 | Packaging and Container | |
| ANET | Pipe bottom | 06/20/2023 | 06/26/2023 | E-Commerce | |
| ADSK | Double Bottom, Eve and Adam | 06/26/2023 | 07/06/2023 | Computer Software and Svcs | |
| BA | Triangle, symmetrical | 06/06/2023 | 07/20/2023 | Aerospace/Defense | |
| CX | Pipe bottom | 07/03/2023 | 07/10/2023 | Cement and Aggregates | |
| CNC | Double Bottom, Adam and Adam | 06/14/2023 | 07/13/2023 | Medical Services | |
| CMTL | Double Bottom, Adam and Adam | 07/07/2023 | 07/14/2023 | Telecom. Equipment | |
| ED | Head-and-shoulders complex bottom | 06/07/2023 | 07/18/2023 | Electric Utility (East) | |
| GLW | Double Top, Adam and Adam | 06/16/2023 | 07/13/2023 | Telecom. Equipment | |
| DVN | Double Bottom, Eve and Adam | 06/23/2023 | 07/06/2023 | Natural Gas (Diversified) | |
| ^DJI | Double Bottom, Adam and Adam | 06/26/2023 | 07/10/2023 | None | |
| DTE | Triangle, ascending | 06/29/2023 | 07/20/2023 | Electric Utility (Central) | |
| EIX | Broadening top, right-angled and ascending | 06/20/2023 | 07/14/2023 | Electric Utility (West) | |
| WIRE | Double Top, Eve and Eve | 06/12/2023 | 06/29/2023 | Metals and Mining (Div.) | |
| EFX | Broadening top, right-angled and ascending | 06/13/2023 | 07/19/2023 | Information Services | |
| EG | Pipe bottom | 06/26/2023 | 07/03/2023 | Insurance (Prop/Casualty) | |
| EVH | Head-and-shoulders bottom | 05/31/2023 | 07/13/2023 | Healthcare Information | |
| FAST | Double Top, Adam and Eve | 06/30/2023 | 07/12/2023 | Retail Building Supply | |
| FLEX | Rising wedge | 06/20/2023 | 07/19/2023 | Electronics | |
| FCX | Broadening top | 06/13/2023 | 07/13/2023 | Metals and Mining (Div.) | |
| HE | Triple bottom | 06/23/2023 | 07/06/2023 | Electric Utility (West) | |
| HAYN | Triangle, symmetrical | 06/14/2023 | 07/18/2023 | Building Materials | |
| NSP | Falling wedge | 06/22/2023 | 07/14/2023 | Human Resources | |
| IPG | Double Top, Eve and Adam | 06/14/2023 | 07/18/2023 | Advertising | |
| KELYA | Double Bottom, Adam and Adam | 06/23/2023 | 07/06/2023 | Human Resources | |
| KLAC | Broadening top | 06/13/2023 | 07/20/2023 | Semiconductor Cap Equip. | |
| LZB | Broadening bottom | 05/01/2023 | 07/12/2023 | Furn/Home Furnishings | |
| MGEE | Ugly double bottom | 06/01/2023 | 06/23/2023 | Electric Utility (Central) | |
| MS | Double Bottom, Adam and Eve | 06/23/2023 | 07/07/2023 | Securities Brokerage | |
| NFG | Head-and-shoulders bottom | 06/23/2023 | 07/17/2023 | Natural Gas (Diversified) | |
| NEE | Double Bottom, Adam and Adam | 07/11/2023 | 07/18/2023 | Electric Utility (East) | |
| OMC | Broadening top | 06/12/2023 | 07/18/2023 | Advertising | |
| OUT | Rising wedge | 06/16/2023 | 07/19/2023 | Advertising | |
| PKG | Double Bottom, Adam and Adam | 06/28/2023 | 07/06/2023 | Packaging and Container | |
| PFE | Head-and-shoulders bottom | 06/29/2023 | 07/17/2023 | Drug | |
| POR | Broadening top, right-angled and descending | 06/27/2023 | 07/18/2023 | Electric Utility (West) | |
| RMBS | Double Top, Eve and Eve | 06/30/2023 | 07/14/2023 | Semiconductor Cap Equip. | |
| REGN | Double Bottom, Adam and Adam | 06/28/2023 | 07/10/2023 | Biotechnology | |
| SMG | Head-and-shoulders bottom | 06/09/2023 | 07/06/2023 | Chemical (Basic) | |
| SLGN | Triangle, ascending | 05/19/2023 | 07/20/2023 | Packaging and Container | |
| SCS | Triangle, symmetrical | 06/22/2023 | 07/20/2023 | Furn/Home Furnishings | |
| SRDX | Pipe bottom | 07/03/2023 | 07/10/2023 | Medical Supplies | |
| TGT | Broadening top, right-angled and descending | 06/26/2023 | 07/20/2023 | Retail Store | |
| TFX | Double Bottom, Eve and Adam | 06/29/2023 | 07/07/2023 | Diversified Co. | |
| UNH | Pipe bottom | 06/12/2023 | 06/20/2023 | Medical Services | |
| VECO | Broadening top | 06/13/2023 | 07/17/2023 | Precision Instrument | |
| WSM | Ugly double bottom | 05/26/2023 | 06/23/2023 | Retail (Special Lines) |
![]()
Since I post this the night before, check how the futures are trading before market open. Large moves can affect the opening direction.
$ $ $
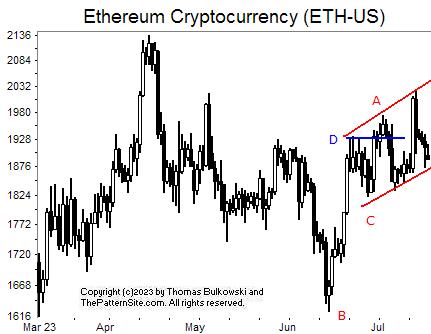
I show a picture of Ethereum (ETH-USD) on the daily scale.
BC is a chart pattern called an ugly double bottom. That's when the second bottom (C) is well above the price of the first bottom (B).
If confirms at D when the currency closes above the blue line.
I drew two lines parallel, A and C, showing how the currency is marching upward. We should see it bounce off the lower line and rise to the top one. Of course, that might not happen. If we see it punch through the lower line, then it could drop all the way down to about the price of B.
$ $ $
Here's a symbol list of 151 chart and candlestick patterns (13 "investment grade" candle patterns) found in today's securities using my version of Patternz: MMM, ACN, ADTN, AMD, AES, A, ALKS, ALGT, AXP, ABC, AIZ, ATO, AVY, AVA, AXS, AZTA, BMI, BALL, BIG, BMRN, CX, CENX, CHKP, CHS, CI, CLNE, CLF, CNX, CXW, DHR, DSGR, ^DJI, DTE, ELV, EZPW, FIS, FTNT, FWRD, GME, GFS, HQY, HSIC, HOV, HUBG, JBHT, ITW, IPAR, IPG, INTU, ISRG, JAZZ, JBLU, JNJ, KBH, LAMR, RAMP, LMT, LOW, MHO, MRO, MCHX, MU, NFG, NFLX, NWL, NEU, OLN, OMCL, ASGN, ON, OTEX, ORCL, OR, PKG, PKE, PTEN, PEN, PETS, PLXS, PPG, QCOM, DGX, REGN, RHI, SLB, SRE, SLGN, LUV, SWN, SPLK, SPSC, SCS, SUM, SRDX, SNPS, TRGP, TDOC, TDC, TER, TEVA, TMO, RIG, TREX, VEEV, MDRX, WAT, WU, WSM, WDAY, IYK, DDM, BOTZ, ICF, IHF, SOXX, EWO, EWK, EWC, EIS, THD, EWU, DBA, PEJ, SSO, XLP, XRT, SPY, XAR, SMH, VHT. Click this link for details (pattern type, start and end dates).
For a list of small patterns (those a few days wide) click this link.
$ $ $
The following table shows where Fibonacci retrace values of the day's high-low range are plus pivot points, calculated on the Nasdaq composite, sorted by value. When several are near each other (small differences), the area might act as support or resistance.
-- Thomas Bulkowski
![]()
| © 2023 ThePatternSite.com Metric | Value | Diff | Close (within 10% of the high-low range for the day)? |
| Monthly S2 | 13,034.71 | ||
| Weekly S2 | 13,411.09 | 376.39 | |
| Monthly S1 | 13,696.36 | 285.27 | |
| Weekly S1 | 13,884.56 | 188.19 | |
| Monthly Pivot | 13,964.24 | 79.68 | |
| Weekly Pivot | 14,058.33 | 94.10 | |
| Daily S2 | 14,244.43 | 186.09 | |
| Daily S1 | 14,301.22 | 56.80 | |
| Low | 14,317.09 | 15.87 | |
| Close | 14,358.02 | 40.93 | |
| 61.8% Down from Intraday High | 14,366.54 | 8.52 | Yes! The 61.8% Down from Intraday High is close to the Close. |
| Daily Pivot | 14,373.89 | 7.34 | Yes! The Daily Pivot is close to the 61.8% Down from Intraday High. |
| 50% Down from Intraday High | 14,381.82 | 7.93 | Yes! The 50% Down from Intraday High is close to the Daily Pivot. |
| 38.2% Down from Intraday High | 14,397.10 | 15.28 | |
| Open | 14,398.53 | 1.43 | Yes! The Open is close to the 38.2% Down from Intraday High. |
| Daily R1 | 14,430.68 | 32.15 | |
| High | 14,446.55 | 15.87 | |
| Daily R2 | 14,503.35 | 56.80 | |
| Weekly R1 | 14,531.80 | 28.45 | |
| Monthly R1 | 14,625.89 | 94.10 | |
| Weekly R2 | 14,705.57 | 79.68 | |
| Monthly R2 | 14,893.77 | 188.19 |
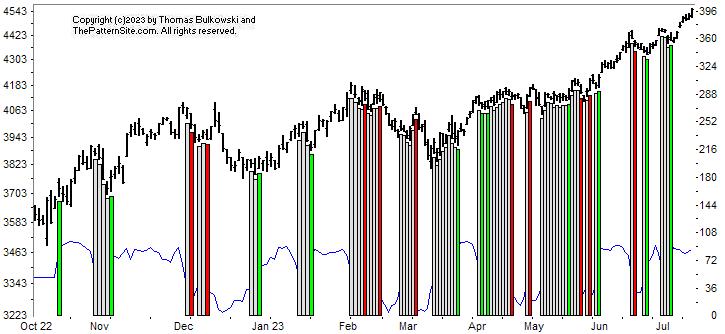
This is a picture of the chart pattern indicator on the daily scale. The indicator is the line chart below a chart of the S&P 500 composite.
The Dow industrials climbed 366 points today (Tuesday), an indication of the strength of the upward move.
The CPI is bullish as the chart shows with a green vertical bar on the far right of the chart. Notice that you don't see neutral (white) bars to the right of the green one (yet). So that means the run is still coasting upward.
Does all of this suggest the uptrend will end soon?
The red line is the percentage of stocks at least 20% below their 1-year high (plotted upside down). The blue line is the average percentage drop of stocks below their 1-year high (plotted upside down).
On Tuesday, 31% of stocks in my database are in bear market territory (down at least 20% from their 1-year high).A week ago, it was 33%.The fewest was 31% on 07/18/2023.And the most was 77% on 09/26/2022.
The 523 stocks in my database are down an average of 15% from their yearly high.A week ago, the average was 16%.The peak was 15% on 07/18/2023.And the bottom was 34% on 09/30/2022.
The green line shows the longer-term uptrend in the indicator. I believe it continues to show strength. Both lines show improvement from the reading taken a week ago.
Both charts are bullish, suggesting either a nasty bearish surprise is coming or the bull run remains intact. I'm hoping the upward run continues.
$ $ $
Here's a symbol list of 129 chart and candlestick patterns (13 "investment grade" candle patterns) found in today's securities using my version of Patternz: ABT, ANF, ACN, ADTN, AFL, ATSG, ALKS, ALGT, AYX, AEO, AXP, ASH, ATO, AVA, AXS, BSET, BERY, BOOT, BSX, CX, CENX, CF, CHS, CSCO, CLNE, CNX, CMCO, COST, COTY, CMI, CW, DFS, D, EXPD, EZPW, FDS, FARO, FWRD, GD, GL, GOOGL, GPRO, GFF, HLIT, HAYN, HQY, HTLD, HL, HSY, HUN, ITW, INFN, ITGR, IBKR, ISRG, JBLU, KBH, LZB, LLY, LMT, MHO, MKTX, MLM, MDC, MDT, MU, MS, MYGN, NBR, NCR, JWN, NOC, OLN, OMCL, PKG, RRC, RTX, RGA, RLI, RCKY, ROST, R, SAIA, SCHW, STR, LUV, SWN, SPLK, SCS, SRDX, TDOC, TDG, TRV, TZOO, TREX, TWLO, UNH, WAT, WERN, WSM, WWW, WWD, IAI, IHE, DDM, IHF, IXN, IEO, EIS, EZA, THD, XLP, XLF, GLD, XLI, XRT, SPY, XLK, VIS. Click this link for details (pattern type, start and end dates).
For a list of small patterns (those a few days wide) click this link.
-- Thomas Bulkowski
![]()
$ $ $
I show another slider trading quiz featuring Valero Energy: VLO stock.
$ $ $
Here's a symbol list of 120 chart and candlestick patterns (13 "investment grade" candle patterns) found in today's securities using my version of Patternz: ABM, ACN, ACIW, ATVI, ADBE, A, APD, ALK, AMGN, AAPL, ACGL, ANET, AIZ, AVY, BOOT, BCO, BMY, CX, CNP, CENX, CDAY, CNO, CMTL, CCRN, DDS, DSGR, ^DJT, ^DJI, BOOM, EQT, EL, EG, FDS, FICO, FARO, FIS, FISV, FORM, FTV, FCX, GMS, GOOGL, GPRO, HP, HSIC, HOLX, HURC, INFN, JKHY, LRCX, LPLA, MAN, MAS, MU, NFG, NEWR, ORI, OLN, OMC, PANW, PTEN, PFE, PFG, PSTG, QCOM, RJF, RGS, ROK, RES, SEIC, SMTC, SKX, SO, SCS, TPR, TGT, TFX, TPX, TDC, TXN, TSCO, TRV, UIS, VECO, VMC, WRB, WERN, WWW, WDAY, XEL, IYM, DDM, FDN, QTEC, FXL, IYZ, IXN, EWK, EWQ, EZA, EWY, THD, TUR, EWU, DBA, PBE, SSO, SPY, XLK. Click this link for details (pattern type, start and end dates).
For a list of small patterns (those a few days wide) click this link.
$ $ $
The following table shows where Fibonacci retrace values of the day's high-low range are plus pivot points, calculated on the Dow industrials, sorted by value. When several are near each other (small differences), the area might act as support or resistance.
-- Thomas Bulkowski
![]()
| © 2023 ThePatternSite.com Metric | Value | Diff | Close (within 10% of the high-low range for the day)? |
| Monthly S2 | 33,280.70 | ||
| Weekly S2 | 33,407.85 | 127.15 | |
| Monthly S1 | 33,933.03 | 525.18 | |
| Weekly S1 | 33,996.60 | 63.57 | |
| Monthly Pivot | 34,262.64 | 266.04 | |
| Weekly Pivot | 34,294.43 | 31.79 | |
| Daily S2 | 34,309.98 | 15.55 | Yes! The Daily S2 is close to the Weekly Pivot. |
| Low | 34,418.72 | 108.74 | |
| Daily S1 | 34,447.66 | 28.95 | |
| Open | 34,499.74 | 52.07 | |
| 61.8% Down from Intraday High | 34,512.86 | 13.12 | Yes! The 61.8% Down from Intraday High is close to the Open. |
| 50% Down from Intraday High | 34,541.93 | 29.08 | |
| Daily Pivot | 34,556.41 | 14.47 | Yes! The Daily Pivot is close to the 50% Down from Intraday High. |
| 38.2% Down from Intraday High | 34,571.02 | 14.61 | Yes! The 38.2% Down from Intraday High is close to the Daily Pivot. |
| Close | 34,585.35 | 14.34 | Yes! The Close is close to the 38.2% Down from Intraday High. |
| High | 34,665.15 | 79.80 | |
| Daily R1 | 34,694.09 | 28.95 | |
| Daily R2 | 34,802.84 | 108.74 | |
| Weekly R1 | 34,883.18 | 80.34 | |
| Monthly R1 | 34,914.96 | 31.79 | |
| Weekly R2 | 35,181.01 | 266.05 | |
| Monthly R2 | 35,244.58 | 63.57 |
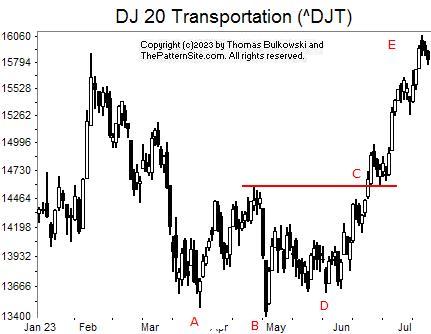
AB is a double bottom. However, if you include D, then you can interpret it as a head-and-shoulders bottom chart pattern.
Either way is fine but you get a slightly taller measure rule prediction with the double bottom. What does that mean? I use the height of the pattern to help predict a target price. That way, I can assign probabilities of how often price will reach the target.
Price reaches the target 73% of the time for an Adam & Adam double bottom, for example.
In this case, we see that the BC height added to C gives us E. So if we were able to buy an ETF related to the transports, we could buy at C and exit at our E target. It would have worked wonderfully this time.
$ $ $
I added Lessons to broadening bottoms. I plan to add this section to other chart patterns, too. I think it'll help you better decide which patterns to trade and which to avoid.![]()
The following is a brief review of how the markets performed over time. The numbers refer to the close-to-close move in the Dow industrials.
Many options expire this week, so traders will be looking to close out their positions, and that suggests increased volatility (large daily price swings).
![]()
The following is based on an SFO article in December 2004 by John Seekinger, titled, "Take a two-dimensional approach." He offers these tips.
| Index | S2 | S1 | Pivot | R1 | R2 |
| Dow Industrials (^DJI): Daily | 34,342 | 34,425 | 34,509 | 34,592 | 34,676 |
| Weekly | 33,382 | 33,946 | 34,269 | 34,832 | 35,156 |
| Monthly | 33,255 | 33,882 | 34,237 | 34,864 | 35,219 |
| S&P500 (^GSPC): Daily | 4,483 | 4,494 | 4,511 | 4,522 | 4,539 |
| Weekly | 4,337 | 4,421 | 4,474 | 4,559 | 4,612 |
| Monthly | 4,222 | 4,364 | 4,446 | 4,587 | 4,669 |
| Nasdaq (^IXIC): Daily | 13,992 | 14,053 | 14,143 | 14,203 | 14,293 |
| Weekly | 13,330 | 13,722 | 13,977 | 14,369 | 14,624 |
| Monthly | 12,953 | 13,533 | 13,883 | 14,463 | 14,812 |
Here are the formulas:
![]()
Earnings season is either underway or should be starting soon. The sessions could be more volatile.
Here's a symbol list of 155 chart and candlestick patterns (13 "investment grade" candle patterns) found in today's securities using my version of Patternz: AFL, ALGT, ALL, AYX, AMED, AFG, AIG, AR, ADM, AIZ, AGO, AVY, AVNT, BSET, BOOT, BAH, BSX, BFH, BMY, CLS, CNP, CHKP, CVX, CHS, CINF, CLNE, CNX, CSGP, CCK, DVN, FANG, DFS, DSGR, ^DJT, ^DJI, DUK, ECL, EIX, EFX, EG, FAST, FDX, FIS, FE, FLS, FTNT, FNV, FCX, IT, GNW, GS, GPRO, GFF, THG, HIG, HL, HSIC, DHI, IEX, IRM, KLIC, LEN, LLY, L, LOW, LPLA, MKTX, MTRX, MSFT, MOS, MUR, NFG, NFLX, NOVT, OLN, OTEX, OXM, PKG, PKE, PDCO, PAYX, PLXS, POR, PRU, PHM, RL, RJF, RNG, SAND, SCHW, SCI, SMAR, SWN, SCS, SSYS, SUM, TFX, TPX, TSCO, TRV, UHAL, UGI, UNM, VC, WAT, WLK, IYM, IAI, IYE, IAT, IYZ, IEV, IXC, IXN, SOXX, SLV, IEO, IYF, EWA, EWO, EWC, EWQ, EWM, EWY, EWP, EWU, DBA, PEJ, PXJ, ROBO, XLP, XLE, XLF, XLB, XAR, XLK, SMH, VIS. Click this link for details (pattern type, start and end dates).
For a list of small patterns (those a few days wide) click this link.
The below industries were the best (rank 1) or worst performing of those I follow.
|
-- Thomas Bulkowski
![]()
$ $ $
Here's a symbol list of 183 chart and candlestick patterns (13 "investment grade" candle patterns) found in today's securities using my version of Patternz: AXDX, ALGT, AYX, AMZN, AEE, AFG, AR, ANET, AXS, BMI, BKNG, BOOT, BFH, BLDR, BG, CPB, CNC, CNP, CF, CVX, CNO, CNX, CGNX, COP, CXW, CRH, CTS, DDS, DSGR, ^DJU, ^DJT, DRQ, DTE, DUK, BOOM, ECL, EIX, EFX, EG, EXPI, FAST, FDX, FISV, FLS, FORM, FCX, FRD, IT, GNW, GL, GOOGL, GPRO, THG, HQY, HL, HP, HNI, HD, DHI, INFN, INTU, NVTA, IRM, JNJ, KLAC, KLIC, LRCX, LAMR, RAMP, LOW, MHO, M, MGY, MRO, MTRX, MDT, MRK, META, ^IXIC, NCR, NWPX, NVDA, PKG, PKE, PTEN, PAYX, POR, PG, QCOM, RMBS, RNG, ^GSPC, SBH, SAND, SEIC, SIGI, SCI, SHOP, SKX, SCCO, SCS, SSYS, SRDX, SNPS, TPX, TER, TTD, TSCO, TZOO, UGI, UIS, VECO, VC, WU, WLK, IYE, FTEC, FDN, QTEC, FXL, FXI, BOTZ, QQQ, IEV, MXI, IXN, SOXX, SLV, EWA, EWO, EWK, EWC, EEM, EWQ, EWG, EWH, EIS, EWI, EWJ, EWM, EPP, EWS, EZA, EWY, EWP, EWD, EWL, EWT, EWU, QLD, PBE, PJP, ROBO, XLE, XRT, XLK, UNG, USO, SMH, MGK, VONG. Click this link for details (pattern type, start and end dates).
For a list of small patterns (those a few days wide) click this link.
$ $ $
You can find setups based on a Fibonacci retrace by clicking on the link.
The following patterns were found manually, not using Patternz. Mr. Bulkowski has excluded any securities he owns from appearing in the list. However, he may add any of the securities listed to his portfolio at any time, just as you can.
In the table below, the red and green colors are based on the historical breakout direction for the associated chart pattern. If a high and tight flag appears, the start and end dates highlight the flagpole only and not the flag.
For details about the chart patterns, click here.
-- Thomas Bulkowski
![]()
| Symbol | Chart Pattern | Bullish Bearish | Start | End | Industry |
| ACIW | Pipe bottom | 06/20/2023 | 06/26/2023 | IT Services | |
| AYI | Triple bottom | 06/23/2023 | 07/06/2023 | Furn/Home Furnishings | |
| ADTN | Triangle, symmetrical | 06/16/2023 | 07/10/2023 | Telecom. Equipment | |
| ALRM | Pipe bottom | 06/20/2023 | 06/26/2023 | Computer Software and Svcs | |
| ALB | Three Rising Valleys | 05/02/2023 | 06/29/2023 | Chemical (Diversified) | |
| AEP | Double Bottom, Eve and Adam | 06/02/2023 | 06/29/2023 | Electric Utility (Central) | |
| AMGN | Double Bottom, Adam and Adam | 06/28/2023 | 07/07/2023 | Biotechnology | |
| APA | Head-and-shoulders bottom | 05/04/2023 | 06/28/2023 | Petroleum (Producing) | |
| BIO | Triple bottom | 05/11/2023 | 06/20/2023 | Medical Supplies | |
| CBT | Double Bottom, Eve and Adam | 06/23/2023 | 07/06/2023 | Chemical (Diversified) | |
| CNP | Broadening top | 06/12/2023 | 07/05/2023 | Electric Utility (Central) | |
| CF | Ugly double bottom | 06/01/2023 | 06/27/2023 | Chemical (Basic) | |
| CSCO | Triangle, symmetrical | 06/16/2023 | 07/11/2023 | Computers and Peripherals | |
| CNA | Triangle, descending | 06/08/2023 | 07/13/2023 | Insurance (Prop/Casualty) | |
| CTS | Double Bottom, Adam and Adam | 06/28/2023 | 07/10/2023 | Electronics | |
| XRAY | Pipe bottom | 05/22/2023 | 05/30/2023 | Medical Supplies | |
| ^DJT | Rounding bottom | 02/02/2023 | 07/12/2023 | None | |
| DOV | Ugly double bottom | 06/01/2023 | 06/23/2023 | Machinery | |
| DTE | Double Bottom, Adam and Adam | 06/29/2023 | 07/10/2023 | Electric Utility (Central) | |
| DUK | Triple bottom | 06/02/2023 | 07/10/2023 | Electric Utility (East) | |
| EMN | Triple bottom | 03/24/2023 | 06/23/2023 | Chemical (Diversified) | |
| EBAY | Triangle, symmetrical | 05/31/2023 | 07/10/2023 | Internet | |
| EMR | Ugly double bottom | 05/31/2023 | 07/06/2023 | Computers and Peripherals | |
| EOG | Double Bottom, Eve and Eve | 06/01/2023 | 06/23/2023 | Natural Gas (Distributor) | |
| EZPW | Double Bottom, Adam and Adam | 06/27/2023 | 07/06/2023 | Financial Services | |
| FDS | Pipe top | 06/12/2023 | 06/20/2023 | Information Services | |
| FE | Head-and-shoulders bottom | 05/02/2023 | 06/29/2023 | Electric Utility (East) | |
| GFS | Pipe bottom | 06/20/2023 | 06/26/2023 | Semiconductor | |
| GS | Double Bottom, Eve and Eve | 06/27/2023 | 07/07/2023 | Securities Brokerage | |
| GOOGL | Double Bottom, Adam and Adam | 06/27/2023 | 07/11/2023 | Internet | |
| GGG | Broadening top | 06/13/2023 | 07/06/2023 | Machinery | |
| HTLD | Triple top | 06/07/2023 | 06/29/2023 | Trucking/Transp. Leasing | |
| HSIC | Ugly double bottom | 05/31/2023 | 07/06/2023 | Medical Supplies | |
| HURC | Broadening bottom | 05/15/2023 | 07/12/2023 | Machinery | |
| ILMN | Double Bottom, Eve and Eve | 06/28/2023 | 07/10/2023 | Biotechnology | |
| JNJ | Diamond top | 06/16/2023 | 07/03/2023 | Medical Supplies | |
| KMT | Double Bottom, Adam and Adam | 06/23/2023 | 07/06/2023 | Metal Fabricating | |
| LHX | Ugly double bottom | 05/31/2023 | 06/26/2023 | Aerospace/Defense | |
| LZB | Ugly double bottom | 06/21/2023 | 07/07/2023 | Furn/Home Furnishings | |
| MRO | Double Bottom, Eve and Adam | 06/23/2023 | 07/06/2023 | Petroleum (Integrated) | |
| MDT | Triangle, symmetrical | 05/03/2023 | 07/13/2023 | Medical Supplies | |
| MRK | Triple top | 06/05/2023 | 06/30/2023 | Drug | |
| MLKN | Scallop, ascending | 06/07/2023 | 07/13/2023 | Furn/Home Furnishings | |
| MUR | Double Bottom, Adam and Adam | 06/23/2023 | 07/06/2023 | Petroleum (Integrated) | |
| NWL | Ugly double bottom | 06/23/2023 | 07/05/2023 | Household Products | |
| OLN | Double Bottom, Adam and Adam | 06/01/2023 | 06/23/2023 | Chemical (Basic) | |
| ON | Three Rising Valleys | 04/27/2023 | 06/23/2023 | Semiconductor | |
| OTEX | Double Bottom, Eve and Eve | 06/23/2023 | 07/07/2023 | E-Commerce | |
| OUT | Pipe bottom | 06/20/2023 | 06/26/2023 | Advertising | |
| OXM | Pipe bottom | 06/20/2023 | 06/26/2023 | Apparel | |
| PTEN | Ugly double bottom | 05/31/2023 | 06/23/2023 | Oilfield Svcs/Equipment | |
| QCOM | Double Bottom, Adam and Adam | 06/23/2023 | 07/06/2023 | Telecom. Equipment | |
| RL | Ugly double bottom | 06/01/2023 | 06/27/2023 | Apparel | |
| RGLD | Head-and-shoulders bottom | 06/21/2023 | 07/06/2023 | Metals and Mining (Div.) | |
| CRM | Triangle, symmetrical | 05/31/2023 | 07/10/2023 | E-Commerce | |
| SWX | Ugly double bottom | 05/04/2023 | 06/23/2023 | Natural Gas (Distributor) | |
| SSYS | Pipe bottom | 06/20/2023 | 06/26/2023 | Electronics | |
| TECH | Double Bottom, Adam and Adam | 06/14/2023 | 06/28/2023 | Biotechnology | |
| SLCA | Double Bottom, Adam and Adam | 06/23/2023 | 07/06/2023 | Metals and Mining (Div.) | |
| VFC | Broadening top, right-angled and descending | 06/08/2023 | 07/12/2023 | Apparel | |
| VC | Three Rising Valleys | 05/04/2023 | 06/26/2023 | Electronics | |
| WU | Triple bottom | 05/31/2023 | 07/06/2023 | Financial Services | |
| WPM | Broadening bottom | 06/21/2023 | 07/13/2023 | Metals and Mining (Div.) | |
| ZBRA | Pipe bottom | 06/20/2023 | 06/26/2023 | Computers and Peripherals |
![]()
Since I post this the night before, check how the futures are trading before market open. Large moves can affect the opening direction.
$ $ $
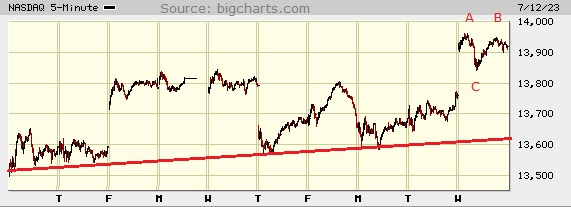
I show a picture of the Nasdaq composite on the 5-minute scale.
I drew a red support line connecting the valleys just to see how they line up.
This is one weird looking chart, isn't it? The holiday puts a whole in the chart and the indices have bounced around, too, adding to the presentation.
At AB, we see a potential double top. I write potential because the index has to drop below C before it confirms the double top. I was going to write that I don't see that happening but with the index bouncing around so much, anything can happen.
The position of C on the chart also denotes a support area, so if the index drops to that area, I would expect it to stall there. Let's wait and see what happens. I went grocery shopping this morning, so
I have my supply of popcorn handy while I wait. ![]()
$ $ $
Here's a symbol list of 312 chart and candlestick patterns (13 "investment grade" candle patterns) found in today's securities using my version of Patternz: ABT, ANF, AXDX, ACIW, AES, A, APD, ATSG, ALRM, AA, AYX, AEE, AXP, AFG, AMN, AR, AON, APOG, AMAT, ATR, ADM, ASH, AGO, ATO, ADSK, AVY, AXS, BMI, BSET, BERY, BIO, BA, BOOT, BAH, BRC, BFH, BMY, BRKR, BBW, BLDR, BG, CBT, CPB, CE, CLS, CNP, CDAY, CVX, CHS, CIEN, CLF, CNX, CGNX, ED, COP, CXW, CR, CRH, CROX, CCK, CMI, CW, XRAY, DDS, DFS, ^DJT, ^DJI, DRQ, DTE, DUK, EMN, ELV, EFX, EG, EVH, EXPI, FFIV, FAST, FDX, FLS, FORM, FNV, GPS, IT, GNW, GFS, GL, GPRO, THG, HLIT, HE, HAYN, HQY, HL, HSII, HNI, HD, DHI, HWM, HUBG, HUM, HUN, HURC, IEX, ITW, INCY, INFN, NSP, IBP, IIIN, IBKR, TILE, INTU, NVTA, JAZZ, KALU, KBH, KFRC, KLAC, LZB, LRCX, LAMR, LEN, LNC, LXU, MHO, MTSI, M, MAN, MRO, MAS, MA, MTRN, MTRX, MDC, MRK, MLKN, MCO, MS, MOS, MLI, MUR, MYGN, NBR, NOV, NCR, NTAP, NEE, NXGN, JWN, NOC, NTNX, NVDA, OXY, ORI, OMC, OUT, OXM, PKG, PANW, PKE, PATK, PDCO, PRFT, PLXS, POR, PPL, PHM, PSTG, QTWO, RMBS, RTX, RNG, RHI, ROG, ROST, RGLD, SLB, SIGI, SRE, SMTC, SCI, SHOP, SLGN, SCCO, SR, SPLK, SPSC, SCS, TPR, TPX, TDC, TER, TXN, TJX, TSCO, RIG, TZOO, TG, UHAL, UIS, UNH, VFC, VEEV, V, VC, VMC, WU, WLK, WMB, WSM, WSC, ITA, IYM, IAI, IYC, IYE, ITB, DDM, BOTZ, ICF, IYH, IHF, IAT, IEV, IXC, MXI, IXN, ILF, SOXX, SLV, IGE, IEO, IYF, IHI, EWA, EWO, EWK, ECH, EEM, EWQ, EWG, EWH, EIS, EWI, EWM, EPP, EWS, EZA, EWY, EWP, EWD, EWL, EWT, THD, EWU, IBB, DBA, PBE, PEJ, PJP, PHO, ROBO, XLY, XLE, XLF, GLD, XLV, XHB, XRT, XLK, USO, SMH, VHT, VAW. Click this link for details (pattern type, start and end dates).
For a list of small patterns (those a few days wide) click this link.
$ $ $
The following table shows where Fibonacci retrace values of the day's high-low range are plus pivot points, calculated on the Nasdaq composite, sorted by value. When several are near each other (small differences), the area might act as support or resistance.
-- Thomas Bulkowski
![]()
| © 2023 ThePatternSite.com Metric | Value | Diff | Close (within 10% of the high-low range for the day)? |
| Monthly S2 | 12,852.91 | ||
| Monthly S1 | 13,385.94 | 533.02 | |
| Weekly S2 | 13,499.65 | 113.72 | |
| Monthly Pivot | 13,622.50 | 122.85 | |
| Weekly S1 | 13,709.31 | 86.80 | |
| Weekly Pivot | 13,776.90 | 67.60 | |
| Daily S2 | 13,786.86 | 9.96 | Yes! The Daily S2 is close to the Weekly Pivot. |
| Low | 13,842.13 | 55.27 | |
| Daily S1 | 13,852.91 | 10.78 | Yes! The Daily S1 is close to the Low. |
| 61.8% Down from Intraday High | 13,888.47 | 35.56 | |
| 50% Down from Intraday High | 13,902.79 | 14.32 | |
| Daily Pivot | 13,908.18 | 5.39 | Yes! The Daily Pivot is close to the 50% Down from Intraday High. |
| Open | 13,915.64 | 7.46 | Yes! The Open is close to the Daily Pivot. |
| 38.2% Down from Intraday High | 13,917.11 | 1.47 | Yes! The 38.2% Down from Intraday High is close to the Open. |
| Close | 13,918.96 | 1.85 | Yes! The Close is close to the 38.2% Down from Intraday High. |
| High | 13,963.45 | 44.49 | |
| Daily R1 | 13,974.23 | 10.78 | Yes! The Daily R1 is close to the High. |
| Weekly R1 | 13,986.56 | 12.33 | |
| Daily R2 | 14,029.50 | 42.94 | |
| Weekly R2 | 14,054.15 | 24.65 | |
| Monthly R1 | 14,155.53 | 101.37 | |
| Monthly R2 | 14,392.09 | 236.57 |
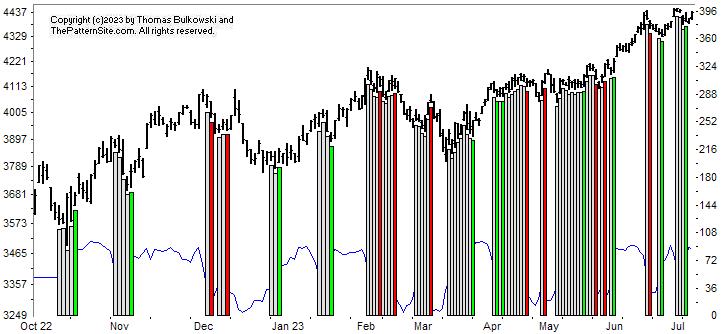
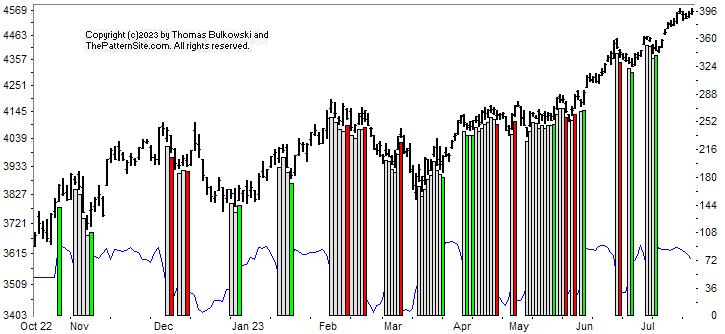
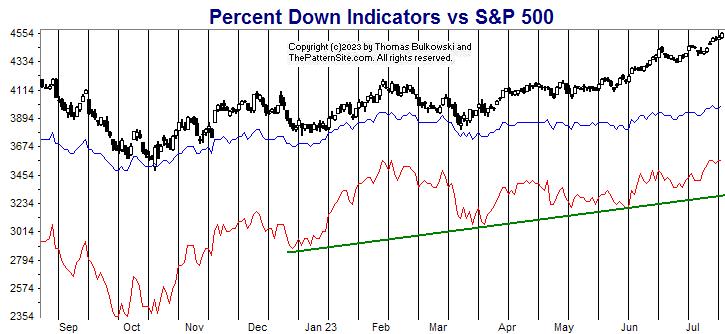
This is a picture of the chart pattern indicator on the daily scale. The indicator is the line chart below a chart of the S&P 500 composite.
The most recent signal is bullish as the vertical green bar on the far right of the chart shows.
It suggests that the uptrend will continue. Interpolating the chart says that the signal is at 90 out of 100. So there's room for growth. If it were pegged at 100, chances are that the CPI would reverse (it couldn't go higher). That would suggest a downturn was coming.
The red line is the percentage of stocks at least 20% below their 1-year high (plotted upside down). The blue line is the average percentage drop of stocks below their 1-year high (plotted upside down).
On Tuesday, 33% of stocks in my database are in bear market territory (down at least 20% from their 1-year high).A week ago, it was 35%.The fewest was 31% on 02/02/2023.And the most was 77% on 09/26/2022.
The 523 stocks in my database are down an average of 16% from their yearly high.A week ago, the average was 16%.The peak was 16% on 07/11/2023.And the bottom was 34% on 09/30/2022.
The red line this week shows improvement when compared to where it was a week ago.
It continues a stair-step type rise since the September low. However, this chart shows the red line matching where it was at the June peak. Does this mean it's hitting overhead resistance?
Answer: I don't know. Based on what I see in the rest of the chart (that is, the horizontal to up move from May to June) suggests we can see another move higher.
So this week, both charts are bullish. I see the indices climbing to new highs.
$ $ $
Here's a symbol list of 188 chart and candlestick patterns (13 "investment grade" candle patterns) found in today's securities using my version of Patternz: ABM, ACN, AYI, AEIS, A, AEO, AMWD, ANIK, APOG, AAPL, BMI, BSET, BA, BKNG, BOOT, BFH, BMY, CLS, CVX, CHS, CSCO, CNA, CNX, CGNX, CL, COP, GLW, CMI, DVN, FANG, DFS, DSGR, D, DOV, DRQ, EBAY, EME, WIRE, EFX, EG, EVH, FDS, FLS, FORM, GME, GPS, GES, HLIT, HIG, HELE, HSIC, HOLX, HURC, ITW, INFN, JAZZ, JNJ, KBH, KMT, KEYS, KLAC, LRCX, LAMR, LMT, LOW, MHO, M, MANH, MRO, MLM, MTDR, MTRX, MDC, MRK, META, MLKN, MUR, NTAP, NWL, NWPX, NOVT, ORI, OTEX, PKE, PATK, PTEN, PETS, PXD, PINC, RMBS, REGN, RNG, RHI, ROK, CRM, SLB, SCHW, SMG, SMTC, SHW, STR, SMAR, SWX, SCS, TPR, TDOC, TDY, TMO, TKR, TJX, TOL, TRV, TZOO, TREX, UIS, VECO, VEEV, VC, WRB, WERN, WLK, WEX, WSM, WSC, WWW, ITA, IYC, IYE, IEZ, DDM, FTEC, FDN, BOTZ, IHF, IEV, IXC, IGE, IEO, EWA, EWK, EWZ, ECH, EEM, EWQ, EWG, EWI, EWM, EWS, EWD, EWL, THD, IBB, PEJ, PXJ, XLY, XLE, XLF, GLD, XHB, XLI, XRT, SPY, VHT, VIS. Click this link for details (pattern type, start and end dates).
For a list of small patterns (those a few days wide) click this link.
-- Thomas Bulkowski
![]()
$ $ $
I show another slider trading quiz featuring United Online: UNTD stock.
$ $ $
Here's a symbol list of 134 chart and candlestick patterns (13 "investment grade" candle patterns) found in today's securities using my version of Patternz: ACIW, ALRM, ALKS, ALL, AMWD, APA, ADM, ANET, AVA, BMI, BCPC, BIIB, BA, BFH, BMY, BLDR, CDNS, CRL, CHS, CNX, CGNX, CROX, CMI, FANG, DSGR, ^DJI, DRQ, EMR, EPAM, EFX, EVH, EXPI, FICO, FARO, FIS, FMC, GE, GIS, GFS, GOOGL, GES, HE, HELE, HD, PODD, IRM, JNJ, KBH, KELYA, LZB, LAMR, LANC, M, MRO, MCHX, MA, MTDR, MTRX, MDC, MLKN, MUR, NFG, NEE, NWPX, NOVT, NVDA, OUT, OXM, PATK, PDCO, PTEN, PGR, DGX, RGS, RNG, RLI, RHI, SCHW, SMG, SIGI, SRE, SWX, SSYS, TFX, TPX, TKR, TJX, TSCO, SLCA, VEEV, MDRX, WRB, WEX, WPM, WSM, ZBRA, ITA, IAI, IYE, IHE, BOTZ, ICF, IYH, IGV, IXC, IGE, IEO, EWA, ECH, EPP, EZA, EWY, TUR, EWU, IBB, PJP, XLE, XLF, XRT, VHT, VIS. Click this link for details (pattern type, start and end dates).
For a list of small patterns (those a few days wide) click this link.
$ $ $
The following table shows where Fibonacci retrace values of the day's high-low range are plus pivot points, calculated on the Dow industrials, sorted by value. When several are near each other (small differences), the area might act as support or resistance.
-- Thomas Bulkowski
![]()
| © 2023 ThePatternSite.com Metric | Value | Diff | Close (within 10% of the high-low range for the day)? |
| Monthly S2 | 32,788.60 | ||
| Weekly S2 | 33,293.40 | 504.80 | |
| Monthly S1 | 33,366.50 | 73.10 | |
| Daily S2 | 33,616.80 | 250.30 | |
| Weekly S1 | 33,618.90 | 2.10 | Yes! The Weekly S1 is close to the Daily S2. |
| Low | 33,705.68 | 86.78 | |
| Open | 33,705.68 | 0.00 | Yes! The Open is close to the Low. |
| Daily S1 | 33,780.60 | 74.92 | |
| 61.8% Down from Intraday High | 33,802.20 | 21.60 | Yes! The 61.8% Down from Intraday High is close to the Daily S1. |
| 50% Down from Intraday High | 33,832.02 | 29.82 | |
| 38.2% Down from Intraday High | 33,861.84 | 29.82 | |
| Daily Pivot | 33,869.48 | 7.64 | Yes! The Daily Pivot is close to the 38.2% Down from Intraday High. |
| Close | 33,944.40 | 74.92 | |
| High | 33,958.36 | 13.96 | Yes! The High is close to the Close. |
| Monthly Pivot | 33,977.59 | 19.23 | Yes! The Monthly Pivot is close to the High. |
| Daily R1 | 34,033.28 | 55.69 | |
| Weekly Pivot | 34,042.25 | 8.97 | Yes! The Weekly Pivot is close to the Daily R1. |
| Daily R2 | 34,122.16 | 79.91 | |
| Weekly R1 | 34,367.75 | 245.59 | |
| Monthly R1 | 34,555.49 | 187.74 | |
| Weekly R2 | 34,791.10 | 235.61 | |
| Monthly R2 | 35,166.58 | 375.48 |
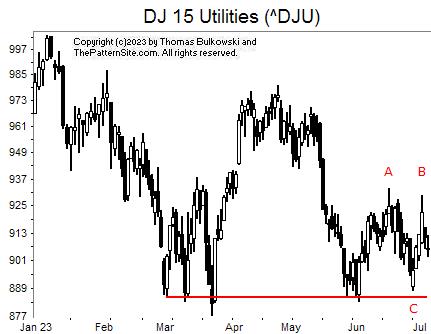
This is a chart of the Dow utilities on the daily scale.
The red line represents support. Notice how several valleys come near the line and rebound upward.
At AB, we see a potential double top. It won't become a valid double top until the index closes below C.
I'm not sure that's going to happen. I suspect that we'll see the index turn upward and eventually rise above A.
I suppose that since the index is already dropping toward C, that we could see it bounce off the red line another time before staging an upward run.
![]()
The following is a brief review of how the markets performed over time. The numbers refer to the close-to-close move in the Dow industrials.
No options expire this week.
![]()
The following is based on an SFO article in December 2004 by John Seekinger, titled, "Take a two-dimensional approach." He offers these tips.
| Index | S2 | S1 | Pivot | R1 | R2 |
| Dow Industrials (^DJI): Daily | 33,510 | 33,622 | 33,829 | 33,942 | 34,149 |
| Weekly | 33,224 | 33,479 | 33,972 | 34,228 | 34,721 |
| Monthly | 32,719 | 33,227 | 33,908 | 34,416 | 35,097 |
| S&P500 (^GSPC): Daily | 4,369 | 4,384 | 4,412 | 4,427 | 4,455 |
| Weekly | 4,342 | 4,371 | 4,413 | 4,442 | 4,485 |
| Monthly | 4,175 | 4,287 | 4,373 | 4,485 | 4,570 |
| Nasdaq (^IXIC): Daily | 13,560 | 13,610 | 13,707 | 13,758 | 13,855 |
| Weekly | 13,414 | 13,537 | 13,691 | 13,814 | 13,968 |
| Monthly | 12,767 | 13,214 | 13,536 | 13,983 | 14,306 |
Here are the formulas:
![]()
Earnings season will be starting in about 6 days.
Here's a symbol list of 159 chart and candlestick patterns (13 "investment grade" candle patterns) found in today's securities using my version of Patternz: ABM, AXDX, ACIW, ADTN, ATSG, ALRM, ALB, AA, ALKS, ADM, ANET, AVA, AXS, BMI, BALL, BECN, BIG, BA, BAH, BMY, CACI, CALM, CE, CLS, CNA, CGNX, CTSH, CMCO, CMTL, CRH, CROX, CCK, DVN, DDS, ^DJI, DRQ, EME, EOG, EFX, RE, EVRG, XOM, FIS, GME, GIS, GILD, GPN, GFS, GL, GES, HBI, HE, HSII, HSY, HOLX, HUM, HUN, ITGR, INTC, IPAR, IBKR, TILE, IPI, IRM, JAZZ, JNJ, KBH, LANC, RAMP, L, M, MGY, MRO, MDC, MRK, MU, MUR, NBR, NJR, NEU, NKE, NOVT, NUS, NVDA, OXY, OMC, OTEX, OUT, OXM, PATK, PDCO, PTEN, PXD, PINC, PSTG, RMBS, RTX, REGN, RNG, RHI, RCKY, RES, SMG, SMAR, LUV, SWX, SSYS, SRDX, TDOC, TDY, TER, TEVA, TXT, TKR, TJX, TZOO, TREX, MDRX, VC, WRB, WEX, ZBRA, IEZ, IHE, DDM, FXI, IYH, IHF, ILF, SLV, IEO, EWZ, ECH, EEM, EWQ, EWG, EWS, EWT, THD, IBB, PBE, PXJ, PJP, XLV, VHT. Click this link for details (pattern type, start and end dates).
For a list of small patterns (those a few days wide) click this link.
The below industries were the best (rank 1) or worst performing of those I follow.
|
-- Thomas Bulkowski
![]()
$ $ $
Here's a symbol list of 227 chart and candlestick patterns (13 "investment grade" candle patterns) found in today's securities using my version of Patternz: DDD, ANF, ABM, AXDX, ACN, ACIW, AEIS, AMD, ALRM, ALKS, AYX, ABC, AMN, ATR, ANET, AVNT, AXS, AZTA, BCPC, BBY, BIIB, BKH, BCO, BMY, BBW, CBT, CVX, CHD, CLNE, CLF, CGNX, CMCO, CRH, CROX, XRAY, FANG, DSGR, ^DJI, DOV, EXP, EOG, EFX, EXPI, FICO, FORM, FTNT, FTV, FCX, GME, GFS, GGG, GES, HBI, THG, HLIT, HAYN, HP, HOLX, DHI, IEX, ITW, INFN, IIIN, INTC, IPG, IRM, JAZZ, JNJ, KMT, KLIC, LZB, LANC, M, MRO, MLM, MAS, MTDR, MTRN, MDC, MDT, MU, MLI, MUR, MYGN, NTGR, NTAP, NEU, NEE, NXGN, NKE, NWPX, NOVT, OXY, OMC, ASGN, OUT, OMI, OXM, PKE, PATK, PETS, PFE, PXD, RNG, ROST, RGLD, SLB, SMG, SEE, SIGI, SRE, SCI, SHW, STR, SCCO, SWX, SSYS, SUM, TPR, TECH, TFX, TER, TEVA, TTD, TKR, UIS, VFC, WU, WLK, WPM, WMB, WWW, ZBRA, IYM, IYE, ITB, IHE, DDM, FTEC, QTEC, FXL, FXI, BOTZ, IHF, IAT, IEV, IGV, IXC, MXI, IXN, ILF, IGE, IEO, IHI, EWO, EWK, EWZ, EEM, EWQ, EWG, EWH, EIS, EWI, EWJ, EWW, EPP, EWS, EZA, EWY, EWP, EWD, EWL, EWT, EWU, IBB, PBE, PEJ, PJP, PHO, ROBO, XLV, XHB, XLI, XLB, XLK, UNG, VHT, VIS, VAW. Click this link for details (pattern type, start and end dates).
For a list of small patterns (those a few days wide) click this link.
$ $ $
You can find setups based on a Fibonacci retrace by clicking on the link.
The following patterns were found manually, not using Patternz. Mr. Bulkowski has excluded any securities he owns from appearing in the list. However, he may add any of the securities listed to his portfolio at any time, just as you can.
In the table below, the red and green colors are based on the historical breakout direction for the associated chart pattern. If a high and tight flag appears, the start and end dates highlight the flagpole only and not the flag.
For details about the chart patterns, click here.
-- Thomas Bulkowski
![]()
| Symbol | Chart Pattern | Bullish Bearish | Start | End | Industry |
| ALKS | Pipe top | 06/20/2023 | 06/26/2023 | Drug | |
| AEO | Ugly double bottom | 05/25/2023 | 06/26/2023 | Apparel | |
| AFG | Triangle, symmetrical | 05/19/2023 | 06/29/2023 | Insurance (Prop/Casualty) | |
| ADM | Head-and-shoulders bottom | 05/18/2023 | 06/21/2023 | Food Processing | |
| ADP | Triangle, ascending | 03/31/2023 | 07/06/2023 | IT Services | |
| BSET | Ugly double bottom | 06/01/2023 | 06/16/2023 | Furn/Home Furnishings | |
| BMY | Double Top, Adam and Eve | 06/05/2023 | 06/21/2023 | Drug | |
| BBW | Triangle, ascending | 05/11/2023 | 07/06/2023 | Retail (Special Lines) | |
| CROX | Pipe bottom | 06/20/2023 | 06/26/2023 | Shoe | |
| EPAM | Ugly double bottom | 06/06/2023 | 06/22/2023 | IT Services | |
| FDX | Pennant | 06/28/2023 | 07/06/2023 | Air Transport | |
| FNV | Pipe bottom | 02/21/2023 | 02/27/2023 | Metals and Mining (Div.) | |
| FRD | Big W | 06/01/2023 | 06/26/2023 | Building Materials | |
| GPN | Double Bottom, Adam and Adam | 05/31/2023 | 06/28/2023 | Computer Software and Svcs | |
| IDXX | Multi-peaks | 01/11/2023 | 07/06/2023 | Drug | |
| ITW | Ugly double bottom | 06/01/2023 | 06/23/2023 | Metal Fabricating | |
| IIIN | Head-and-shoulders top | 05/23/2023 | 06/30/2023 | Building Materials | |
| IRM | Pipe bottom | 06/20/2023 | 06/26/2023 | Industrial Services | |
| LANC | Pipe bottom | 06/12/2023 | 06/20/2023 | Food Processing | |
| M | Pipe bottom | 06/20/2023 | 06/26/2023 | Retail Store | |
| MTRX | Triangle, symmetrical | 03/06/2023 | 07/06/2023 | Oilfield Svcs/Equipment | |
| MU | Pipe top | 05/22/2023 | 05/30/2023 | Semiconductor | |
| NOV | Ugly double bottom | 05/31/2023 | 06/23/2023 | Oilfield Svcs/Equipment | |
| NKE | Double Top, Eve and Eve | 06/16/2023 | 06/29/2023 | Shoe | |
| OMC | Double Top, Eve and Adam | 06/14/2023 | 06/27/2023 | Advertising | |
| OMI | Double Top, Adam and Eve | 05/23/2023 | 06/07/2023 | Medical Supplies | |
| PLXS | Ugly double bottom | 05/04/2023 | 06/26/2023 | Electronics | |
| RHI | Ugly double bottom | 05/31/2023 | 06/23/2023 | Human Resources | |
| SLB | Ugly double bottom | 05/31/2023 | 06/23/2023 | Oilfield Svcs/Equipment | |
| SMG | Pipe bottom | 06/20/2023 | 06/26/2023 | Chemical (Basic) | |
| TDOC | Double Top, Adam and Adam | 06/07/2023 | 07/03/2023 | Healthcare Information | |
| TXN | Broadening top | 05/30/2023 | 07/03/2023 | Semiconductor | |
| WRB | Rising wedge | 05/23/2023 | 07/06/2023 | Insurance (Prop/Casualty) | |
| WMT | Double Bottom, Adam and Adam | 06/21/2023 | 06/29/2023 | Retail Store | |
| ZBRA | Three Rising Valleys | 05/02/2023 | 06/23/2023 | Computers and Peripherals |
![]()
Since I post this the night before, check how the futures are trading before market open. Large moves can affect the opening direction.
$ $ $
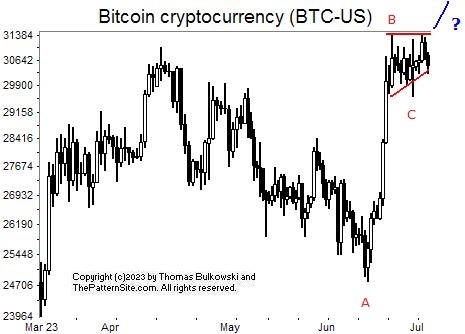
I show a picture of the cryptocurrency Bitcoin (BTC-USD) on the daily scale.
There's only one thing I want to mention about this chart and that's the potential of a pennant.
A flag (has parallel sides) or a pennant (unparallel sides) can appear midway through a move.
In this case, the pennant has to be perched atop a flagpole, which I show as the AB rise. If the pennant obeys the theory, the rise from the low at C should also be the same AB length.
How often does that work? In stocks, a move of 19% from A to B falls short on the C to (D, not shown) move by rising only 14%. So don't expect the full AB rise.
$ $ $
Here's a symbol list of 159 chart and candlestick patterns (13 "investment grade" candle patterns) found in today's securities using my version of Patternz: ABM, ACN, ACIW, ADBE, AMD, AES, ALRM, AA, ALKS, AEE, AXP, ATR, ADM, ANET, ATO, BCPC, BSET, BERY, BIIB, BMY, BBW, BG, CBT, CNP, CENX, CVX, CIEN, CGNX, COP, CROX, CCK, CW, FANG, ^DJU, D, DRQ, DTE, DUK, EIX, EOG, EFX, EXPI, FARO, FNV, FRD, GFS, HBI, HLIT, HAYN, HP, HURC, TILE, INTU, ISRG, IRM, JNJ, KELYA, LZB, LANC, LOW, MTSI, MRO, MAS, MTDR, MTRX, MDC, MS, NBR, NCR, NXGN, NKE, NOC, NWPX, NOVT, OXY, OTEX, ORCL, OR, OUT, OMI, OXM, PANW, PATK, PCTY, PXD, PPL, PEG, QCOM, RMBS, RGS, RNG, RHI, RGLD, RES, R, SLB, SMG, SMTC, SLGN, STR, SWX, SSYS, TEVA, TKR, TJX, SLCA, UIS, VFC, VMI, VEEV, MDRX, WAT, WEX, WPM, WMB, WOLF, WWW, ZBRA, IYE, ITB, IEZ, IDU, IAT, IXC, IGE, IEO, EWK, ECH, EWW, EZA, EWD, EWL, PXJ, XLU, UNG, VONG. Click this link for details (pattern type, start and end dates).
For a list of small patterns (those a few days wide) click this link.
$ $ $
The following table shows where Fibonacci retrace values of the day's high-low range are plus pivot points, calculated on the Nasdaq composite, sorted by value. When several are near each other (small differences), the area might act as support or resistance.
-- Thomas Bulkowski
![]()
| © 2023 ThePatternSite.com Metric | Value | Diff | Close (within 10% of the high-low range for the day)? |
| Monthly S2 | 12,330.82 | ||
| Monthly S1 | 13,061.24 | 730.41 | |
| Weekly S2 | 13,165.32 | 104.09 | |
| Monthly Pivot | 13,460.15 | 294.83 | |
| Weekly S1 | 13,478.49 | 18.33 | |
| Weekly Pivot | 13,647.58 | 169.10 | |
| Daily S2 | 13,719.88 | 72.30 | |
| Daily S1 | 13,755.77 | 35.88 | |
| Low | 13,764.25 | 8.48 | |
| Open | 13,772.10 | 7.85 | Yes! The Open is close to the Low. |
| Close | 13,791.65 | 19.55 | |
| 61.8% Down from Intraday High | 13,794.91 | 3.25 | Yes! The 61.8% Down from Intraday High is close to the Close. |
| Daily Pivot | 13,800.13 | 5.23 | Yes! The Daily Pivot is close to the 61.8% Down from Intraday High. |
| 50% Down from Intraday High | 13,804.38 | 4.24 | Yes! The 50% Down from Intraday High is close to the Daily Pivot. |
| 38.2% Down from Intraday High | 13,813.84 | 9.47 | |
| Daily R1 | 13,836.02 | 22.17 | |
| High | 13,844.50 | 8.48 | |
| Daily R2 | 13,880.38 | 35.88 | |
| Weekly R1 | 13,960.75 | 80.36 | |
| Weekly R2 | 14,129.84 | 169.10 | |
| Monthly R1 | 14,190.57 | 60.72 | |
| Monthly R2 | 14,589.48 | 398.92 |
$ $ $
Here's the updated 2023 forecast, presented in slider format.
$ $ $
Here's a symbol list of 139 chart and candlestick patterns (13 "investment grade" candle patterns) found in today's securities using my version of Patternz: ACN, AKAM, AA, ALKS, ALGT, ALL, AXP, AMAT, ASH, AIZ, BRC, BRKR, BBW, CAL, CLS, CVX, CHS, CLNE, CNO, CGNX, CMTL, CXW, CROX, ^DJT, BOOM, EBAY, EFX, FDS, FDX, FIS, FCX, GD, GPN, GS, GFF, GES, HIG, HQY, HOLX, HON, HUBG, HUN, ITW, INTC, IBKR, IPI, NVTA, JNJ, KALU, KSS, LRCX, LANC, RAMP, L, M, MOS, MUR, NFG, NOV, NCR, NTGR, NJR, NXGN, NKE, JWN, NUS, OXY, OUT, PATK, PTEN, PGR, KWR, QCOM, DGX, RMBS, RTX, RGA, RNG, RCKY, ^GSPC, SAIA, SAND, SCHW, SMTC, SLGN, STR, SKX, SKYW, SWX, SCS, TPR, TGT, TDOC, TFX, TXT, TKR, TDG, TG, UNH, V, VC, WEX, ZBRA, ITA, IAI, IYC, IYE, ITB, IEZ, FXI, IAT, MXI, ILF, IEO, EWZ, EEM, EWI, EWM, EPP, EWY, THD, PEJ, PXJ, XLY, XLE, XRT. Click this link for details (pattern type, start and end dates).
For a list of small patterns (those a few days wide) click this link.
$ $ $
The following table shows where Fibonacci retrace values of the day's high-low range are plus pivot points, calculated on the Dow industrials, sorted by value. When several are near each other (small differences), the area might act as support or resistance.
-- Thomas Bulkowski
![]()
| © 2023 ThePatternSite.com Metric | Value | Diff | Close (within 10% of the high-low range for the day)? |
| Monthly S2 | 32,019.72 | ||
| Monthly S1 | 33,219.09 | 1,199.38 | |
| Weekly S2 | 33,308.35 | 89.26 | |
| Weekly S1 | 33,863.41 | 555.06 | |
| Monthly Pivot | 33,903.89 | 40.48 | |
| Weekly Pivot | 34,165.38 | 261.49 | |
| Daily S2 | 34,211.14 | 45.77 | |
| Low | 34,286.54 | 75.39 | |
| Daily S1 | 34,314.80 | 28.27 | |
| 61.8% Down from Intraday High | 34,354.94 | 40.14 | |
| Open | 34,369.78 | 14.84 | Yes! The Open is close to the 61.8% Down from Intraday High. |
| 50% Down from Intraday High | 34,376.07 | 6.29 | Yes! The 50% Down from Intraday High is close to the Open. |
| Daily Pivot | 34,390.20 | 14.13 | Yes! The Daily Pivot is close to the 50% Down from Intraday High. |
| 38.2% Down from Intraday High | 34,397.20 | 7.00 | Yes! The 38.2% Down from Intraday High is close to the Daily Pivot. |
| Close | 34,418.47 | 21.27 | |
| High | 34,465.60 | 47.13 | |
| Daily R1 | 34,493.87 | 28.27 | |
| Daily R2 | 34,569.26 | 75.39 | |
| Weekly R1 | 34,720.44 | 151.18 | |
| Weekly R2 | 35,022.41 | 301.97 | |
| Monthly R1 | 35,103.26 | 80.85 | |
| Monthly R2 | 35,788.06 | 684.80 |
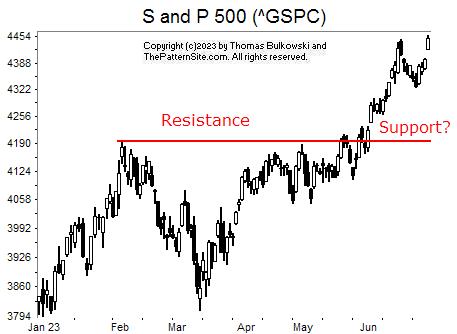
Not much is going on in this picture of the Nasdaq on the daily scale.
The red line highlights support and resistance. On the left half of the chart, we see the index bumping up against overhead resistance. On the right side, it's too soon to see if the index will drop and find support at the line.
Beyond that, I'm expecting the indices to continue moving higher over the next two weeks. Fortunately, after I rebalanced most of my portfolios in the last week or two, I feel well positioned to take advantage of any new highs.
![]()
The following is a brief review of how the markets performed over time. The numbers refer to the close-to-close move in the Dow industrials.
No options expire this week.
![]()
The following is based on an SFO article in December 2004 by John Seekinger, titled, "Take a two-dimensional approach." He offers these tips.
| Index | S2 | S1 | Pivot | R1 | R2 |
| Dow Industrials (^DJI): Daily | 34,184 | 34,296 | 34,382 | 34,493 | 34,579 |
| Weekly | 33,305 | 33,856 | 34,162 | 34,713 | 35,019 |
| Monthly | 32,016 | 33,212 | 33,900 | 35,096 | 35,784 |
| S&P500 (^GSPC): Daily | 4,408 | 4,429 | 4,444 | 4,465 | 4,480 |
| Weekly | 4,282 | 4,366 | 4,412 | 4,497 | 4,543 |
| Monthly | 4,053 | 4,252 | 4,355 | 4,554 | 4,657 |
| Nasdaq (^IXIC): Daily | 13,673 | 13,730 | 13,774 | 13,831 | 13,874 |
| Weekly | 13,164 | 13,476 | 13,646 | 13,958 | 14,129 |
| Monthly | 12,330 | 13,059 | 13,459 | 14,188 | 14,588 |
Here are the formulas:
![]()
Earnings season is over.
Here's a symbol list of 244 chart and candlestick patterns (13 "investment grade" candle patterns) found in today's securities using my version of Patternz: DDD, AYI, AEIS, AJRD, A, ALRM, ALL, DOX, AMED, AEL, AXP, AFG, AMWD, APH, AR, AON, APOG, AAPL, AIZ, AXS, BMI, BSET, BZH, BBY, BIO, BCO, BR, CBT, CPB, CHKP, CVX, CHS, CHD, CTAS, CLNE, CGNX, CTSH, CMTL, CONN, COST, CR, CRH, CCRN, DVN, DFS, DOV, BOOM, EFX, XOM, EZPW, FDS, FICO, FAST, FDX, FISV, FLEX, FLS, FTNT, FTV, FWRD, FRD, IT, GD, GE, GFS, GMS, GPRO, GGG, GES, HIG, HON, HWM, IDXX, NSP, IIIN, INTC, IBKR, TILE, IPG, IPI, JAZZ, JNJ, KEYS, KLAC, KLIC, LZB, LANC, LXU, MTSI, MANH, MRTN, MAS, MA, MDC, MRK, MRCY, MCO, MUR, MYGN, ^IXIC, NCR, NTGR, NWL, NXGN, JWN, NOC, NOVT, OXY, OLN, ON, OTEX, ORCL, OR, PKE, PATK, PETS, PPG, PG, PRU, DGX, RGS, RGA, RNG, RHI, ROK, ROP, ROST, RGLD, ^GSPC, SAIA, SAND, SCHW, SIGI, NOW, STR, SWX, SR, SPLK, SXI, SNPS, TRGP, TGT, TFX, TDC, TER, TXN, TMO, TKR, TJX, RIG, TG, UIS, UNH, MDRX, VRSN, V, WU, WDAY, ZBRA, IYM, IYC, IYE, ITB, IEZ, IHE, IDU, DDM, FTEC, FDN, QTEC, FXL, QQQ, IYH, IAT, IYZ, IGV, IXC, IXN, SOXX, IGE, IEO, IYF, IHI, EWC, EWQ, EWH, EWI, EWM, EWP, THD, QLD, PPA, PEJ, PXJ, PHO, SSO, ROBO, XLY, XLE, XLF, XLV, XHB, XLI, XLB, SPY, XLK, VHT, VIS, VAW, MGK, VONG. Click this link for details (pattern type, start and end dates).
For a list of small patterns (those a few days wide) click this link.
The below industries were the best (rank 1) or worst performing of those I follow.
|
-- Thomas Bulkowski
![]()
Support this site! Clicking any of the books (below) takes you to
Amazon.com If you buy ANYTHING while there, they pay for the referral.
Legal notice for paid links: "As an Amazon Associate I earn from qualifying purchases."
|
My Stock Market Books
|
My Novels
Orb Foresight Rewrite Coming!
|