
As of 04/21/2026
Indus: 49,149 -293.18 -0.6%
Trans: 23,933 +611.01 +2.6%
Utils: 1,134 -18.16 -1.6%
Nasdaq: 24,260 -144.42 -0.6%
S&P 500: 7,064 -45.13 -0.6%
|
YTD
+2.3%
+37.9%
+6.1%
+4.4%
+3.2%
|
|
As of 04/21/2026
Indus: 49,149 -293.18 -0.6%
Trans: 23,933 +611.01 +2.6%
Utils: 1,134 -18.16 -1.6%
Nasdaq: 24,260 -144.42 -0.6%
S&P 500: 7,064 -45.13 -0.6%
|
YTD
+2.3%
+37.9%
+6.1%
+4.4%
+3.2%
| |
|
| ||
Since I post this the night before, check how the futures are trading before market open. Large moves can affect the opening direction.
$ $ $
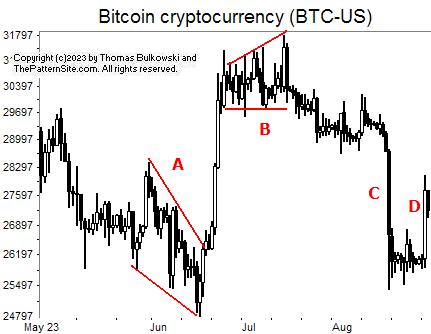
I show a picture of bitcoin (BTC-USD) on the daily scale.
I connected trends with red lines just to see what they showed.
At A, we see a falling wedge. It breaks out upward, as is usual for the pattern. I took some liberties drawing the bottom line at B by cutting through price and making the line look horizontal. The pattern forms a right-angled and ascending broadening formation.
At C, we see the currency taking a massive drop with a recovery (retrace) at D.
My expectation is that you'll see the currency drop back down from here for a while. In other words, I think the retrace of C is over.
$ $ $
Here's a symbol list of 164 chart and candlestick patterns (13 "investment grade" candle patterns) found in today's securities using my version of Patternz: ACIW, AMD, AYX, AMED, AME, APH, ATR, ADSK, AVY, AVNT, AZTA, BKH, BRKR, CAL, CE, CRL, CTAS, CLNE, CTSH, CMCO, CR, CCRN, DVN, FANG, DOV, BOOM, EXP, EFX, FDS, FARO, FAST, FDX, FIS, FIVN, FORM, FTNT, FTV, FWRD, GIS, GFS, GMS, HIG, HTLD, HP, HOV, HUM, HUN, HURC, INFN, IBP, PODD, IBKR, ISRG, IRM, KBH, KEYS, KLAC, KLIC, LRCX, LDOS, LEN, LLY, LOW, MTSI, MAS, MA, MTRX, MDC, META, MSFT, MCO, NBR, NFLX, NWL, NEE, NXGN, ON, OUT, PANW, PDCO, PTEN, PCTY, PYPL, PXD, PPG, RHI, RCKY, RGLD, SAND, SCHW, SMG, SEE, SIGI, SHOP, SR, SUM, SRDX, SNPS, TRGP, TDOC, TTD, TJX, TOL, TG, TWLO, SLCA, UNM, VECO, V, WRB, WEX, WPM, WDAY, ZBRA, IYE, IHE, FXI, QQQ, IXC, MXI, SLV, IGE, IEO, IHI, EWA, EWO, EWZ, EWC, EWQ, EIS, EWW, EPP, EZA, EWU, QLD, PPA, PBE, PHO, XLY, XLF, GLD, UNG, USO, VONG. Click this link for details (pattern type, start and end dates).
For a list of small patterns (those a few days wide) click this link.
$ $ $
I updated research on the best months to buy and sell.
$ $ $
The following table shows where Fibonacci retrace values of the day's high-low range are plus pivot points, calculated on the Nasdaq composite, sorted by value. When several are near each other (small differences), the area might act as support or resistance.
-- Thomas Bulkowski
![]()
| © 2023 ThePatternSite.com Metric | Value | Diff | Close (within 10% of the high-low range for the day)? |
| Monthly S2 | 12,641.51 | ||
| Weekly S2 | 13,217.43 | 575.92 | |
| Monthly S1 | 13,330.41 | 112.98 | |
| Weekly S1 | 13,618.37 | 287.96 | |
| Weekly Pivot | 13,726.53 | 108.16 | |
| Monthly Pivot | 13,850.66 | 124.13 | |
| Daily S2 | 13,871.49 | 20.83 | |
| Low | 13,924.20 | 52.71 | |
| Daily S1 | 13,945.40 | 21.20 | |
| Open | 13,961.77 | 16.37 | |
| 61.8% Down from Intraday High | 13,972.57 | 10.80 | Yes! The 61.8% Down from Intraday High is close to the Open. |
| 50% Down from Intraday High | 13,987.51 | 14.94 | |
| Daily Pivot | 13,998.11 | 10.60 | Yes! The Daily Pivot is close to the 50% Down from Intraday High. |
| 38.2% Down from Intraday High | 14,002.45 | 4.34 | Yes! The 38.2% Down from Intraday High is close to the Daily Pivot. |
| Close | 14,019.31 | 16.86 | |
| High | 14,050.82 | 31.51 | |
| Daily R1 | 14,072.02 | 21.20 | |
| Daily R2 | 14,124.73 | 52.71 | |
| Weekly R1 | 14,127.47 | 2.74 | Yes! The Weekly R1 is close to the Daily R2. |
| Weekly R2 | 14,235.63 | 108.16 | |
| Monthly R1 | 14,539.56 | 303.93 | |
| Monthly R2 | 15,059.81 | 520.25 |
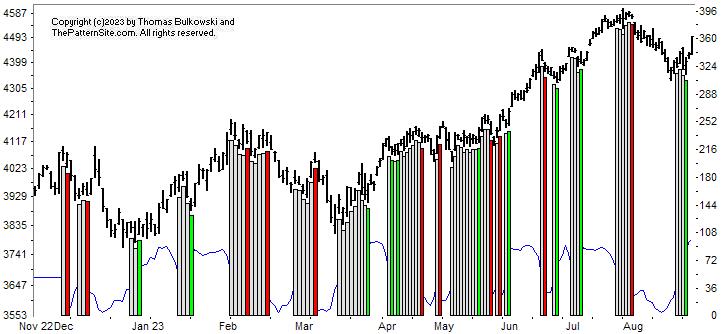
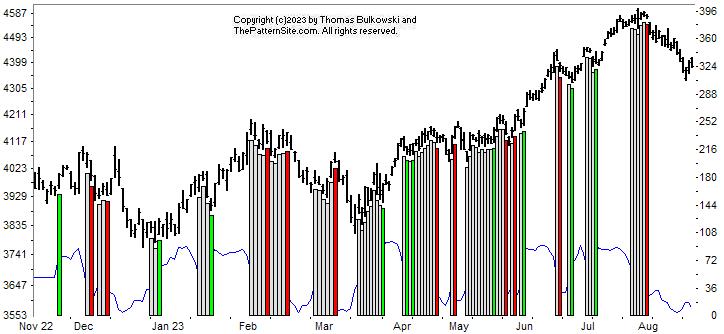
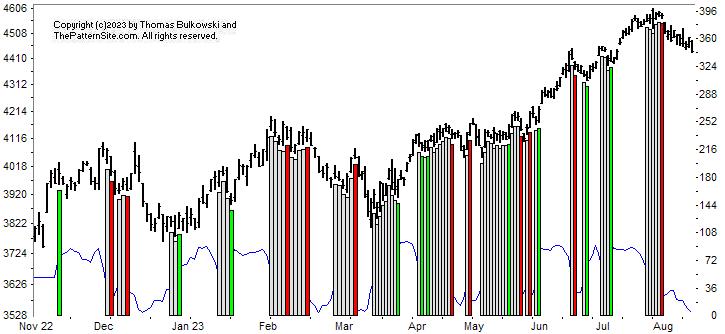
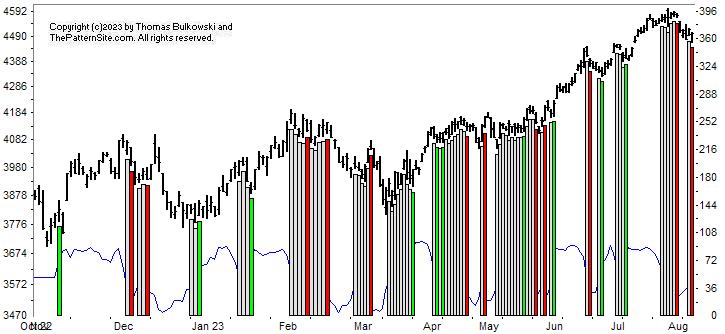
This is a picture of the chart pattern indicator on the daily scale. The indicator is the line chart below a chart of the S&P 500 composite.
The CPI turned from neutral to bullish with the presence of the vertical green bar on the far right of the chart. The index has begun the long-awaited recovery from the recent retrace.
Near the bottom of the chart, you can see the thin blue line poking out. It's at or near the top of the scale (100), so that's bullish.
In fact, the chart is bullish. What's the next chart say?
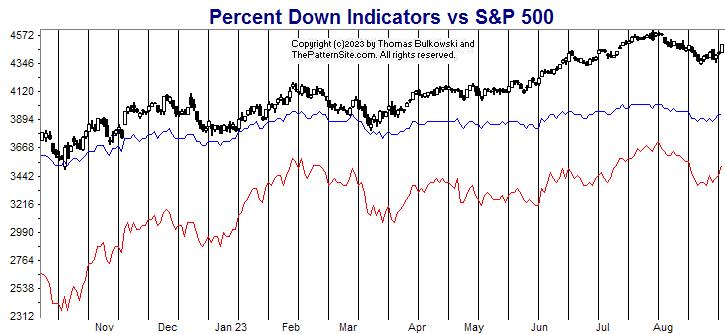
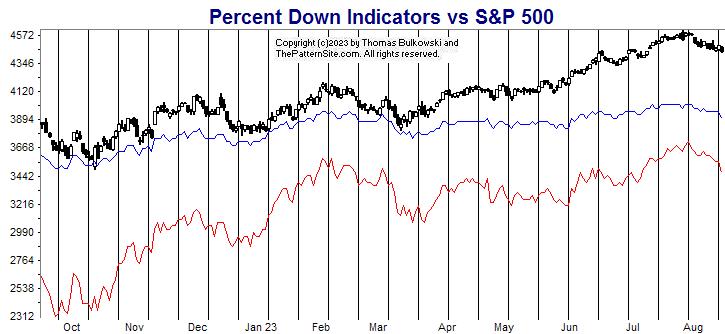
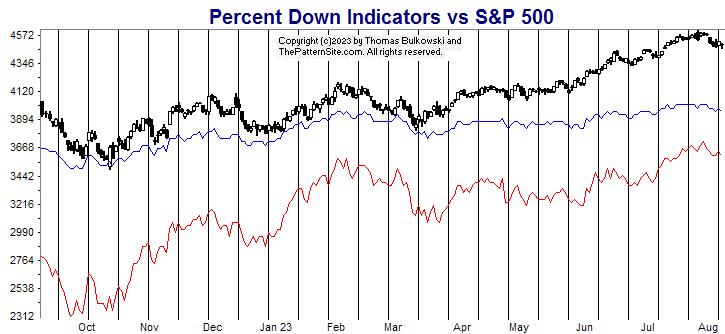
The red line is the percentage of stocks at least 20% below their 1-year high (plotted upside down). The blue line is the average percentage drop of stocks below their 1-year high (plotted upside down).
On Tuesday, 33% of stocks in my database are in bear market territory (down at least 20% from their 1-year high).A week ago, it was 39%.The fewest was 26% on 07/31/2023.And the most was 78% on 09/26/2022.
The 522 stocks in my database are down an average of 17% from their yearly high.A week ago, the average was 19%.The peak was 14% on 07/31/2023.And the bottom was 34% on 09/30/2022.
Both the red and blue lines are up this week from a week ago. That's an improvement. I'd say these lines are bullish, too, just like the prior chart.
With both charts bullish, I expect that the uptrend will continue.
$ $ $
Here's a symbol list of 108 chart and candlestick patterns (13 "investment grade" candle patterns) found in today's securities using my version of Patternz: ABM, ACN, ACIW, ATVI, AME, APA, ADSK, AVY, AVNT, BMRN, BLDR, CBT, CDNS, CAL, CX, CDAY, CHD, CR, CRH, FANG, DSGR, BOOM, EXP, EMR, EFX, EQT, EVH, EZPW, FARO, FIVN, FORM, FWRD, GPS, GIS, GL, GMS, HSII, IPAR, IBKR, TILE, INTU, IRM, LHX, LH, LMT, MTSI, MGY, MTDR, META, MU, MCO, NBR, NFLX, NEE, NWPX, ON, OTEX, OUT, PCTY, PYPL, PEN, PRFT, PXD, QCOM, RRC, RGLD, SAND, SCHW, SAIC, SMG, SHOP, SPSC, TJX, TREX, UGI, UNM, VEEV, WRB, WU, WEX, WPM, WDAY, IAI, IYE, FXI, IYZ, IGV, IXC, SLV, EWO, EWK, EWZ, EWH, EWI, EPP, EZA, THD, QLD, PJP, USO. Click this link for details (pattern type, start and end dates).
For a list of small patterns (those a few days wide) click this link.
-- Thomas Bulkowski
![]()
$ $ $
I show another slider trading quiz featuring Broadening bottoms.
$ $ $
Here's a symbol list of 83 chart and candlestick patterns (13 "investment grade" candle patterns) found in today's securities using my version of Patternz: ABT, AFL, ALRM, AFG, ACGL, AWI, AVY, BMI, BSET, BECN, BZH, BSX, BRKR, CX, CNC, CHS, CIEN, CLNE, CONN, GLW, CSGS, CW, DHR, FANG, DDS, DUK, BOOM, EMN, EIX, EME, EZPW, FICO, FIVN, FDP, FRD, GS, HSII, HNI, INFN, IIIN, NVTA, LEG, LPLA, MCHX, MKTX, MDT, MRK, MU, MOS, MLI, MUR, MYGN, NTGR, NWPX, NVDA, PXD, PGR, RGS, RHI, ROK, SLB, SKYW, TPX, TJX, TDG, TWLO, UNM, VECO, WRB, ITA, IYE, FXL, IYZ, IXC, EEM, EWY, TUR, PEJ, PJP, USO. Click this link for details (pattern type, start and end dates).
For a list of small patterns (those a few days wide) click this link.
$ $ $
The following table shows where Fibonacci retrace values of the day's high-low range are plus pivot points, calculated on the Dow industrials, sorted by value. When several are near each other (small differences), the area might act as support or resistance.
-- Thomas Bulkowski
![]()
| © 2023 ThePatternSite.com Metric | Value | Diff | Close (within 10% of the high-low range for the day)? |
| Monthly S2 | 33,106.20 | ||
| Weekly S2 | 33,762.50 | 656.30 | |
| Monthly S1 | 33,833.09 | 70.59 | |
| Weekly S1 | 34,161.24 | 328.15 | |
| Daily S2 | 34,340.24 | 179.00 | |
| Weekly Pivot | 34,427.96 | 87.72 | |
| Low | 34,441.64 | 13.68 | Yes! The Low is close to the Weekly Pivot. |
| Open | 34,441.64 | 0.00 | Yes! The Open is close to the Low. |
| Daily S1 | 34,450.11 | 8.47 | Yes! The Daily S1 is close to the Open. |
| 61.8% Down from Intraday High | 34,522.34 | 72.23 | |
| 50% Down from Intraday High | 34,547.27 | 24.93 | |
| Daily Pivot | 34,551.51 | 4.24 | Yes! The Daily Pivot is close to the 50% Down from Intraday High. |
| Close | 34,559.98 | 8.47 | Yes! The Close is close to the Daily Pivot. |
| 38.2% Down from Intraday High | 34,572.20 | 12.22 | Yes! The 38.2% Down from Intraday High is close to the Close. |
| High | 34,652.91 | 80.71 | |
| Daily R1 | 34,661.38 | 8.47 | Yes! The Daily R1 is close to the High. |
| Monthly Pivot | 34,756.11 | 94.73 | |
| Daily R2 | 34,762.78 | 6.67 | Yes! The Daily R2 is close to the Monthly Pivot. |
| Weekly R1 | 34,826.70 | 63.92 | |
| Weekly R2 | 35,093.42 | 266.72 | |
| Monthly R1 | 35,483.00 | 389.58 | |
| Monthly R2 | 36,406.02 | 923.02 |
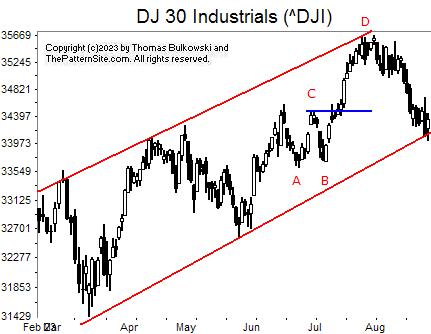
This is on the daily scale.
I drew two parallel red lines showing an up-sloping channel. The index is at the bottom of the channel so we can expect a rebound. I say that because the retrace from the prior upward rise, B to D, is due to happen.
However, the index could just as easily pierce the bottom channel line and continue lower. It's already poked it's tail through.
Chart pattern ABC is a confirmed double bottom. By confirmed, I mean the index has closed above C. Notice that the resulting climb to D exceeded the AC height added to C. That's the measure rule and it's a guide and not really a rule.
It allows us to assess the probabilities of the index climbing to the target (marginally below D in this case).
![]()
The following is a brief review of how the markets performed over time. The numbers refer to the close-to-close move in the Dow industrials.
No options expire this week.
![]()
The following is based on an SFO article in December 2004 by John Seekinger, titled, "Take a two-dimensional approach." He offers these tips.
| Index | S2 | S1 | Pivot | R1 | R2 |
| Dow Industrials (^DJI): Daily | 33,860 | 34,103 | 34,273 | 34,516 | 34,685 |
| Weekly | 33,691 | 34,019 | 34,357 | 34,685 | 35,022 |
| Monthly | 33,035 | 33,691 | 34,685 | 35,341 | 36,335 |
| S&P500 (^GSPC): Daily | 4,331 | 4,369 | 4,393 | 4,431 | 4,456 |
| Weekly | 4,305 | 4,355 | 4,407 | 4,457 | 4,509 |
| Monthly | 4,178 | 4,292 | 4,449 | 4,563 | 4,721 |
| Nasdaq (^IXIC): Daily | 13,276 | 13,434 | 13,533 | 13,691 | 13,791 |
| Weekly | 13,075 | 13,333 | 13,584 | 13,842 | 14,093 |
| Monthly | 12,499 | 13,045 | 13,708 | 14,254 | 14,917 |
Here are the formulas:
![]()
Earnings season is either underway or should be starting soon. The sessions could be more volatile.
Here's a symbol list of 101 chart and candlestick patterns (13 "investment grade" candle patterns) found in today's securities using my version of Patternz: ATVI, AYI, ALRM, AA, ALL, AXP, ANIK, AON, ACGL, ADP, AZTA, BZH, CAL, CNC, CNP, CI, GLW, CCK, CSGS, FANG, DDS, D, DRQ, DTE, BOOM, FARO, FMC, FCX, FRD, GFS, HE, HSIC, HUM, IDA, ITGR, INTU, KBH, KSS, LEG, LDOS, LNC, MKTX, MAS, MDC, META, MYGN, NFG, NCR, NTAP, NJR, NEU, NXGN, NTNX, NVDA, OLN, PNW, PXD, DGX, RHI, SEE, SCI, SHW, LUV, TKR, TWLO, UHAL, UNM, VECO, WRB, WERN, WPM, ITA, IYC, IYE, ITB, DDM, IAT, IEV, IXC, SLV, EWA, EWO, EWK, EWQ, EWG, EPP, EWL, TUR, XHB, XLI, XLB, XRT, UNG, USO. Click this link for details (pattern type, start and end dates).
For a list of small patterns (those a few days wide) click this link.
The below industries were the best (rank 1) or worst performing of those I follow.
|
-- Thomas Bulkowski
![]()
$ $ $
Here's a symbol list of 180 chart and candlestick patterns (13 "investment grade" candle patterns) found in today's securities using my version of Patternz: DDD, AYI, ADBE, AEIS, AMD, AKAM, ALRM, AMZN, AXP, AME, ANIK, AR, AMAT, ACGL, ANET, ARW, ADP, AZTA, BSET, BZH, BOOT, CAL, CDAY, CF, CRL, CHKP, CIEN, CTAS, CSCO, CGNX, CMTL, CRH, CCRN, DECK, XRAY, FANG, DDS, BOOM, EIX, EPAM, EZPW, FFIV, FICO, FAST, FTNT, FCX, GNW, GFS, GOOGL, HLIT, HSY, HOLX, JBHT, IEX, IDXX, ITGR, ISRG, NVTA, KALU, KEYS, KFRC, KMB, KLAC, KSS, KLIC, LRCX, RAMP, LXU, MHO, MANH, MCHX, MKTX, MA, MDC, META, MSFT, MYGN, ^IXIC, NXGN, NTNX, NVDA, OXY, OMCL, ASGN, ON, OTEX, ORCL, OUT, OXM, PANW, PKE, PCTY, PEN, PXD, PINC, PSTG, QCOM, RMBS, RRC, RGA, ROL, ^GSPC, SAIA, CRM, SEIC, SMTC, NOW, SLGN, SMAR, LUV, SPLK, SXI, SNPS, TDOC, TDC, TER, TXN, TTD, TJX, TWLO, VMI, VECO, VRSN, WRB, WOLF, WDAY, ZBRA, IYE, DDM, FTEC, FDN, QTEC, FXL, BOTZ, QQQ, IGV, IXC, IXN, SOXX, EWO, EWT, THD, TUR, QLD, PBE, PJP, PHO, SSO, ROBO, XLY, XRT, SPY, XAR, XLK, UNG, USO, SMH, MGK, VONG. Click this link for details (pattern type, start and end dates).
For a list of small patterns (those a few days wide) click this link.
$ $ $
You can find setups based on a Fibonacci retrace by clicking on the link.
The following patterns were found manually, not using Patternz. Mr. Bulkowski has excluded any securities he owns from appearing in the list. However, he may add any of the securities listed to his portfolio at any time, just as you can.
In the table below, the red and green colors are based on the historical breakout direction for the associated chart pattern. If a high and tight flag appears, the start and end dates highlight the flagpole only and not the flag.
For details about the chart patterns, click here.
-- Thomas Bulkowski
![]()
| Symbol | Chart Pattern | Bullish Bearish | Start | End | Industry |
| A | Double Top, Eve and Eve | 07/27/2023 | 08/10/2023 | Precision Instrument | |
| AGO | Pipe top | 07/31/2023 | 08/07/2023 | Insurance (Life) | |
| AVNT | Flag | 08/16/2023 | 08/24/2023 | Chemical (Specialty) | |
| BMI | Broadening top | 08/01/2023 | 08/18/2023 | Precision Instrument | |
| CAL | Double Top, Eve and Adam | 08/07/2023 | 08/16/2023 | Shoe | |
| CE | Double Top, Adam and Eve | 07/27/2023 | 08/10/2023 | Chemical (Basic) | |
| EZPW | Double Top, Adam and Adam | 07/24/2023 | 08/03/2023 | Financial Services | |
| HQY | Triangle, descending | 07/05/2023 | 07/27/2023 | Healthcare Information | |
| HUN | Head-and-shoulders top | 07/13/2023 | 08/10/2023 | Chemical (Specialty) | |
| JNJ | Double Top, Adam and Eve | 07/28/2023 | 08/10/2023 | Medical Supplies | |
| LZB | Pipe top | 07/31/2023 | 08/07/2023 | Furn/Home Furnishings | |
| LH | Triangle, symmetrical | 07/25/2023 | 08/24/2023 | Medical Services | |
| MA | Double Bottom, Eve and Adam | 08/03/2023 | 08/18/2023 | Financial Services | |
| MRK | Double Bottom, Adam and Eve | 07/17/2023 | 08/04/2023 | Drug | |
| MRCY | Pipe bottom | 08/07/2023 | 08/14/2023 | Computers and Peripherals | |
| NVDA | Pipe bottom | 08/07/2023 | 08/14/2023 | Semiconductor | |
| OGE | Double Bottom, Adam and Adam | 08/15/2023 | 08/21/2023 | Electric Utility (Central) | |
| TECH | Pipe top | 07/17/2023 | 07/24/2023 | Biotechnology | |
| TPX | Double Top, Eve and Eve | 07/27/2023 | 08/03/2023 | Furn/Home Furnishings | |
| TOL | Broadening top | 07/21/2023 | 08/21/2023 | Homebuilding | |
| WOLF | Horn top | 07/03/2023 | 07/17/2023 | Semiconductor |
![]()
Since I post this the night before, check how the futures are trading before market open. Large moves can affect the opening direction.
$ $ $
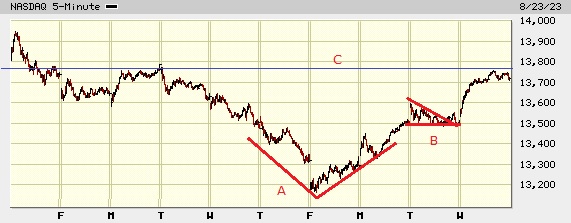
I show a picture of the Nasdaq composite on the 5-minute scale.
At A, a V-bottom chart pattern appears. It's nicely shaped and quite wide. What else is there to say about it?
At B, a descending triangle appears. It has a nice shape, too, and the breakout is upward in this case. The resulting rise is steep and about what one would expect from a chart pattern (meaning it met the measure rule target of the pattern's height added to the top of the pattern).
At C, I drew a thin blue line to check what overhead resistance looked like. There's not much to see because the data doesn't go back far enough. From what I can see, though, it looks to stop price from rising for another day, but rarely do things on the intraday scale work as expected.
$ $ $
Here's a symbol list of 126 chart and candlestick patterns (13 "investment grade" candle patterns) found in today's securities using my version of Patternz: AYI, ANIK, AR, AAPL, ARCB, AGO, ATO, AXS, BMY, CAL, CX, CNC, CF, CIEN, CLNE, ED, CAG, CRH, DECK, FANG, DDS, BOOM, EMN, EVRG, FIS, FLEX, FNV, GMS, HLIT, HE, HOLX, HUN, PODD, INTC, KALU, LZB, LRCX, LANC, L, LXU, MKTX, MRTN, MTDR, MRK, MRCY, MOS, MYGN, NFG, NFLX, NJR, NXGN, NKE, NOVT, NTNX, NVDA, OMCL, OR, PCG, PXD, PINC, PSTG, RMBS, RRC, RGS, RCKY, ROL, RGLD, RES, SAND, SEIC, SMTC, SCI, STR, SWN, SXI, TGT, TDY, TER, TXN, TTD, TMO, TWLO, UHAL, VMI, VECO, VC, WRB, WPM, WSM, IAI, IYC, IYE, QTEC, ICF, IAT, IXC, ILF, SLV, EWO, EWZ, EWH, EWJ, EWM, EPP, EWS, EWD, EWL, EWT, IBB, XLY, XRT, UNG, USO. Click this link for details (pattern type, start and end dates).
For a list of small patterns (those a few days wide) click this link.
$ $ $
The following table shows where Fibonacci retrace values of the day's high-low range are plus pivot points, calculated on the Nasdaq composite, sorted by value. When several are near each other (small differences), the area might act as support or resistance.
-- Thomas Bulkowski
![]()
| © 2023 ThePatternSite.com Metric | Value | Diff | Close (within 10% of the high-low range for the day)? |
| Monthly S2 | 12,491.66 | ||
| Weekly S2 | 12,929.92 | 438.26 | |
| Monthly S1 | 13,106.34 | 176.43 | |
| Weekly S1 | 13,325.47 | 219.13 | |
| Daily S2 | 13,445.58 | 120.11 | |
| Low | 13,532.43 | 86.85 | |
| Open | 13,532.43 | 0.00 | Yes! The Open is close to the Low. |
| Weekly Pivot | 13,557.32 | 24.89 | |
| Daily S1 | 13,583.31 | 25.99 | |
| 61.8% Down from Intraday High | 13,618.22 | 34.91 | |
| 50% Down from Intraday High | 13,644.71 | 26.50 | |
| Daily Pivot | 13,670.15 | 25.44 | |
| 38.2% Down from Intraday High | 13,671.21 | 1.06 | Yes! The 38.2% Down from Intraday High is close to the Daily Pivot. |
| Close | 13,721.03 | 49.82 | |
| High | 13,757.00 | 35.97 | |
| Monthly Pivot | 13,776.45 | 19.45 | Yes! The Monthly Pivot is close to the High. |
| Daily R1 | 13,807.88 | 31.43 | |
| Daily R2 | 13,894.72 | 86.85 | |
| Weekly R1 | 13,952.87 | 58.15 | |
| Weekly R2 | 14,184.72 | 231.84 | |
| Monthly R1 | 14,391.13 | 206.42 | |
| Monthly R2 | 15,061.24 | 670.10 |
This is a picture of the chart pattern indicator on the daily scale. The indicator is the line chart below a chart of the S&P 500 composite.
The CPI, as the chart shows, is still bearish. The red vertical bar on the far right of the chart illustrates this.
Look at the indicator line. It's hovering near the low, isn't it? It's unusual for the indicator to stay near 0 for long, so expect this retrace we've been having to end soon.

The red line is the percentage of stocks at least 20% below their 1-year high (plotted upside down). The blue line is the average percentage drop of stocks below their 1-year high (plotted upside down).
On Tuesday, 39% of stocks in my database are in bear market territory (down at least 20% from their 1-year high).A week ago, it was 35%.The fewest was 26% on 07/31/2023.And the most was 78% on 09/26/2022.
The 522 stocks in my database are down an average of 19% from their yearly high.A week ago, the average was 18%.The peak was 14% on 07/31/2023.And the bottom was 34% on 09/30/2022.
Both lines are worse this week when compared to last week. By worse, I mean more bearish. However, they both follow the indices in lock-step, suggesting these two lines are worthless as indicators.
Both charts are bearish this week. The prior chart shows a minor retrace of two day's length losing steam but the bigger retrace from the July peak is near its end, I think.
The red line on this chart may find support from prior peaks or valleys but I don't know if the indicator cares about that or not. I expect not.
I'm looking for the retrace to end soon, perhaps sometime this week...
$ $ $
Here's a symbol list of 127 chart and candlestick patterns (13 "investment grade" candle patterns) found in today's securities using my version of Patternz: AYI, AMD, ATSG, ALK, AXP, AIG, AR, ATR, ARCB, AGO, AVY, AXS, BBY, BMRN, BG, CAL, CMCO, FANG, DDS, DRQ, BOOM, EMR, EPAM, FFIV, FORM, GME, GIS, GPRO, GES, HLIT, HIG, HL, HON, JBHT, ITGR, IBKR, NVTA, IRM, JNJ, KEYS, KMB, LZB, L, M, MCHX, MKTX, MTDR, MTRN, MRK, MU, MYGN, NBR, NFG, NXGN, NKE, JWN, NVDA, OLN, OMCL, PANW, PKE, PAYX, PXD, PRU, KWR, QCOM, RCKY, ROG, ROL, SRE, SMTC, LUV, SWN, SXI, SRDX, TGT, TDOC, TEVA, TMO, TKR, TSCO, TWLO, UPS, VFC, VECO, WRB, WERN, WU, WMB, WOLF, IAI, IYE, BOTZ, IAT, IEV, IXC, SLV, IYF, EWA, EWK, EWQ, EWG, EWH, EPP, EWS, EWY, EWP, EWL, THD, EWU, DBA, ROBO, XRT, UNG, USO. Click this link for details (pattern type, start and end dates).
For a list of small patterns (those a few days wide) click this link.
-- Thomas Bulkowski
![]()
$ $ $
I show another slider trading quiz featuring Universal American Financial: UHCO stock.
$ $ $
Here's a symbol list of 136 chart and candlestick patterns (13 "investment grade" candle patterns) found in today's securities using my version of Patternz: ATSG, AIG, AMWD, AMGN, AMAT, ARCB, AGO, AVNT, AZTA, BCPC, BZH, BKH, BKNG, BRC, BG, CNP, CENX, CHKP, CNO, COTY, CROX, CCRN, DVN, FANG, DSGR, DRQ, BOOM, EIX, ELV, EQT, FIS, FISV, FWRD, FCX, IT, GIS, GNW, GS, HBI, HIG, HAYN, HQY, HTLD, HL, HNI, HURC, IIIN, INTC, IBKR, TILE, KBH, KLAC, KSS, KLIC, LZB, LRCX, LAMR, LEG, LEN, L, LPLA, MRO, MAS, MLKN, MOS, MYGN, NKE, OMCL, ASGN, ORCL, OR, OMI, OXM, PKG, PYPL, PXD, PINC, PFG, PRU, PHM, PSTG, QTWO, REGN, RGA, RLI, RHI, RGLD, SEE, SMTC, STR, LUV, SWX, SWN, SPSC, SCS, SUM, TPX, TDC, TOL, TSCO, TZOO, UIS, UNM, MDRX, VRTX, WRB, WMB, WSC, IAI, IYE, DDM, IAT, IXC, SLV, IYF, EWH, TUR, IBB, DBA, PBE, USO. Click this link for details (pattern type, start and end dates).
For a list of small patterns (those a few days wide) click this link.
$ $ $
The following table shows where Fibonacci retrace values of the day's high-low range are plus pivot points, calculated on the Dow industrials, sorted by value. When several are near each other (small differences), the area might act as support or resistance.
-- Thomas Bulkowski
![]()
| © 2023 ThePatternSite.com Metric | Value | Diff | Close (within 10% of the high-low range for the day)? |
| Monthly S2 | 33,386.06 | ||
| Weekly S2 | 33,615.18 | 229.12 | |
| Monthly S1 | 33,924.88 | 309.69 | |
| Weekly S1 | 34,039.44 | 114.56 | |
| Daily S2 | 34,105.20 | 65.77 | |
| Low | 34,248.46 | 143.26 | |
| Daily S1 | 34,284.45 | 35.98 | |
| 61.8% Down from Intraday High | 34,371.66 | 87.21 | |
| 50% Down from Intraday High | 34,409.71 | 38.05 | |
| Daily Pivot | 34,427.70 | 17.99 | Yes! The Daily Pivot is close to the 50% Down from Intraday High. |
| 38.2% Down from Intraday High | 34,447.77 | 20.06 | Yes! The 38.2% Down from Intraday High is close to the Daily Pivot. |
| Close | 34,463.69 | 15.93 | Yes! The Close is close to the 38.2% Down from Intraday High. |
| Open | 34,531.28 | 67.59 | |
| High | 34,570.96 | 39.68 | |
| Daily R1 | 34,606.95 | 35.98 | |
| Weekly Pivot | 34,687.44 | 80.50 | |
| Daily R2 | 34,750.20 | 62.76 | |
| Monthly Pivot | 34,802.00 | 51.80 | |
| Weekly R1 | 35,111.70 | 309.69 | |
| Monthly R1 | 35,340.82 | 229.12 | |
| Weekly R2 | 35,759.70 | 418.89 | |
| Monthly R2 | 36,217.94 | 458.24 |
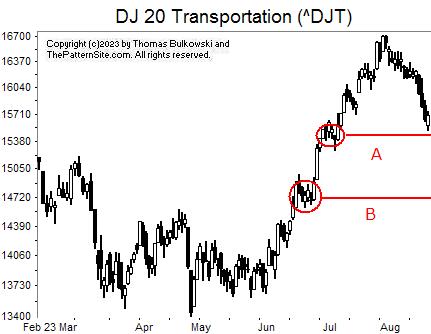
I show the Dow transports on the daily scale.
I circled knots that may act as support when (or if) the index reaches them.
The first one is at A. We're almost there. Maybe Monday will see the end of the retrace. That's my guess, anyway.
If that one doesn't hold, then I expect B to be the next possible turning point.
If this chart was of an individual stock, I'd be more confident in the turn prediction. However, the index is an average of stocks so it's harder to predict the turns.
![]()
The following is a brief review of how the markets performed over time. The numbers refer to the close-to-close move in the Dow industrials.
No options expire this week.
![]()
The following is based on an SFO article in December 2004 by John Seekinger, titled, "Take a two-dimensional approach." He offers these tips.
| Index | S2 | S1 | Pivot | R1 | R2 |
| Dow Industrials (^DJI): Daily | 34,126 | 34,314 | 34,450 | 34,637 | 34,774 |
| Weekly | 33,628 | 34,064 | 34,700 | 35,136 | 35,772 |
| Monthly | 33,398 | 33,950 | 34,814 | 35,365 | 36,230 |
| S&P500 (^GSPC): Daily | 4,316 | 4,343 | 4,362 | 4,389 | 4,409 |
| Weekly | 4,243 | 4,307 | 4,398 | 4,462 | 4,553 |
| Monthly | 4,166 | 4,268 | 4,437 | 4,539 | 4,709 |
| Nasdaq (^IXIC): Daily | 13,089 | 13,190 | 13,263 | 13,364 | 13,437 |
| Weekly | 12,787 | 13,039 | 13,414 | 13,666 | 14,041 |
| Monthly | 12,348 | 12,820 | 13,633 | 14,104 | 14,918 |
Here are the formulas:
![]()
Earnings season is either underway or should be starting soon. The sessions could be more volatile.
Here's a symbol list of 168 chart and candlestick patterns (13 "investment grade" candle patterns) found in today's securities using my version of Patternz: MMM, ABT, ANF, AXDX, ADBE, ALB, ALKS, AXP, AIG, AON, ATR, AGO, ATO, AXS, BZH, BKNG, BRC, BCO, CALM, CHS, COP, CRH, CCRN, DVN, FANG, DSGR, DOV, DRQ, BOOM, EXP, ECL, EIX, WIRE, EQT, EVRG, FIS, FLEX, FORM, FTV, FNV, FCX, GE, GILD, GFS, GOOGL, GFF, HIG, HSII, ITGR, TILE, JAZZ, KEYS, LZB, LAMR, LLY, LNC, MGY, MRO, MCHX, MA, MCO, NCR, NFLX, NTAP, NEWR, ORI, OMCL, ASGN, OR, OMI, PKG, PXD, PLXS, PPG, PRU, PEG, RJF, RGA, RNG, RHI, ROST, RGLD, SEE, SEIC, SMTC, LUV, SWX, SRDX, TRGP, TDY, TDC, TEVA, SLCA, UIS, UNM, VMC, WRB, WSO, WERN, WU, WSM, WOLF, ZBRA, IAI, IYC, IYE, IHE, DDM, FTEC, FXL, FXI, IAT, IEV, IXC, MXI, IXN, IYF, EWO, EWK, EWC, EEM, EWQ, EWH, EIS, EWW, EWS, EZA, EWP, EWD, EWL, EWU, QLD, PBE, SSO, XLI, XLB, XRT, UNG, USO, VONG. Click this link for details (pattern type, start and end dates).
For a list of small patterns (those a few days wide) click this link.
The below industries were the best (rank 1) or worst performing of those I follow.
|
-- Thomas Bulkowski
![]()
$ $ $
Here's a symbol list of 166 chart and candlestick patterns (13 "investment grade" candle patterns) found in today's securities using my version of Patternz: A, APD, ALKS, AMED, AXP, AFG, AIG, AMN, ACGL, AGO, AXS, BALL, BZH, BERY, BBY, BIG, BKNG, BAH, BRC, BR, BRKR, CLS, CX, CNC, CRL, CI, CINF, CNA, CRH, CCK, DECK, DVN, FANG, DFS, DSGR, ^DJU, BOOM, EXP, ECL, EIX, EFX, EG, EVRG, EVH, XOM, FFIV, FLEX, FORM, FNV, GD, GL, GPRO, THG, HIG, HE, HSIC, HD, HWM, PODD, ITGR, INTC, KBH, LHX, LZB, RAMP, L, MRO, MCHX, MA, MRCY, MU, MLKN, MS, NFLX, NTGR, NEWR, NEU, NKE, OMCL, ASGN, OTEX, OR, OUT, OMI, PANW, PYPL, PCG, PXD, PRU, QTWO, KWR, RGLD, CRM, SHOP, SMAR, SWX, SWN, TECH, TRV, UHAL, UNM, VMI, VECO, WRB, WAT, WEX, WPM, WOLF, XEL, IAI, IYK, IYC, IYE, IDU, DDM, FTEC, FXL, BOTZ, IHF, IAT, IEV, IXC, IXN, IYF, EWK, ECH, EWH, EIS, EWJ, EWM, EWW, EPP, EWS, EWL, THD, EWU, SSO, ROBO, XLF, XLI, XLB, XRT, XAR, XLU, USO, VHT, VONG. Click this link for details (pattern type, start and end dates).
For a list of small patterns (those a few days wide) click this link.
$ $ $
You can find setups based on a Fibonacci retrace by clicking on the link.
The following patterns were found manually, not using Patternz. Mr. Bulkowski has excluded any securities he owns from appearing in the list. However, he may add any of the securities listed to his portfolio at any time, just as you can.
In the table below, the red and green colors are based on the historical breakout direction for the associated chart pattern. If a high and tight flag appears, the start and end dates highlight the flagpole only and not the flag.
For details about the chart patterns, click here.
-- Thomas Bulkowski
![]()
| Symbol | Chart Pattern | Bullish Bearish | Start | End | Industry |
| ACN | Double Top, Adam and Adam | 07/19/2023 | 07/27/2023 | IT Services | |
| ALKS | Double Bottom, Eve and Eve | 08/03/2023 | 08/10/2023 | Drug | |
| ADM | Double Top, Eve and Eve | 07/26/2023 | 08/07/2023 | Food Processing | |
| AWI | Double Top, Eve and Adam | 07/26/2023 | 08/07/2023 | Building Materials | |
| BA | Double Top, Adam and Eve | 08/01/2023 | 08/10/2023 | Aerospace/Defense | |
| CI | Diamond top | 07/19/2023 | 08/16/2023 | Medical Services | |
| COST | Double Top, Eve and Eve | 07/27/2023 | 08/10/2023 | Retail Store | |
| CCK | Pipe top | 07/24/2023 | 07/31/2023 | Packaging and Container | |
| DRQ | Triangle, symmetrical | 08/01/2023 | 08/17/2023 | Oilfield Svcs/Equipment | |
| EOG | Diamond top | 07/27/2023 | 08/17/2023 | Natural Gas (Distributor) | |
| EXPI | Double Top, Adam and Eve | 07/13/2023 | 08/01/2023 | E-Commerce | |
| EZPW | Double Top, Eve and Adam | 07/24/2023 | 08/03/2023 | Financial Services | |
| FDX | Triangle, symmetrical | 07/31/2023 | 08/17/2023 | Air Transport | |
| FORM | Double Top, Eve and Adam | 07/13/2023 | 07/31/2023 | Semiconductor | |
| HE | Dead-cat bounce | 08/14/2023 | 08/14/2023 | Electric Utility (West) | |
| ILMN | Triple top | 07/13/2023 | 08/10/2023 | Biotechnology | |
| JKHY | Double Top, Eve and Adam | 07/25/2023 | 08/10/2023 | IT Services | |
| RAMP | Triple bottom | 07/07/2023 | 08/09/2023 | Computer Software and Svcs | |
| M | Double Top, Adam and Adam | 07/12/2023 | 07/27/2023 | Retail Store | |
| MLM | Multi-peaks | 06/30/2023 | 08/15/2023 | Cement and Aggregates | |
| NTNX | Triangle, ascending | 06/02/2023 | 08/15/2023 | E-Commerce | |
| PANW | Double Top, Eve and Adam | 07/05/2023 | 08/01/2023 | Computer Software and Svcs | |
| PKE | Triple top | 07/18/2023 | 08/04/2023 | Chemical (Specialty) | |
| PGR | Ugly double bottom | 07/14/2023 | 08/15/2023 | Insurance (Prop/Casualty) | |
| KWR | Double Top, Eve and Adam | 07/11/2023 | 08/01/2023 | Chemical (Specialty) | |
| RL | Double Top, Adam and Adam | 07/12/2023 | 08/04/2023 | Apparel | |
| SKX | Head-and-shoulders top | 07/20/2023 | 08/10/2023 | Shoe | |
| TKR | Triple top | 07/12/2023 | 08/01/2023 | Metal Fabricating | |
| TREX | Double Top, Adam and Eve | 08/02/2023 | 08/10/2023 | Building Materials | |
| SLCA | Horn top | 07/10/2023 | 07/24/2023 | Metals and Mining (Div.) | |
| WEX | Double Top, Eve and Adam | 07/27/2023 | 08/10/2023 | Information Services | |
| WPM | Double Top, Adam and Adam | 07/26/2023 | 08/11/2023 | Metals and Mining (Div.) | |
| WOLF | Dead-cat bounce | 08/17/2023 | 08/17/2023 | Semiconductor | |
| SOXX | Double Top, Eve and Eve | 07/18/2023 | 08/01/2023 | Semiconductor |
![]()
Since I post this the night before, check how the futures are trading before market open. Large moves can affect the opening direction.
$ $ $
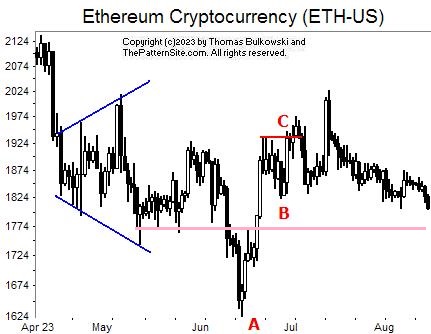
I show a picture of Ethereum (ETH-USD) on the daily scale scale.
The blue lines show a broadening bottom chart pattern. It broke out downward and the cryptocurrency dropped to A (after completing a nice partial rise).
AB is another chart pattern that I call an ugly double bottom. It's a double bottom except the second bottom is above the first so the two are not at equal prices (as they are in a traditional double bottom).
It confirms at C when the coin closes above the top of the pattern.
More recently, the currency has slid lower. I don't see anything that would change the trajectory. However, there's support located just below the bottom of letter B in mid May to early June, setup by valleys near the same price (pink line).
$ $ $
Here's a symbol list of 177 chart and candlestick patterns (13 "investment grade" candle patterns) found in today's securities using my version of Patternz: A, ALK, AMED, AEE, AXP, AFG, AIG, AME, AMN, ACGL, AGO, ADSK, AVNT, AXS, BALL, BAX, BECN, BERY, BIG, BA, BAH, CAL, CPB, CE, CX, CENX, CRL, CLNE, CNO, XRAY, DVN, FANG, DFS, BOOM, EMN, EBAY, EVH, EXC, FIS, FLEX, FORM, FWRD, FDP, GS, HOV, HUN, IDXX, ITW, INFN, PODD, ITGR, KBH, KLIC, LZB, RAMP, LMT, LOW, MANH, MCHX, MKTX, MRCY, MU, MLKN, MS, MYGN, NFLX, NEWR, NEU, NEE, JWN, NOC, NWPX, OMCL, ASGN, OR, PKG, PAYX, PXD, PPG, PPL, PGR, PEG, PSTG, RRC, RGS, ROK, ROST, RGLD, SBH, SLB, SCHW, SMTC, SHOP, SLGN, SO, SWN, TPR, TGT, TXT, TMO, TJX, TSCO, TZOO, UNH, UNM, VLO, WRB, WAT, WEX, WPM, WMB, WDAY, ITA, IAI, IYK, IYC, IYE, ITB, IHE, DDM, FXI, ICF, IAT, IXC, IXN, SLV, IGE, IYF, EWA, EWK, EWC, ECH, EWH, EIS, EWJ, EWM, EPP, EWS, EWY, EWP, EWL, THD, EWU, PPA, PBE, PEJ, PHO, SSO, ROBO, XLI, XLB, UNG, USO, VIS, VONG. Click this link for details (pattern type, start and end dates).
For a list of small patterns (those a few days wide) click this link.
$ $ $
The following table shows where Fibonacci retrace values of the day's high-low range are plus pivot points, calculated on the Nasdaq composite, sorted by value. When several are near each other (small differences), the area might act as support or resistance.
-- Thomas Bulkowski
![]()
| © 2023 ThePatternSite.com Metric | Value | Diff | Close (within 10% of the high-low range for the day)? |
| Monthly S2 | 12,973.67 | ||
| Monthly S1 | 13,224.15 | 250.48 | |
| Weekly S2 | 13,306.75 | 82.60 | |
| Daily S2 | 13,359.37 | 52.62 | |
| Weekly S1 | 13,390.69 | 31.32 | |
| Daily S1 | 13,417.00 | 26.31 | |
| Low | 13,473.03 | 56.03 | |
| Close | 13,474.63 | 1.60 | Yes! The Close is close to the Low. |
| Daily Pivot | 13,530.66 | 56.03 | |
| 61.8% Down from Intraday High | 13,538.46 | 7.80 | Yes! The 61.8% Down from Intraday High is close to the Daily Pivot. |
| 50% Down from Intraday High | 13,558.67 | 20.21 | |
| 38.2% Down from Intraday High | 13,578.89 | 20.21 | |
| Daily R1 | 13,588.29 | 9.40 | Yes! The Daily R1 is close to the 38.2% Down from Intraday High. |
| Open | 13,593.17 | 4.88 | Yes! The Open is close to the Daily R1. |
| High | 13,644.32 | 51.15 | |
| Weekly Pivot | 13,693.92 | 49.60 | |
| Daily R2 | 13,701.95 | 8.03 | Yes! The Daily R2 is close to the Weekly Pivot. |
| Weekly R1 | 13,777.86 | 75.91 | |
| Monthly Pivot | 13,835.35 | 57.49 | |
| Weekly R2 | 14,081.09 | 245.74 | |
| Monthly R1 | 14,085.83 | 4.74 | Yes! The Monthly R1 is close to the Weekly R2. |
| Monthly R2 | 14,697.03 | 611.20 |
This is a picture of the chart pattern indicator on the daily scale. The indicator is the line chart below a chart of the S&P 500 composite.
The trend of the chart is downward starting from the vertical red bar on the far right of the chart. It's bearish, in other words.
What's worse is the indicator line shown here in blue near the bottom of the chart. It's trending down, too. If what Reuters said about today's (Tuesday's) move is true (worries about rising interest rates because of strong retail sales), this will be a short move lower. So I expect a quick rebound.
The red line is the percentage of stocks at least 20% below their 1-year high (plotted upside down). The blue line is the average percentage drop of stocks below their 1-year high (plotted upside down).
On Tuesday, 35% of stocks in my database are in bear market territory (down at least 20% from their 1-year high).A week ago, it was 30%.The fewest was 26% on 07/31/2023.And the most was 78% on 09/26/2022.
The 522 stocks in my database are down an average of 18% from their yearly high.A week ago, the average was 17%.The peak was 14% on 07/31/2023.And the bottom was 34% on 09/30/2022.
The more sensitive of the two lines, the red one, turned down at the start of August. It has been following the index lower. Both the red and blue lines are lower this week compared to a week ago, so that's bearish.
This chart is bearish and so is the prior one. We were overdue for a retrace and it's begun. My gut says it'll be short lived as I explained in the prior chart. So I'm expecting a nice rebound.
I guess when earnings begin to arrive, it'll give the markets more to stress about.
$ $ $
I added a minor enhancement to Patternz's Simulator Form (setup button). The simulator can stop after a percentage move, so you can practice buying-the-dip, bottom fishing, or looking for a trend change.
$ $ $
Here's a symbol list of 178 chart and candlestick patterns (13 "investment grade" candle patterns) found in today's securities using my version of Patternz: MMM, ABT, AES, ALK, ALGT, ALL, AMED, AEE, AEP, AIG, APOG, ANET, ASH, AGO, ADSK, AVNT, BALL, BAX, BERY, BKH, BA, BRC, BFH, CPB, CE, CHS, CINF, CLNE, CLX, CNA, CNO, CMCO, ED, CMI, XRAY, FANG, DFS, DTE, DUK, BOOM, EMN, EBAY, EL, EVRG, FARO, FLEX, FORM, FWRD, FRD, GNW, GL, GS, GPRO, THG, HIG, HE, HTLD, HP, HUN, INFN, IIIN, KBH, KLIC, LHX, LZB, LMT, MANH, MAN, MCHX, MA, MRCY, MS, NBR, NFG, NJR, NEWR, NEE, NKE, NI, JWN, NOC, NVDA, ASGN, OR, PKG, PXD, POR, PPL, PG, PEG, RGLD, SAIA, SBH, SCHW, SEIC, SO, LUV, SWN, TGT, TZOO, UNH, UNM, WRB, WMT, WERN, WMB, WDAY, ITA, IAI, IYK, IYC, IYE, IDU, DDM, ICF, IAT, IEV, IXC, MXI, ILF, IYF, EWA, EWO, EWZ, EWC, EWH, EIS, EWM, EWS, EZA, EWY, EWP, THD, EWU, PPA, DBA, PBE, PEJ, PXJ, SSO, XLF, XLI, XLB, XAR, XLU, USO, VIS. Click this link for details (pattern type, start and end dates).
For a list of small patterns (those a few days wide) click this link.
-- Thomas Bulkowski
![]()
$ $ $
I show another slider trading quiz featuring UNUM Provident: UNUM stock.
$ $ $
Here's a symbol list of 164 chart and candlestick patterns (13 "investment grade" candle patterns) found in today's securities using my version of Patternz: MMM, ABT, AFL, ALRM, ALK, ALB, ALGT, ALL, DOX, AEE, AXP, AIG, AON, ANET, ARW, AIZ, ATO, AVNT, BMI, BALL, BAX, BKH, CAL, CX, CENX, CF, CINF, CLX, CNA, CTSH, CL, CMCO, CAG, CONN, CCK, DHR, FANG, DUK, BOOM, EMN, EPAM, EVRG, FFIV, FORM, FWRD, FDP, GIS, GGG, GES, THG, HE, HTLD, HSII, HP, HSY, HUBG, HUN, IDA, IBP, IIIN, INTC, INTU, KBH, KELYA, KMT, KLIC, LHX, LZB, LH, LEG, LMT, MRCY, MGEE, NBR, NFLX, NJR, NEWR, NOC, NWPX, OR, PEN, PFE, PXD, PG, PHM, QTWO, REGN, RGS, ROST, SBH, SCHW, SMG, SIGI, SMTC, SHOP, TECH, TDOC, TZOO, UPS, VECO, VRSN, WRB, WMT, WMB, XEL, ZBRA, ITA, IAI, IYC, IYE, IHE, FXL, IHF, IAT, IXC, MXI, IXN, ILF, SLV, IYF, EWA, EWZ, ECH, EEM, EWH, EIS, EWJ, EWM, EPP, EWS, EZA, EWY, EWP, EWD, EWL, EWT, DBA, PXJ, XLP, XLB, USO. Click this link for details (pattern type, start and end dates).
For a list of small patterns (those a few days wide) click this link.
$ $ $
The following table shows where Fibonacci retrace values of the day's high-low range are plus pivot points, calculated on the Dow industrials, sorted by value. When several are near each other (small differences), the area might act as support or resistance.
-- Thomas Bulkowski
![]()
| © 2023 ThePatternSite.com Metric | Value | Diff | Close (within 10% of the high-low range for the day)? |
| Monthly S2 | 32,924.03 | ||
| Monthly S1 | 34,115.83 | 1,191.80 | |
| Weekly S2 | 34,726.70 | 610.88 | |
| Monthly Pivot | 34,897.48 | 170.78 | |
| Weekly S1 | 35,017.17 | 119.69 | |
| Daily S2 | 35,105.54 | 88.37 | |
| Low | 35,169.97 | 64.43 | |
| Daily S1 | 35,206.58 | 36.61 | |
| 61.8% Down from Intraday High | 35,233.18 | 26.60 | |
| 50% Down from Intraday High | 35,252.71 | 19.53 | |
| Daily Pivot | 35,271.02 | 18.30 | |
| 38.2% Down from Intraday High | 35,272.24 | 1.22 | Yes! The 38.2% Down from Intraday High is close to the Daily Pivot. |
| Open | 35,273.89 | 1.65 | Yes! The Open is close to the 38.2% Down from Intraday High. |
| Weekly Pivot | 35,297.88 | 23.98 | |
| Close | 35,307.63 | 9.75 | Yes! The Close is close to the Weekly Pivot. |
| High | 35,335.45 | 27.82 | |
| Daily R1 | 35,372.06 | 36.61 | |
| Daily R2 | 35,436.50 | 64.43 | |
| Weekly R1 | 35,588.34 | 151.84 | |
| Weekly R2 | 35,869.04 | 280.71 | |
| Monthly R1 | 36,089.28 | 220.24 | |
| Monthly R2 | 36,870.93 | 781.65 |
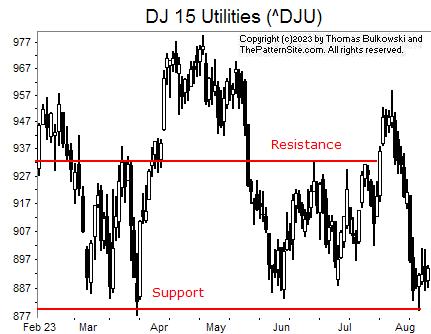
This is a chart of the Dow utilities on the daily scale.
I don't see any good patterns to highlight. I drew a line of support which I hope will stop the decline.
In the middle of the chart is another red line, one showing modest resistance/support. The bottom line appears to be supporting the index but the middle one might not work as well as expected.
![]()
The following is a brief review of how the markets performed over time. The numbers refer to the close-to-close move in the Dow industrials.
Many options expire this week, so traders will be looking to close out their positions, and that suggests increased volatility (large daily price swings).
![]()
The following is based on an SFO article in December 2004 by John Seekinger, titled, "Take a two-dimensional approach." He offers these tips.
| Index | S2 | S1 | Pivot | R1 | R2 |
| Dow Industrials (^DJI): Daily | 34,937 | 35,109 | 35,232 | 35,404 | 35,527 |
| Weekly | 34,718 | 35,000 | 35,289 | 35,571 | 35,860 |
| Monthly | 32,915 | 34,098 | 34,889 | 36,072 | 36,862 |
| S&P500 (^GSPC): Daily | 4,429 | 4,447 | 4,461 | 4,479 | 4,494 |
| Weekly | 4,395 | 4,430 | 4,478 | 4,513 | 4,562 |
| Monthly | 4,270 | 4,367 | 4,487 | 4,584 | 4,704 |
| Nasdaq (^IXIC): Daily | 13,548 | 13,596 | 13,658 | 13,707 | 13,769 |
| Weekly | 13,363 | 13,504 | 13,751 | 13,891 | 14,138 |
| Monthly | 13,030 | 13,338 | 13,892 | 14,199 | 14,754 |
Here are the formulas:
![]()
Earnings season is either underway or should be starting soon. The sessions could be more volatile.
Here's a symbol list of 126 chart and candlestick patterns (13 "investment grade" candle patterns) found in today's securities using my version of Patternz: MMM, AMD, APD, ALK, ALB, AA, ALL, ABC, APA, ANET, ADP, AVA, AXS, BALL, BZH, BRC, CX, CENX, CF, CSCO, CNX, CMCO, CCK, FANG, DFS, ^DJI, EPAM, FWRD, FNV, GNW, GFS, GL, HIG, HTLD, HSII, HELE, HD, HUM, IEX, IDXX, INTC, IBKR, IPI, NVTA, JAZZ, KBH, KLIC, LH, MAN, MRO, NCR, NFLX, NJR, NEWR, NXGN, NUS, OMCL, ON, OTEX, PANW, PDCO, PXD, PINC, PFG, QTWO, REGN, RGS, ROG, SBH, SAND, SLB, SEE, SIGI, SMTC, SHOP, SMAR, TDOC, TEVA, TZOO, UHAL, UIS, UPS, UNM, MDRX, WRB, WPM, ZBRA, IAI, IYE, IEZ, IHE, BOTZ, IYH, IHF, IXC, MXI, IXN, SOXX, IGE, IYF, EWO, EWH, EWM, EWY, EWD, EWL, EWT, IBB, PXJ, PJP, SSO, XLE, XLV, USO, SMH, VHT. Click this link for details (pattern type, start and end dates).
For a list of small patterns (those a few days wide) click this link.
The below industries were the best (rank 1) or worst performing of those I follow.
|
-- Thomas Bulkowski
![]()
$ $ $
Here's a symbol list of 129 chart and candlestick patterns (13 "investment grade" candle patterns) found in today's securities using my version of Patternz: MMM, AA, ALKS, AEL, AME, ARCB, ANET, AGO, AVA, BALL, BECN, BERY, CAL, CX, CNP, CF, CIEN, CINF, CTAS, CLX, CTSH, CL, CMCO, ED, CCK, CMI, FANG, DDS, DFS, DSGR, ^DJU, DTE, EXP, EIX, WIRE, EPAM, EL, EVRG, FAST, FIS, FORM, FWRD, GNW, GPN, GFF, HTLD, HSII, HSY, HUBG, HURC, IDXX, ILMN, INTC, TILE, INTU, JAZZ, JNJ, KBH, KLIC, LZB, LEG, RAMP, MAN, MKTX, MOS, NOV, NJR, NEWR, NEE, OMC, OR, PKE, PDCO, PXD, POR, PPL, PG, PGR, PHM, QTWO, RMBS, REGN, RGS, SBH, SIGI, SRE, SMTC, SMAR, TPR, TDOC, TPX, TJX, RIG, TZOO, UHAL, UGI, VLO, VMI, VEEV, WRB, WLK, WWW, XEL, ITA, IYE, ITB, IEZ, IDU, IYZ, IGV, IXC, IXN, EWO, EWK, EWQ, EWG, EWJ, EWM, PPA, PXJ, ROBO, XLP, XLV, XLU, USO. Click this link for details (pattern type, start and end dates).
For a list of small patterns (those a few days wide) click this link.
$ $ $
You can find setups based on a Fibonacci retrace by clicking on the link.
The following patterns were found manually, not using Patternz. Mr. Bulkowski has excluded any securities he owns from appearing in the list. However, he may add any of the securities listed to his portfolio at any time, just as you can.
In the table below, the red and green colors are based on the historical breakout direction for the associated chart pattern. If a high and tight flag appears, the start and end dates highlight the flagpole only and not the flag.
For details about the chart patterns, click here.
-- Thomas Bulkowski
![]()
| Symbol | Chart Pattern | Bullish Bearish | Start | End | Industry |
| MMM | Pipe top | 07/24/2023 | 07/31/2023 | Diversified Co. | |
| ADTN | Dead-cat bounce | 08/07/2023 | 08/07/2023 | Telecom. Equipment | |
| ALRM | Double Top, Eve and Eve | 07/18/2023 | 07/28/2023 | Computer Software and Svcs | |
| AYX | Dead-cat bounce | 08/08/2023 | 08/08/2023 | Computer Software and Svcs | |
| ACGL | Pipe top | 07/17/2023 | 07/24/2023 | Insurance (Prop/Casualty) | |
| CRL | Broadening top, right-angled and ascending | 06/16/2023 | 08/04/2023 | Biotechnology | |
| CTS | Triple bottom | 06/28/2023 | 07/25/2023 | Electronics | |
| FANG | Rounding bottom | 04/14/2023 | 08/03/2023 | Petroleum (Producing) | |
| DSGR | Double Top, Adam and Adam | 07/21/2023 | 07/31/2023 | Metal Fabricating | |
| EBAY | Pipe top | 07/17/2023 | 07/24/2023 | Internet | |
| FTNT | Dead-cat bounce | 08/04/2023 | 08/04/2023 | Computer Software and Svcs | |
| GPS | Head-and-shoulders bottom | 03/23/2023 | 06/28/2023 | Apparel | |
| HTLD | Pipe top | 07/24/2023 | 07/31/2023 | Trucking/Transp. Leasing | |
| HOV | Triangle, symmetrical | 07/17/2023 | 08/10/2023 | Homebuilding | |
| INCY | Triple bottom | 06/01/2023 | 06/29/2023 | Drug | |
| IBKR | Three Rising Valleys | 05/24/2023 | 07/20/2023 | Securities Brokerage | |
| JAZZ | Ugly double bottom | 07/07/2023 | 08/02/2023 | Biotechnology | |
| KLIC | Multi-peaks | 06/14/2023 | 08/01/2023 | Semiconductor Cap Equip. | |
| RAMP | Head-and-shoulders top | 07/03/2023 | 08/01/2023 | Computer Software and Svcs | |
| MGY | Cup with handle | 04/17/2023 | 08/10/2023 | Petroleum (Producing) | |
| ^IXIC | Double Top, Adam and Eve | 07/19/2023 | 07/31/2023 | None | |
| NTGR | Broadening top, right-angled and ascending | 05/15/2023 | 07/27/2023 | Telecom. Equipment | |
| NTAP | Head-and-shoulders top | 07/12/2023 | 08/02/2023 | Computers and Peripherals | |
| OUT | Dead-cat bounce | 08/04/2023 | 08/04/2023 | Advertising | |
| QCOM | Ugly double bottom | 05/25/2023 | 06/23/2023 | Telecom. Equipment | |
| SLB | Cup with handle | 02/14/2023 | 08/09/2023 | Oilfield Svcs/Equipment | |
| TDC | Double Top, Eve and Adam | 07/19/2023 | 08/01/2023 | Computer Software and Svcs | |
| TTD | Double Top, Eve and Eve | 07/17/2023 | 07/31/2023 | Advertising | |
| TG | Dead-cat bounce | 08/09/2023 | 08/09/2023 | Chemical (Specialty) | |
| VEEV | Head-and-shoulders top | 06/21/2023 | 07/31/2023 | Healthcare Information | |
| VC | Triple top | 07/12/2023 | 08/03/2023 | Electronics | |
| WWW | Dead-cat bounce | 08/10/2023 | 08/10/2023 | Shoe | |
| MGK | Double Top, Adam and Eve | 07/19/2023 | 07/27/2023 | None | |
| VONG | Double Top, Adam and Eve | 07/19/2023 | 07/27/2023 | None |
![]()
Since I post this the night before, check how the futures are trading before market open. Large moves can affect the opening direction.
$ $ $
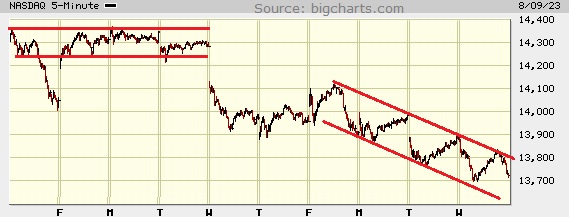
I show a picture of the Nasdaq composite on the 5-minute scale.
I noticed one thing after I looked at this chart. Price tumbled.
So I drew a few trendlines that became channels, shown here as two sets of parallel red lines. The first pair is horizontal and even though price cuts through the lines, it shows a flat trend.
The second channel shows a down-sloping channel. The index has bounced off the top of the channel, suggesting a trip to the other side. It's halfway across now.
My guess? We'll see an upward rebound tomorrow (Thursday).
$ $ $
Here's a symbol list of 177 chart and candlestick patterns (13 "investment grade" candle patterns) found in today's securities using my version of Patternz: MMM, ABT, ATVI, AMD, ATSG, AKAM, ALRM, ALKS, AYX, AMED, AXP, AME, AMN, ANIK, AR, APA, AAPL, ADM, ANET, AVNT, AZTA, BALL, BERY, BIG, BR, BLDR, CLS, CHKP, CHS, CIEN, CNA, CTSH, CMTL, GLW, CCK, DECK, FANG, EXP, EMR, WIRE, EPAM, EQT, EL, EVH, EXPI, FFIV, FIVN, FMC, FORM, FCX, GME, GS, GOOGL, HLIT, HE, HTLD, HSII, HNI, HWM, HUN, ITW, ILMN, INFN, IIIN, PODD, ITGR, INTC, INTU, NVTA, JAZZ, KLIC, LH, LRCX, RAMP, LPLA, MRO, MRCY, MU, MS, MOS, ^IXIC, NFG, NEWR, JWN, NVDA, OMCL, ON, ORCL, PAYX, PEN, PXD, PLXS, PFG, PG, QTWO, KWR, RMBS, RRC, REGN, RGS, RNG, RLI, ROST, ^GSPC, CRM, SLB, SMG, SEE, SRE, SMTC, SHOP, SMAR, SWX, SWN, SPLK, SNPS, TPR, TGT, TDOC, TDC, TJX, TDG, TRV, TZOO, TG, TWLO, UHAL, UNM, VMC, WRB, WMB, WSM, IYC, IYE, ITB, IDU, FDN, BOTZ, IYZ, IXC, SOXX, SLV, IEO, IHI, EWM, EZA, TUR, IBB, DBA, PXJ, PHO, SSO, ROBO, XLY, XLV, XRT, SPY, XLU, UNG, USO, SMH, VIS, VAW, MGK. Click this link for details (pattern type, start and end dates).
For a list of small patterns (those a few days wide) click this link.
$ $ $
The following table shows where Fibonacci retrace values of the day's high-low range are plus pivot points, calculated on the Nasdaq composite, sorted by value. When several are near each other (small differences), the area might act as support or resistance.
-- Thomas Bulkowski
![]()
| © 2023 ThePatternSite.com Metric | Value | Diff | Close (within 10% of the high-low range for the day)? |
| Monthly S2 | 13,032.64 | ||
| Monthly S1 | 13,377.33 | 344.69 | |
| Weekly S2 | 13,501.87 | 124.54 | |
| Daily S2 | 13,572.83 | 70.97 | |
| Weekly S1 | 13,611.94 | 39.11 | |
| Daily S1 | 13,647.43 | 35.48 | |
| Low | 13,698.39 | 50.96 | |
| Close | 13,722.02 | 23.63 | |
| Daily Pivot | 13,772.98 | 50.96 | |
| 61.8% Down from Intraday High | 13,774.85 | 1.86 | Yes! The 61.8% Down from Intraday High is close to the Daily Pivot. |
| 50% Down from Intraday High | 13,798.46 | 23.62 | |
| 38.2% Down from Intraday High | 13,822.08 | 23.62 | |
| Daily R1 | 13,847.58 | 25.49 | |
| Open | 13,897.61 | 50.03 | |
| High | 13,898.54 | 0.93 | Yes! The High is close to the Open. |
| Monthly Pivot | 13,911.94 | 13.40 | Yes! The Monthly Pivot is close to the High. |
| Daily R2 | 13,973.13 | 61.19 | |
| Weekly Pivot | 13,991.43 | 18.29 | Yes! The Weekly Pivot is close to the Daily R2. |
| Weekly R1 | 14,101.50 | 110.08 | |
| Monthly R1 | 14,256.63 | 155.13 | |
| Weekly R2 | 14,480.99 | 224.36 | |
| Monthly R2 | 14,791.24 | 310.25 |
This is a picture of the chart pattern indicator on the daily scale. The indicator is the line chart below a chart of the S&P 500 composite.
We are clearly in a retrace of the uptrend that began in March, or maybe May, or maybe June. Hard to tell because the retrace isn't very large yet. Often the size of the retrace is a function of the prior rise. I studied that and found...it wasn't true. Sigh. Never mind.
The CPI, with its red bar on the far right of the chart suggests the downtrend will continue. It makes me wonder what September will be like (the worst performing month of the year for the Dow industrials and S&P).
The red line is the percentage of stocks at least 20% below their 1-year high (plotted upside down). The blue line is the average percentage drop of stocks below their 1-year high (plotted upside down).
On Tuesday, 30% of stocks in my database are in bear market territory (down at least 20% from their 1-year high).A week ago, it was 28%.The fewest was 26% on 07/31/2023.And the most was 78% on 09/26/2022.
The 522 stocks in my database are down an average of 17% from their yearly high.A week ago, the average was 15%.The peak was 14% on 07/31/2023.And the bottom was 34% on 09/30/2022.
Both lines (red and blue) this week are lower than they were a week ago. Unfortunately, this chart doesn't give much of a clue about anything else, at least not that I could find.
The prior chart is bearish but it wouldn't surprise me to see a snap-back rally. This chart is bearish, too.
I'd like to say that the two bearish charts suggest more of a downward move coming but a little voice inside my head says that's not going to happen this time. Maybe we'll see a big move higher instead.
$ $ $
Here's a symbol list of 187 chart and candlestick patterns (13 "investment grade" candle patterns) found in today's securities using my version of Patternz: DDD, MMM, ABT, ANF, ALRM, ALK, AYX, AXP, AMGN, AMN, AR, AON, ANET, AIZ, ATO, AVNT, BALL, BAX, BERY, BBY, BBW, CIEN, CLF, CNX, CL, CMCO, COP, CXW, GLW, CCRN, CCK, DVN, FANG, DDS, DSGR, D, EMN, EPAM, EQT, EL, EXPI, FIS, FIVN, FMC, FCX, GPS, GPN, HLIT, HE, HAYN, HTLD, HL, HSII, HSY, HUN, INFN, PODD, INTC, ISRG, JAZZ, KALU, K, KMB, KLIC, LH, LLY, RAMP, LOW, MRO, MKTX, MDT, MS, MLI, NJR, NEWR, NWL, NOVT, ORCL, PANW, PKE, PATK, PEN, PETS, PXD, PPL, PINC, PHM, QTWO, DGX, RGS, RNG, RHI, RGLD, CRM, SMG, SEE, STR, SKX, SPLK, SNPS, TGT, TDOC, TDC, TEVA, TDG, TRV, UHAL, UGI, UPS, VFC, WRB, WU, WMB, WWW, IYM, IAI, IYE, IEZ, IHE, FTEC, QTEC, FXL, FXI, BOTZ, IYH, IYZ, IGV, IXC, MXI, IXN, SOXX, SLV, IGE, IEO, IHI, EWO, EWK, EWC, EEM, EWQ, EWG, EWH, EIS, EWI, EWM, EPP, EWS, EZA, EWY, EWD, EWL, THD, IBB, DBA, PBE, PXJ, PJP, ROBO, XLE, XLV, XLB, UNG, SMH, VAW. Click this link for details (pattern type, start and end dates).
For a list of small patterns (those a few days wide) click this link.
-- Thomas Bulkowski
![]()
$ $ $
I show another slider trading quiz featuring United Parcel Service: UPS stock.
$ $ $
Here's a symbol list of 118 chart and candlestick patterns (13 "investment grade" candle patterns) found in today's securities using my version of Patternz: DDD, ACN, ADTN, ALRM, ALK, AMED, AEP, AEL, AFG, AME, ANIK, AAPL, ACGL, AVNT, BAX, BZH, BIIB, BKH, BOOT, BRC, CACI, CNC, CDAY, CHKP, CHD, CI, CMCO, CROX, CW, FANG, DSGR, DOV, DRQ, EBAY, EOG, EG, FAST, FLEX, GPS, GNW, GPRO, HBI, HLIT, HL, HELE, HSIC, HSY, HUBG, HURC, IIIN, IPG, INTU, JAZZ, KFRC, LH, LOW, LXU, MHO, MRO, MKTX, MRTN, MTRX, MRK, MYGN, NEWR, NWL, NOVT, ASGN, OR, OMI, PANW, PATK, PTEN, PYPL, PCG, PXD, PFG, RGS, SCHW, SXI, TRGP, TECH, TFX, SLCA, UPS, VFC, WRB, WMT, WAT, WLK, WWW, IYM, IYK, IEZ, DDM, ICF, EWH, EIS, EWM, EWY, TUR, IBB, PXJ, PJP, UNG, VHT, VIS. Click this link for details (pattern type, start and end dates).
For a list of small patterns (those a few days wide) click this link.
$ $ $
The following table shows where Fibonacci retrace values of the day's high-low range are plus pivot points, calculated on the Dow industrials, sorted by value. When several are near each other (small differences), the area might act as support or resistance.
-- Thomas Bulkowski
![]()
| © 2023 ThePatternSite.com Metric | Value | Diff | Close (within 10% of the high-low range for the day)? |
| Monthly S2 | 32,979.20 | ||
| Monthly S1 | 34,226.16 | 1,246.97 | |
| Weekly S2 | 34,749.97 | 523.80 | |
| Monthly Pivot | 34,952.65 | 202.68 | |
| Daily S2 | 34,993.59 | 40.94 | |
| Weekly S1 | 35,111.55 | 117.96 | |
| Low | 35,125.60 | 14.05 | Yes! The Low is close to the Weekly S1. |
| Open | 35,125.60 | 0.00 | Yes! The Open is close to the Low. |
| Daily S1 | 35,233.36 | 107.76 | |
| 61.8% Down from Intraday High | 35,267.62 | 34.26 | Yes! The 61.8% Down from Intraday High is close to the Daily S1. |
| 50% Down from Intraday High | 35,311.49 | 43.87 | |
| 38.2% Down from Intraday High | 35,355.36 | 43.87 | |
| Daily Pivot | 35,365.37 | 10.01 | Yes! The Daily Pivot is close to the 38.2% Down from Intraday High. |
| Weekly Pivot | 35,395.34 | 29.97 | Yes! The Weekly Pivot is close to the Daily Pivot. |
| Close | 35,473.13 | 77.79 | |
| High | 35,497.38 | 24.25 | Yes! The High is close to the Close. |
| Daily R1 | 35,605.14 | 107.76 | |
| Daily R2 | 35,737.15 | 132.01 | |
| Weekly R1 | 35,756.92 | 19.77 | Yes! The Weekly R1 is close to the Daily R2. |
| Weekly R2 | 36,040.71 | 283.79 | |
| Monthly R1 | 36,199.61 | 158.90 | |
| Monthly R2 | 36,926.10 | 726.48 |
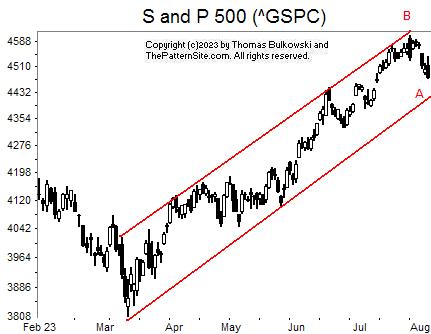
Nothing shows on the chart that's alarming. I show the S&P 500 index on the daily scale.
I drew two up-sloping trendlines along the peaks and valleys. What the resulting channel shows is that price bounces between the two lines.
Going forward, if the trend continues, you'll see the index bounce off the lower trendline at A and bounce up to B. However, given the weakness in the markets, we could see it breakout downward from the channel.
I don't think that's going to happen. Rather, I expect the retrace to finish and then a new upward move resume.
![]()
The following is a brief review of how the markets performed over time. The numbers refer to the close-to-close move in the Dow industrials.
No options expire this week.
![]()
The following is based on an SFO article in December 2004 by John Seekinger, titled, "Take a two-dimensional approach." He offers these tips.
| Index | S2 | S1 | Pivot | R1 | R2 |
| Dow Industrials (^DJI): Daily | 34,729 | 34,897 | 35,202 | 35,370 | 35,675 |
| Weekly | 34,614 | 34,840 | 35,260 | 35,485 | 35,905 |
| Monthly | 32,843 | 33,954 | 34,817 | 35,928 | 36,790 |
| S&P500 (^GSPC): Daily | 4,432 | 4,455 | 4,498 | 4,521 | 4,563 |
| Weekly | 4,396 | 4,437 | 4,516 | 4,557 | 4,635 |
| Monthly | 4,268 | 4,373 | 4,490 | 4,595 | 4,712 |
| Nasdaq (^IXIC): Daily | 13,754 | 13,832 | 13,975 | 14,053 | 14,197 |
| Weekly | 13,564 | 13,737 | 14,054 | 14,226 | 14,543 |
| Monthly | 13,095 | 13,502 | 13,974 | 14,381 | 14,854 |
Here are the formulas:
![]()
Earnings season is either underway or should be starting soon. The sessions could be more volatile.
Here's a symbol list of 167 chart and candlestick patterns (13 "investment grade" candle patterns) found in today's securities using my version of Patternz: AYI, AEIS, AES, APD, ALRM, AA, AEP, AXP, AFG, AMN, AAPL, ACGL, ADM, ARW, ADP, AVNT, BAX, BECN, BBY, BOOT, BAH, BRC, BRKR, BBW, CBT, CNC, CHKP, CI, CMCO, ED, COP, COST, COTY, CRH, CCRN, CMI, FANG, DDS, DSGR, ^DJT, ^DJI, D, DRQ, EBAY, EOG, EXPD, FICO, FARO, FAST, FTNT, FTV, IT, GILD, GPRO, GGG, HAYN, HELE, HSY, HUBG, HUN, IIIN, ISRG, JBLU, KBH, KFRC, LAMR, LEN, LMT, LOW, MANH, MRO, MCHX, MKTX, MRK, MS, MLI, MYGN, NBR, NOV, NTAP, NEWR, NKE, NOVT, OXY, OMCL, ASGN, ORCL, OUT, OMI, PANW, PKE, PDCO, PTEN, PAYX, PCTY, PYPL, PXD, PPL, PINC, PFG, PG, PGR, QTWO, QCOM, RGA, ROP, ^GSPC, CRM, SLB, SAIC, SEIC, NOW, SKX, SPLK, SPSC, TECH, TFX, TXT, TJX, TSCO, SLCA, UNH, VMI, VEEV, VRSN, WRB, WMT, WAT, WSC, IEZ, IHE, DDM, QTEC, FXL, IYZ, IGV, IXC, IEO, IHI, EWO, EWI, EWM, EWY, TUR, DBA, PXJ, SSO, ROBO, XRT, SPY, USO, MGK, VONG. Click this link for details (pattern type, start and end dates).
For a list of small patterns (those a few days wide) click this link.
The below industries were the best (rank 1) or worst performing of those I follow.
|
-- Thomas Bulkowski
![]()
$ $ $
Here's a symbol list of 146 chart and candlestick patterns (13 "investment grade" candle patterns) found in today's securities using my version of Patternz: MMM, ABT, ACIW, ADTN, AMWD, AMN, APA, AAPL, ACGL, ARW, ATO, BSET, BAX, BERY, BKNG, BRKR, CNC, CDAY, CHKP, CHD, CLX, ED, COTY, CCRN, CW, FANG, DDS, DFS, EBAY, EVH, EXPI, EZPW, FFIV, FARO, FE, FORM, FWRD, GILD, GFF, GES, HQY, HL, HUM, IDA, ISRG, JKHY, JBLU, KFRC, KMB, LAMR, LANC, LOW, MTSI, MCHX, MKTX, MLM, MTRN, MDC, MRK, MCO, MUR, NOV, NCR, NEWR, NI, NOVT, OGE, ASGN, ON, OTEX, ORCL, OUT, PYPL, PEN, PETS, PXD, PFG, QCOM, RRC, REGN, ROST, RGLD, CRM, SMG, SRE, SO, LUV, TECH, TDOC, TFX, TEVA, TXT, TTD, SLCA, UIS, UNM, VMI, VECO, VEEV, V, VMC, WRB, WMB, WOLF, ITA, IYM, IYC, IEZ, IYH, ILF, SLV, IHI, EWK, EWH, EWI, EWJ, EWM, EWW, EZA, EWY, EWD, EWL, EWT, THD, DBA, PBE, PEJ, PXJ, XAR, VHT, VAW. Click this link for details (pattern type, start and end dates).
For a list of small patterns (those a few days wide) click this link.
$ $ $
You can find setups based on a Fibonacci retrace by clicking on the link.
The following patterns were found manually, not using Patternz. Mr. Bulkowski has excluded any securities he owns from appearing in the list. However, he may add any of the securities listed to his portfolio at any time, just as you can.
In the table below, the red and green colors are based on the historical breakout direction for the associated chart pattern. If a high and tight flag appears, the start and end dates highlight the flagpole only and not the flag.
For details about the chart patterns, click here.
-- Thomas Bulkowski
![]()
| Symbol | Chart Pattern | Bullish Bearish | Start | End | Industry |
| AON | Triple top | 06/30/2023 | 07/25/2023 | Insurance (Diversified) | |
| AVY | Three Rising Valleys | 06/01/2023 | 07/25/2023 | Packaging and Container | |
| BCPC | Triple bottom | 07/06/2023 | 07/27/2023 | Chemical (Specialty) | |
| BAX | Pipe top | 07/17/2023 | 07/24/2023 | Medical Supplies | |
| BKNG | Double Top, Eve and Adam | 07/19/2023 | 07/28/2023 | Internet | |
| BRC | Triple bottom | 05/31/2023 | 07/07/2023 | Chemical (Diversified) | |
| CDAY | Double Top, Adam and Adam | 07/19/2023 | 07/31/2023 | Information Services | |
| XRAY | Double Top, Adam and Eve | 07/14/2023 | 07/27/2023 | Medical Supplies | |
| FWRD | Dead-cat bounce | 08/03/2023 | 08/03/2023 | Trucking/Transp. Leasing | |
| FRD | Flag, high and tight | 06/06/2023 | 08/03/2023 | Building Materials | |
| GILD | Pipe top | 07/17/2023 | 07/24/2023 | Biotechnology | |
| GPN | Ugly double bottom | 06/28/2023 | 07/27/2023 | Computer Software and Svcs | |
| HLIT | Dead-cat bounce | 08/01/2023 | 08/01/2023 | Telecom. Equipment | |
| HOLX | Double Top, Eve and Eve | 06/20/2023 | 07/24/2023 | Medical Supplies | |
| HWM | Double Top, Adam and Adam | 07/12/2023 | 07/31/2023 | Aerospace/Defense | |
| HUM | Ugly double bottom | 07/13/2023 | 07/28/2023 | Medical Services | |
| KFRC | Pipe top | 07/17/2023 | 07/24/2023 | Human Resources | |
| KMB | Triple top | 06/05/2023 | 07/24/2023 | Household Products | |
| NOVT | Double Top, Adam and Eve | 06/30/2023 | 07/17/2023 | Precision Instrument | |
| ASGN | Pipe top | 07/17/2023 | 07/24/2023 | Human Resources | |
| PXD | Rounding bottom | 04/17/2023 | 08/02/2023 | Petroleum (Producing) | |
| RMBS | Dead-cat bounce | 08/01/2023 | 08/01/2023 | Semiconductor Cap Equip. | |
| SMG | Double Top, Adam and Eve | 07/12/2023 | 08/01/2023 | Chemical (Basic) | |
| SUM | Triangle, symmetrical | 06/30/2023 | 08/02/2023 | Cement and Aggregates | |
| XEL | Broadening bottom | 07/05/2023 | 07/26/2023 | Electric Utility (West) | |
| ZBRA | Dead-cat bounce | 08/01/2023 | 08/01/2023 | Computers and Peripherals |
![]()
Since I post this the night before, check how the futures are trading before market open. Large moves can affect the opening direction.
$ $ $
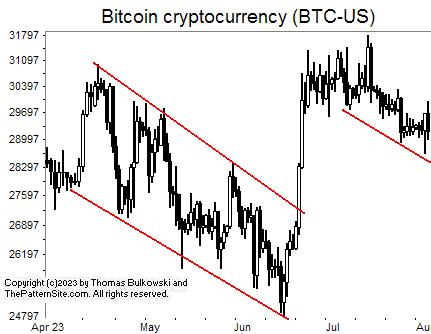
I show a picture of bitcoin (BTC-USD) on the daily scale.
There's not much I can say about the chart because nothing really much happened.
I drew trendlines which I show in red, along price movement. What strikes me is the slope of the lines is similar.
What happens next? My guess is the coin will move higher but I can't point to any reason for that except a gut feel.
$ $ $
Here's a symbol list of 145 chart and candlestick patterns (13 "investment grade" candle patterns) found in today's securities using my version of Patternz: DDD, MMM, ABT, ACIW, AMD, AFL, AKAM, ALB, ALKS, AYX, DOX, ANIK, AMAT, ACGL, AWI, AGO, AVA, AXS, BCPC, BSET, BAX, BERY, BBY, BIG, BKNG, BG, CNC, CI, CLNE, CNO, CGNX, CTS, DFS, DRQ, EBAY, EME, EMR, EL, FICO, FIS, FE, FNV, FDP, GME, GILD, GFS, GL, GPRO, HLIT, HON, HWM, HUM, IDXX, ITW, IIIN, JBLU, KFRC, LANC, LOW, MRK, MGEE, MU, MSFT, MS, NCR, NJR, NEWR, NI, NOVT, NUS, OMCL, ASGN, ORCL, PKE, PXD, PFG, PG, PGR, RGS, RGA, RLI, RHI, RGLD, SMG, SEIC, SCI, SPSC, TECH, TFX, TER, TEVA, TXN, UHAL, SLCA, WRB, WSO, WMB, WWW, IAI, IYC, FXI, BOTZ, IEV, MXI, IXN, ILF, SLV, IHI, EWA, EWO, EWK, EWZ, EWC, EEM, EWQ, EWG, EWH, EWI, EWJ, EWM, EWW, EPP, EWS, EZA, EWY, EWP, EWD, EWT, EWU, IBB, PBE, PEJ, ROBO, XLY, GLD, UNG. Click this link for details (pattern type, start and end dates).
For a list of small patterns (those a few days wide) click this link.
$ $ $
The following table shows where Fibonacci retrace values of the day's high-low range are plus pivot points, calculated on the Nasdaq composite, sorted by value. When several are near each other (small differences), the area might act as support or resistance.
-- Thomas Bulkowski
![]()
| © 2023 ThePatternSite.com Metric | Value | Diff | Close (within 10% of the high-low range for the day)? |
| Monthly S2 | 12,806.01 | ||
| Monthly S1 | 13,389.73 | 583.72 | |
| Weekly S2 | 13,747.19 | 357.46 | |
| Daily S2 | 13,788.33 | 41.14 | |
| Weekly S1 | 13,860.32 | 71.99 | |
| Daily S1 | 13,880.89 | 20.57 | Yes! The Daily S1 is close to the Weekly S1. |
| Low | 13,914.81 | 33.92 | |
| Monthly Pivot | 13,918.14 | 3.33 | Yes! The Monthly Pivot is close to the Low. |
| Close | 13,973.45 | 55.31 | |
| 61.8% Down from Intraday High | 13,998.48 | 25.03 | |
| Daily Pivot | 14,007.37 | 8.89 | Yes! The Daily Pivot is close to the 61.8% Down from Intraday High. |
| 50% Down from Intraday High | 14,024.33 | 16.96 | Yes! The 50% Down from Intraday High is close to the Daily Pivot. |
| 38.2% Down from Intraday High | 14,050.18 | 25.85 | |
| Daily R1 | 14,099.93 | 49.75 | |
| Weekly Pivot | 14,110.26 | 10.33 | Yes! The Weekly Pivot is close to the Daily R1. |
| Open | 14,132.73 | 22.47 | |
| High | 14,133.85 | 1.12 | Yes! The High is close to the Open. |
| Weekly R1 | 14,223.39 | 89.54 | |
| Daily R2 | 14,226.41 | 3.02 | Yes! The Daily R2 is close to the Weekly R1. |
| Weekly R2 | 14,473.33 | 246.92 | |
| Monthly R1 | 14,501.86 | 28.53 | |
| Monthly R2 | 15,030.27 | 528.41 |
Here's the updated 2023 forecast, presented in slider format.
$ $ $
Here's a symbol list of 130 chart and candlestick patterns (13 "investment grade" candle patterns) found in today's securities using my version of Patternz: DDD, MMM, AXDX, AES, ATSG, AYX, DOX, AMED, AME, AMN, ANIK, AMAT, ACGL, AWI, ARW, AVY, BAX, BMRN, BRC, BFH, BCO, BBW, CPB, CNC, CNP, CDAY, CHS, CI, CLNE, CGNX, CMCO, CONN, CXW, CR, CMI, DHR, DRQ, EBAY, EMR, EG, GPS, IT, GNW, GILD, GPRO, GFF, HLIT, HSY, HOLX, HON, HOV, HURC, ILMN, INFN, NSP, NVTA, JKHY, JBLU, KBH, K, KFRC, KLIC, LZB, LEG, LDOS, LLY, RAMP, MRK, NJR, NEWR, NEE, NXGN, OLN, ASGN, PANW, PNW, PXD, PFG, DGX, RMBS, RGS, ROK, RCKY, ROG, RGLD, SBH, SMG, SEIC, STR, TPR, TECH, TFX, TJX, TSCO, TREX, SLCA, VRSN, VC, WRB, WMB, WSM, WSC, WDAY, ZBRA, ITB, IYZ, IXN, EWK, EWJ, EWM, EWP, EWD, EWL, TUR, IBB, ROBO, GLD, XHB, UNG. Click this link for details (pattern type, start and end dates).
For a list of small patterns (those a few days wide) click this link.
-- Thomas Bulkowski
![]()
$ $ $
I show another slider trading quiz featuring United Parcel Service 2: UPS stock.
$ $ $
Here's a symbol list of 140 chart and candlestick patterns (13 "investment grade" candle patterns) found in today's securities using my version of Patternz: MMM, AYI, ADBE, APD, ALL, DOX, AXP, ANIK, AR, APA, APOG, ADM, AWI, ARW, BSET, BECN, BAH, BCO, CPB, CENX, CDAY, CF, CHS, CHD, CINF, CNA, CNO, COP, CXW, CR, CTS, DHR, DVN, EOG, EXPI, XOM, FARO, FCX, FRD, GNW, GOOGL, HIG, HSY, HON, ITW, ILMN, INTC, ISRG, JBLU, K, KLAC, LHX, LEN, LLY, RAMP, LMT, MRO, MRTN, MOS, NBR, NFG, NEWR, NXGN, NKE, JWN, NOC, OXY, OMC, ON, OR, OMI, PYPL, PCG, PXD, PG, QTWO, QCOM, RL, RHI, R, SMG, SIGI, SMTC, NOW, SHW, SHOP, STR, SO, SCCO, SSYS, TDC, TER, TJX, VEEV, VRSN, VC, WRB, WSM, WOLF, WWD, WDAY, ITA, IYE, ITB, IEZ, QTEC, FXL, IEV, IGV, IXC, MXI, ILF, IGE, IEO, EWA, EWO, EWZ, EWH, EWM, EWS, THD, TUR, PPA, PXJ, XLE, XRT, XAR, USO. Click this link for details (pattern type, start and end dates).
For a list of small patterns (those a few days wide) click this link.
$ $ $
The following table shows where Fibonacci retrace values of the day's high-low range are plus pivot points, calculated on the Dow industrials, sorted by value. When several are near each other (small differences), the area might act as support or resistance.
-- Thomas Bulkowski
![]()
| © 2023 ThePatternSite.com Metric | Value | Diff | Close (within 10% of the high-low range for the day)? |
| Monthly S2 | 32,903.37 | ||
| Monthly S1 | 34,231.45 | 1,328.08 | |
| Monthly Pivot | 34,938.40 | 706.95 | |
| Weekly S2 | 35,045.05 | 106.65 | |
| Weekly S1 | 35,302.29 | 257.24 | |
| Daily S2 | 35,382.17 | 79.88 | |
| Low | 35,430.22 | 48.05 | |
| Open | 35,465.97 | 35.75 | |
| Daily S1 | 35,470.85 | 4.88 | Yes! The Daily S1 is close to the Open. |
| Weekly Pivot | 35,473.82 | 2.97 | Yes! The Weekly Pivot is close to the Daily S1. |
| 61.8% Down from Intraday High | 35,482.45 | 8.63 | Yes! The 61.8% Down from Intraday High is close to the Weekly Pivot. |
| 50% Down from Intraday High | 35,498.59 | 16.14 | |
| 38.2% Down from Intraday High | 35,514.72 | 16.13 | |
| Daily Pivot | 35,518.90 | 4.18 | Yes! The Daily Pivot is close to the 38.2% Down from Intraday High. |
| Close | 35,559.53 | 40.63 | |
| High | 35,566.95 | 7.42 | Yes! The High is close to the Close. |
| Daily R1 | 35,607.58 | 40.63 | |
| Daily R2 | 35,655.63 | 48.05 | |
| Weekly R1 | 35,731.06 | 75.43 | |
| Weekly R2 | 35,902.59 | 171.53 | |
| Monthly R1 | 36,266.48 | 363.89 | |
| Monthly R2 | 36,973.43 | 706.95 |
Support this site! Clicking any of the books (below) takes you to
Amazon.com If you buy ANYTHING while there, they pay for the referral.
Legal notice for paid links: "As an Amazon Associate I earn from qualifying purchases."
|
My Stock Market Books
|
My Novels
Orb Foresight Rewrite Coming!
|