
As of 04/27/2026
Indus: 49,168 -62.92 -0.1%
Trans: 20,844 -48.16 -0.2%
Utils: 1,155 +0.01 +0.0%
Nasdaq: 24,887 +50.50 +0.2%
S&P 500: 7,174 +8.83 +0.1%
|
YTD
+2.3%
+20.1%
+8.1%
+7.1%
+4.8%
|
|
As of 04/27/2026
Indus: 49,168 -62.92 -0.1%
Trans: 20,844 -48.16 -0.2%
Utils: 1,155 +0.01 +0.0%
Nasdaq: 24,887 +50.50 +0.2%
S&P 500: 7,174 +8.83 +0.1%
|
YTD
+2.3%
+20.1%
+8.1%
+7.1%
+4.8%
| |
|
| ||
$ $ $
Here's a symbol list of 188 chart and candlestick patterns (13 "investment grade" candle patterns) found in today's securities using my version of Patternz: MMM, ADBE, AFL, APD, AKAM, AMZN, AMED, AEL, ABC, ANIK, AAPL, ACGL, ARW, AVNT, AVA, BAX, BERY, BKH, BKNG, BOOT, BAH, BCO, BMY, BBW, CBT, CLS, CNP, CF, CRL, CHD, CNX, CGNX, CAG, GLW, CSGP, COST, CROX, CTS, DSGR, D, DRQ, ELV, EME, EXPI, FARO, FLS, FTNT, FCX, FRD, GILD, GFS, GL, GMS, GGG, HLIT, HE, HTLD, HSII, HELE, HSIC, HSY, HON, IEX, ITW, ILMN, TILE, IPG, KFRC, LDOS, LLY, LOW, MANH, MCHX, MRK, META, MLKN, MYGN, NOV, NTGR, NTAP, NJR, NI, NWPX, OGE, ASGN, ON, PKE, PDCO, PXD, PLXS, PPL, PG, PEG, QTWO, DGX, RMBS, RNG, RHI, RCKY, ROP, ^GSPC, SAIC, SHOP, SLGN, LUV, SSYS, TECH, TDOC, TER, TJX, TSCO, TDG, RIG, UHAL, SLCA, UNH, UNM, VRSN, VC, WMT, WOLF, WWW, WWD, XEL, ZBRA, IYK, IYC, ITB, IEZ, IDU, BOTZ, ICF, IYF, IHI, EWO, EWK, EWZ, EWC, EEM, EWQ, EWH, EWI, EWJ, EWM, EWW, EPP, EWT, PXJ, PJP, IEV, ILF, SSO, XLY, XLF, XHB, SPY, VIS, MGK. Click this link for details (pattern type, start and end dates).
For a list of small patterns (those a few days wide) click this link.
$ $ $
You can find setups based on a Fibonacci retrace by clicking on the link.
The following patterns were found manually, not using Patternz. Mr. Bulkowski has excluded any securities he owns from appearing in the list. However, he may add any of the securities listed to his portfolio at any time, just as you can.
In the table below, the red and green colors are based on the historical breakout direction for the associated chart pattern. If a high and tight flag appears, the start and end dates highlight the flagpole only and not the flag.
For details about the chart patterns, click here.
-- Thomas Bulkowski
![]()
| Symbol | Chart Pattern | Bullish Bearish | Start | End | Industry |
| DOX | Triple top | 02/01/2023 | 04/12/2023 | IT Services | |
| ADP | Triangle, symmetrical | 03/06/2023 | 04/21/2023 | IT Services | |
| AVNT | Double Top, Adam and Eve | 04/03/2023 | 04/12/2023 | Chemical (Specialty) | |
| BERY | Double Top, Adam and Eve | 04/03/2023 | 04/18/2023 | Packaging and Container | |
| BBW | Pipe top | 04/10/2023 | 04/17/2023 | Retail (Special Lines) | |
| CALM | Pipe top | 03/27/2023 | 04/03/2023 | Food Processing | |
| CE | Double Top, Adam and Eve | 04/03/2023 | 04/14/2023 | Chemical (Basic) | |
| CVX | Head-and-shoulders top | 04/03/2023 | 04/24/2023 | Petroleum (Integrated) | |
| CINF | Double Top, Adam and Eve | 03/21/2023 | 04/03/2023 | Insurance (Prop/Casualty) | |
| CTAS | Double Top, Adam and Adam | 03/30/2023 | 04/18/2023 | Industrial Services | |
| CLF | Scallop, ascending and inverted | 11/03/2022 | 12/19/2022 | Metals and Mining (Div.) | |
| CROX | Dead-cat bounce | 04/27/2023 | 04/27/2023 | Shoe | |
| CTS | Pipe top | 03/27/2023 | 04/03/2023 | Electronics | |
| CW | Double Top, Adam and Adam | 04/03/2023 | 04/18/2023 | Machinery | |
| DTE | Ugly double bottom | 03/23/2023 | 04/13/2023 | Electric Utility (Central) | |
| EPAM | Double Top, Eve and Eve | 04/03/2023 | 04/13/2023 | IT Services | |
| EXC | Ugly double bottom | 03/23/2023 | 04/14/2023 | Electric Utility (East) | |
| FDS | Ugly double bottom | 03/23/2023 | 04/10/2023 | Information Services | |
| FICO | Pipe bottom | 03/13/2023 | 03/20/2023 | IT Services | |
| FLEX | Pipe top | 03/27/2023 | 04/03/2023 | Electronics | |
| FTV | Double Top, Adam and Adam | 04/03/2023 | 04/14/2023 | Industrial Services | |
| GILD | Ugly double bottom | 03/17/2023 | 04/12/2023 | Biotechnology | |
| GFS | Double Top, Adam and Adam | 02/14/2023 | 03/31/2023 | Semiconductor | |
| HLIT | Pipe top | 04/10/2023 | 04/17/2023 | Telecom. Equipment | |
| HQY | Three Falling Peaks | 03/22/2023 | 04/17/2023 | Healthcare Information | |
| HSIC | Double Top, Adam and Adam | 04/11/2023 | 04/25/2023 | Medical Supplies | |
| KFRC | Pipe top | 04/10/2023 | 04/17/2023 | Human Resources | |
| LANC | Three Rising Valleys | 02/02/2023 | 04/17/2023 | Food Processing | |
| MGY | Double Top, Adam and Eve | 04/04/2023 | 04/17/2023 | Petroleum (Producing) | |
| MGEE | Head-and-shoulders top | 03/20/2023 | 04/21/2023 | Electric Utility (Central) | |
| ^IXIC | Double Top, Eve and Eve | 03/31/2023 | 04/18/2023 | None | |
| NTGR | Dead-cat bounce | 04/27/2023 | 04/27/2023 | Telecom. Equipment | |
| NTAP | Pipe top | 04/10/2023 | 04/17/2023 | Computers and Peripherals | |
| NOVT | Head-and-shoulders top | 03/31/2023 | 04/24/2023 | Precision Instrument | |
| PANW | Broadening top | 03/21/2023 | 04/18/2023 | Computer Software and Svcs | |
| PDCO | Rectangle bottom | 03/22/2023 | 04/27/2023 | Medical Supplies | |
| PEN | Broadening top | 04/03/2023 | 04/18/2023 | Medical Supplies | |
| KWR | Double Top, Adam and Eve | 04/03/2023 | 04/12/2023 | Chemical (Specialty) | |
| DGX | Ugly double bottom | 03/17/2023 | 04/19/2023 | Medical Services | |
| REGN | Triple top | 03/29/2023 | 04/13/2023 | Biotechnology | |
| SAIA | Pipe bottom | 04/03/2023 | 04/10/2023 | Trucking/Transp. Leasing | |
| SEE | Scallop, ascending and inverted | 03/24/2023 | 04/26/2023 | Packaging and Container | |
| LUV | Head-and-shoulders top | 03/31/2023 | 04/20/2023 | Air Transport | |
| SPLK | Head-and-shoulders top | 03/21/2023 | 04/18/2023 | E-Commerce | |
| SPSC | Triple top | 04/04/2023 | 04/24/2023 | E-Commerce | |
| TDC | Double Top, Eve and Eve | 04/04/2023 | 04/18/2023 | Computer Software and Svcs | |
| TXN | Head-and-shoulders top | 03/23/2023 | 04/18/2023 | Semiconductor | |
| RIG | Head-and-shoulders top | 03/29/2023 | 04/13/2023 | Oilfield Svcs/Equipment | |
| TREX | Head-and-shoulders bottom | 03/17/2023 | 04/05/2023 | Building Materials | |
| UGI | Head-and-shoulders top | 04/03/2023 | 04/21/2023 | Natural Gas (Distributor) | |
| VFC | Ugly double bottom | 03/24/2023 | 04/10/2023 | Apparel | |
| WMT | Ugly double bottom | 03/10/2023 | 04/14/2023 | Retail Store | |
| WLK | Double Top, Adam and Eve | 04/03/2023 | 04/14/2023 | Chemical (Basic) | |
| WMB | Head-and-shoulders top | 04/03/2023 | 04/24/2023 | Natural Gas (Distributor) | |
| WOLF | Dead-cat bounce | 04/27/2023 | 04/27/2023 | Semiconductor | |
| IGV | Double Top, Eve and Eve | 04/04/2023 | 04/18/2023 | Computer Software and Svcs | |
| SOXX | Double Top, Eve and Eve | 03/23/2023 | 03/31/2023 | Semiconductor | |
| XLK | Double Top, Eve and Eve | 04/04/2023 | 04/18/2023 | IT Services |
![]()
Since I post this the night before, check how the futures are trading before market open. Large moves can affect the opening direction.
$ $ $
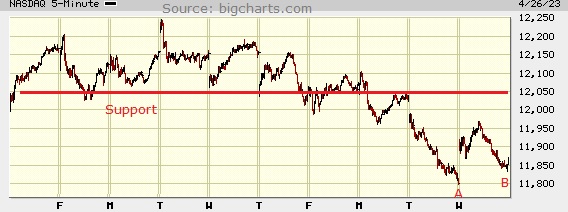
I show a picture of the Nasdaq composite on the 5-minute scale.
Not much has happened on the chart. I show a line of support or resistance, in red, depending on which side of the line price is on. If price is above the line, the line acts as support. If it's below the line, it acts as overhead resistance.
Notice that at A the index bottomed but at B, it closed higher. The Dow industrials were down 228 points but the Nasdaq was up 55. At one time, the two indices would move together but we see this kind of counter-trend action in the last few years.
$ $ $
Here's a symbol list of 229 chart and candlestick patterns (13 "investment grade" candle patterns) found in today's securities using my version of Patternz: ABT, ACIW, AMD, AES, A, ATSG, ALRM, AA, AYX, AXP, APH, ANIK, APOG, ANET, AWI, ADP, AVY, AVNT, BALL, BAX, BERY, BAH, BSX, BCO, BMY, BBW, CBT, CALM, CAL, CNP, CENX, CDAY, CF, CHKP, CTAS, CLNE, CGNX, CXW, GLW, CSGP, CROX, CCRN, CTS, CW, DFS, ^DJT, D, DOV, DRQ, EBAY, EMR, WIRE, FARO, FLS, FWRD, FCX, FDP, FRD, GD, GE, GILD, GFS, HLIT, HQY, HTLD, HUBG, JBHT, HUN, ILMN, INCY, IBKR, TILE, IPI, INTU, KMT, KFRC, LHX, LZB, LDOS, RAMP, LMT, L, LOW, MHO, MGY, MANH, MRTN, MTRX, MRCY, META, MU, MSFT, MLKN, MYGN, NOV, NCR, NTGR, NTAP, NJR, NEE, NOC, NWPX, NOVT, NVDA, OTEX, PKG, PANW, PKE, PATK, PYPL, PRFT, PKI, PFE, PLXS, PINC, PG, QTWO, QCOM, DGX, RJF, REGN, RNG, RHI, ROK, R, SAIA, SAIC, SMG, SEE, SHOP, SCCO, LUV, SWX, SWN, SUM, TPR, TDY, TXT, TMO, TDG, RIG, TZOO, TWLO, UGI, UPS, VMI, VC, VMC, WMT, WAT, WERN, WLK, WWW, WWD, WDAY, ITA, IAI, ITB, IEZ, FTEC, QTEC, FXL, FXI, IGV, SLV, IYF, IHI, EWA, EWO, EWK, EWZ, EWC, EEM, EWQ, EWG, EWH, EWI, EWM, EPP, EWY, EWD, EWL, EWT, TUR, IBB, PBE, PXJ, PJP, PHO, IEV, IXN, MXI, XLF, GLD, XLI, XLB, XLK, SMH, VIS, VAW. Click this link for details (pattern type, start and end dates).
For a list of small patterns (those a few days wide) click this link.
$ $ $
The following table shows where Fibonacci retrace values of the day's high-low range are plus pivot points, calculated on the Nasdaq composite, sorted by value. When several are near each other (small differences), the area might act as support or resistance.
-- Thomas Bulkowski
![]()
| © 2023 ThePatternSite.com Metric | Value | Diff | Close (within 10% of the high-low range for the day)? |
| Monthly S2 | 11,188.75 | ||
| Monthly S1 | 11,521.55 | 332.80 | |
| Daily S2 | 11,750.22 | 228.67 | |
| Weekly S2 | 11,770.26 | 20.04 | |
| Daily S1 | 11,802.28 | 32.03 | |
| Weekly S1 | 11,812.30 | 10.02 | Yes! The Weekly S1 is close to the Daily S1. |
| Low | 11,833.07 | 20.77 | |
| Close | 11,854.35 | 21.28 | |
| Monthly Pivot | 11,883.49 | 29.14 | |
| 61.8% Down from Intraday High | 11,884.61 | 1.12 | Yes! The 61.8% Down from Intraday High is close to the Monthly Pivot. |
| Daily Pivot | 11,885.14 | 0.53 | Yes! The Daily Pivot is close to the 61.8% Down from Intraday High. |
| 50% Down from Intraday High | 11,900.53 | 15.39 | |
| Open | 11,913.23 | 12.70 | Yes! The Open is close to the 50% Down from Intraday High. |
| 38.2% Down from Intraday High | 11,916.45 | 3.22 | Yes! The 38.2% Down from Intraday High is close to the Open. |
| Daily R1 | 11,937.20 | 20.75 | |
| High | 11,967.99 | 30.79 | |
| Daily R2 | 12,020.06 | 52.07 | |
| Weekly Pivot | 12,028.87 | 8.81 | Yes! The Weekly Pivot is close to the Daily R2. |
| Weekly R1 | 12,070.91 | 42.05 | |
| Monthly R1 | 12,216.29 | 145.38 | |
| Weekly R2 | 12,287.48 | 71.19 | |
| Monthly R2 | 12,578.23 | 290.75 |
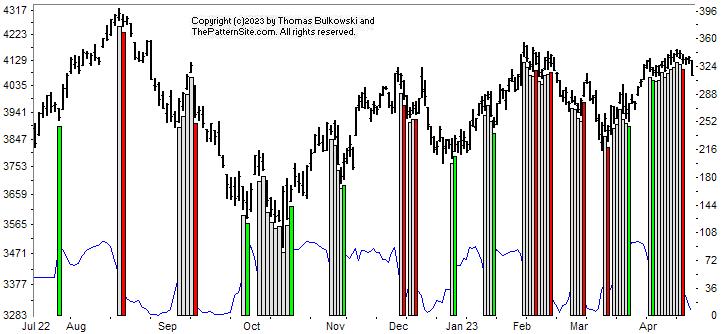
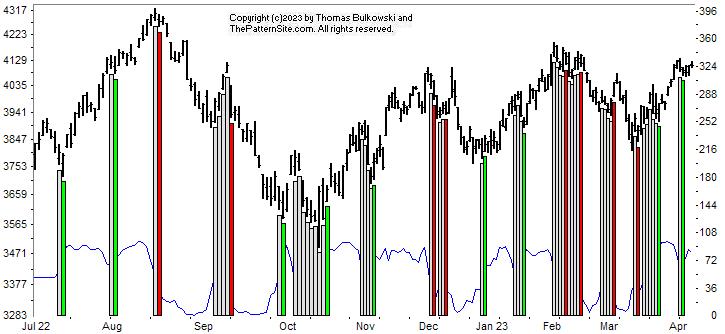
This is a picture of the chart pattern indicator on the daily scale. The indicator is the line chart below a chart of the S&P 500 composite.
Back on April 12 and April 19, I warned of a bearish turn the market would likely take. We've seen the downturn now. How far the market will drop will depend on earnings reports. We could see the markets rise instead of fall.
Clearly the CPI is saying the market is bearish. That's what the vertical red bar on the far right of the chart signals. Look at the thin blue line (the CPI line) near the bottom of the chart. It's at or close to 0, so it's bearish. Of course, one could argue that things couldn't get much worse for the CPI line (meaning it could bounce up). I think that's premature. I think the market will continue to drop.
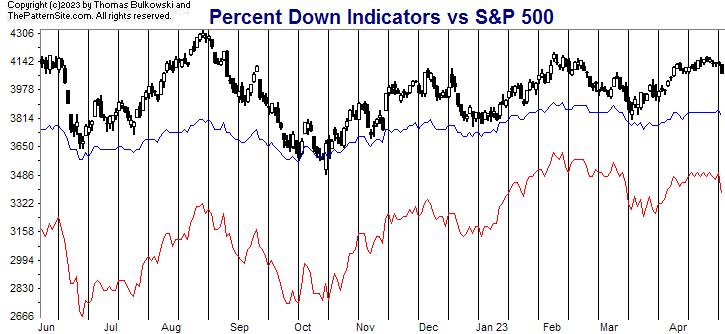
The red line is the percentage of stocks at least 20% below their 1-year high (plotted upside down). The blue line is the average percentage drop of stocks below their 1-year high (plotted upside down).
On Tuesday, 44% of stocks in my database are in bear market territory (down at least 20% from their 1-year high).A week ago, it was 39%.The fewest was 32% on 02/02/2023.And the most was 81% on 06/17/2022.
The 519 stocks in my database are down an average of 21% from their yearly high.A week ago, the average was 19%.The peak was 16% on 02/02/2023.And the bottom was 34% on 09/30/2022.
Both the red and blue lines are more bearish this week than they were a week ago. Indeed, the more sensitive of the two lines, the red one, made a steep plunge today.
The two charts are bearish. Although the CPI could bounce upward here, I think we're only getting started. After earnings season ends, then it might be time to nibble on your favorite stocks or ETFs.
$ $ $
I released a research article on meme stocks.
$ $ $
Here's a symbol list of 201 chart and candlestick patterns (13 "investment grade" candle patterns) found in today's securities using my version of Patternz: MMM, ABT, AXDX, ACIW, ALRM, ALK, AA, AYX, AEE, AEP, ANIK, AON, ADM, ANET, AWI, ADSK, AVY, AVNT, BALL, BSET, BAX, BERY, BIO, BKNG, BOOT, BSX, BFH, BCO, BMY, BBW, BG, CBT, CDNS, CALM, CAL, CE, CLS, CNC, CNP, CENX, CDAY, CF, CHKP, CINF, CTAS, CMCO, CMTL, ED, CAG, GLW, CROX, CSGS, CTS, XRAY, DDS, DFS, EBAY, EZPW, FARO, FLEX, FLS, FCX, FDP, GME, IT, GE, GILD, GFS, HLIT, HQY, HWM, HUN, HURC, INCY, NSP, PODD, ITGR, INTC, IPI, JNJ, KALU, KMT, KFRC, KMB, KSS, LZB, LNC, L, M, MCHX, MTRN, MTRX, MU, MLKN, MS, MYGN, NCR, NTGR, NTAP, NXGN, NVDA, ORI, ASGN, OTEX, PANW, PAYX, PRFT, PKI, PNW, PLXS, PFG, PG, PRU, PHM, QCOM, RMBS, RRC, RJF, RLI, RHI, ROK, RCKY, RES, R, SCHW, SEE, SKX, SKYW, SMAR, SO, SCCO, SNPS, TGT, TDC, TXT, RIG, TWLO, UHAL, SLCA, UGI, VRSN, VC, WMT, WAT, WSO, WLK, WDAY, ITA, ITB, IEZ, QTEC, FXL, FXI, IHF, IAT, IGV, IHI, EWA, EWZ, EWC, EEM, EWH, EIS, EWM, EPP, EWS, EZA, EWY, EWL, EWT, THD, TUR, PBE, PXJ, MXI, XLB, SMH, VAW. Click this link for details (pattern type, start and end dates).
For a list of small patterns (those a few days wide) click this link.
-- Thomas Bulkowski
![]()
$ $ $
I show another slider trading quiz featuring Werner Enterprises: WERN stock.
$ $ $
Here's a symbol list of 125 chart and candlestick patterns (13 "investment grade" candle patterns) found in today's securities using my version of Patternz: DDD, ABT, ACIW, ADTN, ALK, AMED, AEP, AXP, ANIK, AR, AON, ACGL, ARW, BAX, BECN, BIG, BMRN, BRKR, CAL, CPB, CLS, CNP, CDAY, CHS, CTAS, CL, CMTL, ED, COST, COTY, CROX, CCRN, XRAY, DFS, D, EBAY, EXPD, FIVN, FORM, GME, GILD, GFS, GMS, HD, DHI, IDA, IBP, ITGR, TILE, KALU, KMB, KLIC, LH, LEN, LLY, LPLA, LXU, M, MGY, MCHX, MA, MTDR, MTRX, MU, MS, NXGN, NKE, OTEX, PKG, PTEN, PRFT, PCG, PNW, PG, PHM, PSTG, RLI, SAIA, SBH, SKYW, SMAR, SO, SWN, SPSC, SXI, TGT, TDC, TKR, TSCO, TZOO, TREX, TWLO, VRSN, WMT, WSC, XEL, ITB, IEZ, IDU, FXI, IEO, IYF, IHI, EWK, EWQ, EWG, EWH, EWI, EWY, EWD, EWL, EWT, PXJ, PHO, IEV, MXI, XLU, UNG, VAW. Click this link for details (pattern type, start and end dates).
For a list of small patterns (those a few days wide) click this link.
$ $ $
The following table shows where Fibonacci retrace values of the day's high-low range are plus pivot points, calculated on the Dow industrials, sorted by value. When several are near each other (small differences), the area might act as support or resistance.
-- Thomas Bulkowski
![]()
| © 2023 ThePatternSite.com Metric | Value | Diff | Close (within 10% of the high-low range for the day)? |
| Monthly S2 | 30,874.77 | ||
| Monthly S1 | 32,375.09 | 1,500.31 | |
| Monthly Pivot | 33,229.01 | 853.93 | |
| Weekly S2 | 33,516.38 | 287.36 | |
| Daily S2 | 33,665.82 | 149.45 | |
| Weekly S1 | 33,695.89 | 30.07 | |
| Low | 33,726.09 | 30.20 | |
| Daily S1 | 33,770.61 | 44.52 | |
| 61.8% Down from Intraday High | 33,789.14 | 18.54 | |
| Open | 33,805.04 | 15.89 | Yes! The Open is close to the 61.8% Down from Intraday High. |
| 50% Down from Intraday High | 33,808.62 | 3.58 | Yes! The 50% Down from Intraday High is close to the Open. |
| 38.2% Down from Intraday High | 33,828.10 | 19.48 | |
| Daily Pivot | 33,830.88 | 2.78 | Yes! The Daily Pivot is close to the 38.2% Down from Intraday High. |
| Weekly Pivot | 33,857.25 | 26.38 | |
| Close | 33,875.40 | 18.14 | |
| High | 33,891.15 | 15.75 | Yes! The High is close to the Close. |
| Daily R1 | 33,935.67 | 44.52 | |
| Daily R2 | 33,995.94 | 60.27 | |
| Weekly R1 | 34,036.77 | 40.82 | |
| Weekly R2 | 34,198.13 | 161.37 | |
| Monthly R1 | 34,729.33 | 531.20 | |
| Monthly R2 | 35,583.25 | 853.93 |
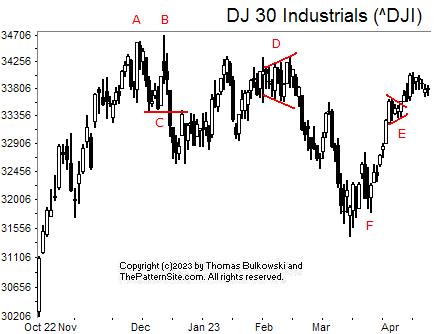
This is the Dow industrials on the daily scale. There's a bit to talk about.
At AB is a double top that confirms as a valid chart pattern when the index closes below the low between the two peaks. That happens at C.
D is another chart pattern called a broadening top.
The pattern at E is a pennant. The idea about flags and pennants is that they appear midway in the price run. The pole begins at F, rises to E, and it's expected that the FE distance will rise to the same distance above E. However, that rarely works, but it does suggest that there's more of a rise to come.
Of course, a part of that rise has already happened. What you see here could be a throwback and the rise could resume upward soon. That happens 65% of the time.
![]()
The following is a brief review of how the markets performed over time. The numbers refer to the close-to-close move in the Dow industrials.
No options expire this week.
![]()
The following is based on an SFO article in December 2004 by John Seekinger, titled, "Take a two-dimensional approach." He offers these tips.
| Index | S2 | S1 | Pivot | R1 | R2 |
| Dow Industrials (^DJI): Daily | 33,615 | 33,712 | 33,785 | 33,882 | 33,956 |
| Weekly | 33,494 | 33,652 | 33,835 | 33,992 | 34,176 |
| Monthly | 30,853 | 32,331 | 33,207 | 34,685 | 35,561 |
| S&P500 (^GSPC): Daily | 4,104 | 4,119 | 4,128 | 4,143 | 4,153 |
| Weekly | 4,083 | 4,108 | 4,139 | 4,164 | 4,195 |
| Monthly | 3,800 | 3,967 | 4,068 | 4,235 | 4,336 |
| Nasdaq (^IXIC): Daily | 11,942 | 12,007 | 12,052 | 12,117 | 12,162 |
| Weekly | 11,843 | 11,958 | 12,102 | 12,216 | 12,360 |
| Monthly | 11,261 | 11,667 | 11,956 | 12,362 | 12,651 |
Here are the formulas:
![]()
Earnings season is either underway or should be starting soon. The sessions could be more volatile.
Here's a symbol list of 144 chart and candlestick patterns (13 "investment grade" candle patterns) found in today's securities using my version of Patternz: ANF, A, ALB, AMED, APH, ANIK, ADP, AVNT, BSET, BECN, BZH, BBBY, BERY, BIG, BR, BRKR, BG, CBT, CPB, CNP, CDAY, CINF, CLNE, CLF, CLX, CTSH, CL, ED, COP, GLW, COST, COTY, CROX, CCRN, CSGS, CTS, DVN, DRQ, EOG, EPAM, EVH, EXPD, FICO, FISV, FTNT, FCX, GFS, GMS, HOLX, DHI, HWM, JBHT, TILE, KALU, KFRC, KMB, LDOS, LLY, LPLA, MHO, M, MRO, MA, MTDR, MRK, MRCY, MLKN, MOS, MUR, MYGN, NOV, NFLX, NTAP, NXGN, NTNX, ASGN, PDCO, PTEN, PRFT, PCG, PG, PSTG, KWR, DGX, RTX, RHI, ROG, ROP, RES, SAIA, SMG, SMTC, SKYW, SMAR, SO, TFX, TPX, TXT, TKR, RIG, TZOO, SLCA, UGI, UIS, UNH, VLO, VMI, VC, WWW, WWD, IYE, ITB, FXI, IGE, IEO, EWK, ECH, EEM, EWH, EWM, EWY, EWL, EWT, THD, TUR, PPA, PJP, MXI, XLP, XLE, XAR, VAW. Click this link for details (pattern type, start and end dates).
For a list of small patterns (those a few days wide) click this link.
The below industries were the best (rank 1) or worst performing of those I follow.
|
-- Thomas Bulkowski
![]()
$ $ $
Here's a symbol list of 140 chart and candlestick patterns (13 "investment grade" candle patterns) found in today's securities using my version of Patternz: ANF, AXDX, AEIS, AJRD, ALB, ALL, AYX, APH, ACGL, ADM, ARW, BECN, BBBY, BIO, CACI, CLS, CNP, CTAS, CSCO, CLX, GLW, COTY, CROX, CCRN, DHR, DDS, DSGR, D, ELV, EME, EPAM, EL, RE, FFIV, FICO, FE, FIVN, FLS, FDP, GME, IT, GD, GFS, GMS, GPRO, HOLX, DHI, HOV, HUM, HURC, IDXX, ITW, INFN, IIIN, IPAR, TILE, JKHY, KBH, KBAL, KMB, KSS, LEN, LMT, LPLA, MHO, MRTN, MA, MDC, MRCY, MLKN, NTGR, NTAP, NJR, NEWR, OMI, PANW, PDCO, PFE, PLXS, PHM, PSTG, RMBS, ROP, R, SAIA, SAIC, SMG, SMAR, LUV, SWX, SPSC, SXI, SUM, SRDX, TDY, TPX, TMO, TKR, TOL, TDG, TRV, TZOO, TWLO, UGI, UPS, VLO, VEEV, V, VC, WSO, WMB, ITB, FXI, IHF, IYZ, EIS, EWM, EWY, EWL, THD, XLP, UNG, USO. Click this link for details (pattern type, start and end dates).
For a list of small patterns (those a few days wide) click this link.
$ $ $
You can find setups based on a Fibonacci retrace by clicking on the link.
The following patterns were found manually, not using Patternz. Mr. Bulkowski has excluded any securities he owns from appearing in the list. However, he may add any of the securities listed to his portfolio at any time, just as you can.
In the table below, the red and green colors are based on the historical breakout direction for the associated chart pattern. If a high and tight flag appears, the start and end dates highlight the flagpole only and not the flag.
For details about the chart patterns, click here.
-- Thomas Bulkowski
![]()
| Symbol | Chart Pattern | Bullish Bearish | Start | End | Industry |
| APD | Ugly double bottom | 03/24/2023 | 04/10/2023 | Chemical (Diversified) | |
| ALK | Ugly double bottom | 03/24/2023 | 04/13/2023 | Air Transport | |
| AA | Rectangle bottom | 03/15/2023 | 04/20/2023 | Aerospace/Defense | |
| AEL | Ugly double bottom | 03/16/2023 | 04/05/2023 | Insurance (Life) | |
| AFG | Pipe bottom | 03/13/2023 | 03/20/2023 | Insurance (Prop/Casualty) | |
| ARW | Pipe top | 03/27/2023 | 04/03/2023 | Electronics | |
| AXS | Double Bottom, Eve and Adam | 03/17/2023 | 03/24/2023 | Insurance (Prop/Casualty) | |
| BECN | Pipe bottom | 04/03/2023 | 04/10/2023 | Retail Building Supply | |
| BRC | Roof | 03/15/2023 | 04/20/2023 | Chemical (Diversified) | |
| CLS | Triangle, symmetrical | 03/03/2023 | 04/19/2023 | Electronics | |
| CNA | Pipe bottom | 03/13/2023 | 03/20/2023 | Insurance (Prop/Casualty) | |
| CTSH | Diamond top | 04/03/2023 | 04/19/2023 | IT Services | |
| CSGP | Rising wedge | 03/16/2023 | 04/19/2023 | Information Services | |
| RE | Pipe bottom | 03/13/2023 | 03/20/2023 | Insurance (Prop/Casualty) | |
| FIS | Double Bottom, Eve and Adam | 03/16/2023 | 03/24/2023 | Computer Software and Svcs | |
| GES | Pipe bottom | 03/20/2023 | 03/27/2023 | Apparel | |
| HOV | Pipe bottom | 03/13/2023 | 03/20/2023 | Homebuilding | |
| INFN | Double Top, Adam and Eve | 03/14/2023 | 03/31/2023 | Telecom. Equipment | |
| IBP | Triple bottom | 03/16/2023 | 04/06/2023 | Retail Building Supply | |
| PODD | Triangle, symmetrical | 03/21/2023 | 04/14/2023 | Medical Supplies | |
| IBKR | Pipe bottom | 03/13/2023 | 03/20/2023 | Securities Brokerage | |
| RAMP | Ugly double bottom | 03/24/2023 | 04/12/2023 | Computer Software and Svcs | |
| LPLA | Pipe bottom | 04/03/2023 | 04/10/2023 | Securities Brokerage | |
| MAN | Head-and-shoulders top | 03/21/2023 | 04/18/2023 | Human Resources | |
| MS | Head-and-shoulders bottom | 03/16/2023 | 04/06/2023 | Securities Brokerage | |
| MOS | Ugly double bottom | 03/24/2023 | 04/06/2023 | Chemical (Diversified) | |
| NTNX | Rectangle bottom | 03/10/2023 | 04/20/2023 | E-Commerce | |
| ORI | Rising wedge | 03/14/2023 | 04/20/2023 | Insurance (Prop/Casualty) | |
| OMCL | Pipe bottom | 03/06/2023 | 03/13/2023 | Healthcare Information | |
| OMC | Double Top, Adam and Adam | 04/04/2023 | 04/18/2023 | Advertising | |
| OUT | Ugly double bottom | 03/24/2023 | 04/10/2023 | Advertising | |
| OXM | Double Bottom, Adam and Adam | 04/10/2023 | 04/13/2023 | Apparel | |
| PG | Pennant | 04/06/2023 | 04/20/2023 | Household Products | |
| QCOM | Head-and-shoulders top | 03/23/2023 | 04/11/2023 | Telecom. Equipment | |
| RJF | Pipe bottom | 03/13/2023 | 03/20/2023 | Securities Brokerage | |
| RTX | Double Bottom, Eve and Adam | 03/13/2023 | 03/24/2023 | Aerospace/Defense | |
| RGA | Double Bottom, Eve and Adam | 03/17/2023 | 03/24/2023 | Insurance (Life) | |
| SCHW | Double Bottom, Adam and Adam | 04/05/2023 | 04/17/2023 | Securities Brokerage | |
| SRE | Ugly double bottom | 03/23/2023 | 04/13/2023 | Electric Utility (West) | |
| TRGP | Pipe bottom | 03/13/2023 | 03/20/2023 | Natural Gas (Diversified) | |
| UIS | Ugly double bottom | 03/24/2023 | 04/10/2023 | Computers and Peripherals | |
| UNM | Pipe bottom | 03/13/2023 | 03/20/2023 | Insurance (Diversified) | |
| VECO | Triangle, symmetrical | 02/16/2023 | 04/03/2023 | Precision Instrument | |
| WEX | Ugly double bottom | 03/24/2023 | 04/06/2023 | Information Services |
![]()
Since I post this the night before, check how the futures are trading before market open. Large moves can affect the opening direction.
$ $ $
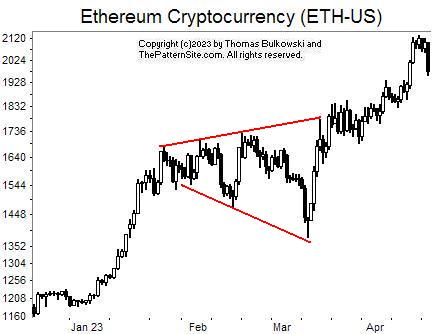
I show a picture of Ethereum on the daily scale.
The partial decline highlighted in my March 23 post was correct in predicting an upward breakout. I show the broadening top chart pattern in red.
Today, (Wednesday) the cryptocurrency dropped almost 6%, which I consider a large drop. There have been other large drops as you can see in the chart. Such a large drop suggests the currency will continue moving lower, at least for a few more days.
Other than that, there's not much happening on the chart.
$ $ $
Here's a symbol list of 175 chart and candlestick patterns (13 "investment grade" candle patterns) found in today's securities using my version of Patternz: ABT, ACIW, AEIS, AJRD, AFL, ALK, ALB, ALGT, AYX, AMZN, AEL, AXP, APH, AON, ARCB, ACGL, ADM, ANET, ARW, AVY, BECN, BBBY, BIG, BSX, BBW, CACI, CAL, CPB, CLS, CX, CNP, CI, CTAS, CSCO, CLF, CMCO, GLW, COST, CROX, CCRN, CSGS, CTS, CW, ^DJT, ELV, EXPI, FIS, FLEX, FLS, GME, GPS, IT, GD, GE, GFS, GMS, GES, HTLD, HSY, HOLX, HOV, HUBG, HUM, JBHT, HUN, HURC, INFN, IIIN, PODD, INTC, TILE, INTU, ISRG, IRM, K, KEYS, KBAL, KMB, KLAC, KLIC, LAMR, LANC, LEN, LMT, LPLA, MHO, MAN, MCHX, MLM, MTRX, MRCY, MU, MLKN, MYGN, NFLX, NTGR, NXGN, OLN, OTEX, OUT, PYPL, PRFT, PFE, PLXS, PEG, KWR, QCOM, DGX, RJF, RGS, ROK, RES, SAIA, SAIC, SMG, SHW, STR, SKYW, SMAR, SWN, SXI, TDY, TFX, TPX, TKR, RIG, TZOO, TREX, UGI, UIS, UPS, VLO, VMI, VC, WSC, ZBRA, QTEC, FXL, FXI, IYZ, SOXX, IEO, EEM, EWM, EWW, EWP, EWT, THD, PEJ, USO, SMH. Click this link for details (pattern type, start and end dates).
For a list of small patterns (those a few days wide) click this link.
$ $ $
The following table shows where Fibonacci retrace values of the day's high-low range are plus pivot points, calculated on the Nasdaq composite, sorted by value. When several are near each other (small differences), the area might act as support or resistance.
-- Thomas Bulkowski
![]()
| © 2023 ThePatternSite.com Metric | Value | Diff | Close (within 10% of the high-low range for the day)? |
| Monthly S2 | 10,544.19 | ||
| Monthly S1 | 11,350.71 | 806.52 | |
| Monthly Pivot | 11,789.32 | 438.61 | |
| Weekly S2 | 11,803.98 | 14.66 | |
| Weekly S1 | 11,980.61 | 176.62 | |
| Daily S2 | 12,005.24 | 24.63 | |
| Low | 12,060.17 | 54.93 | |
| Open | 12,063.68 | 3.51 | Yes! The Open is close to the Low. |
| Daily S1 | 12,081.23 | 17.55 | |
| Weekly Pivot | 12,093.16 | 11.93 | Yes! The Weekly Pivot is close to the Daily S1. |
| 61.8% Down from Intraday High | 12,110.19 | 17.02 | |
| 50% Down from Intraday High | 12,125.63 | 15.45 | |
| Daily Pivot | 12,136.17 | 10.53 | Yes! The Daily Pivot is close to the 50% Down from Intraday High. |
| 38.2% Down from Intraday High | 12,141.08 | 4.92 | Yes! The 38.2% Down from Intraday High is close to the Daily Pivot. |
| Close | 12,157.23 | 16.15 | |
| High | 12,191.10 | 33.87 | |
| Daily R1 | 12,212.16 | 21.06 | |
| Daily R2 | 12,267.10 | 54.93 | |
| Weekly R1 | 12,269.79 | 2.69 | Yes! The Weekly R1 is close to the Daily R2. |
| Weekly R2 | 12,382.34 | 112.56 | |
| Monthly R1 | 12,595.84 | 213.50 | |
| Monthly R2 | 13,034.45 | 438.61 |
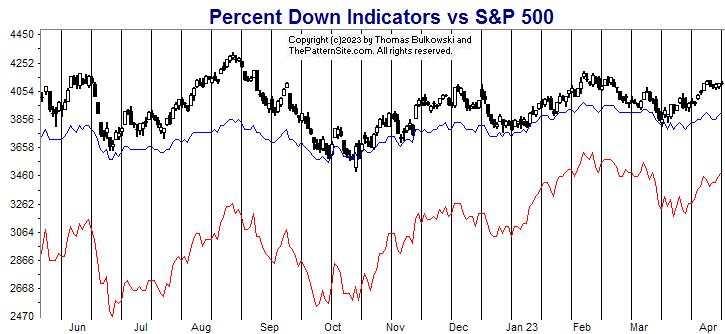
This is a picture of the chart pattern indicator on the daily scale. The indicator is the line chart below a chart of the S&P 500 composite.
The CPI remains bullish and it's a strong signal, too, at 91.3, where 100 is the max. Like I mentioned a week ago, I still believe the uptrend is near an end. We have overhead resistance setup by the prior peak (Feb). I believe we continue to rise only because we're coasting. I expect a downturn before next Wednesday, but that's a huge guess.
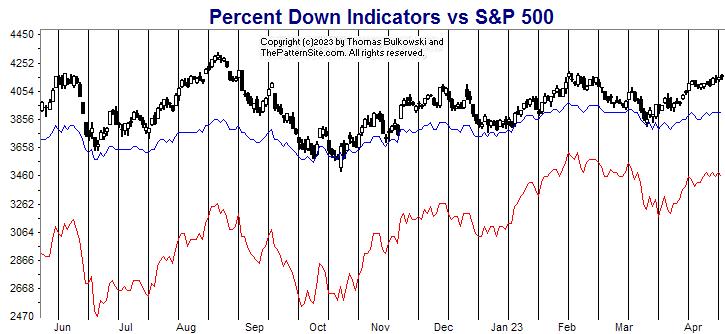
The red line is the percentage of stocks at least 20% below their 1-year high (plotted upside down). The blue line is the average percentage drop of stocks below their 1-year high (plotted upside down).
On Tuesday, 39% of stocks in my database are in bear market territory (down at least 20% from their 1-year high).A week ago, it was 38%.The fewest was 32% on 02/02/2023.And the most was 81% on 06/17/2022.
The 520 stocks in my database are down an average of 19% from their yearly high.A week ago, the average was 20%.The peak was 17% on 02/02/2023.And the bottom was 34% on 09/30/2022.
The lines this week show improvement (blue) and worsening (red). Which line should we believe? I like the red one because it's more sensitive. And I'm a sensitive guy. ![]()
If you look at the chart, they both look flat, and like the prior chart, it suggests a retrace of the uptrend or even a reversal is coming. This might be a buying opportunity and it should last a few weeks to a month or two, I think.
$ $ $
Here's a symbol list of 194 chart and candlestick patterns (13 "investment grade" candle patterns) found in today's securities using my version of Patternz: DDD, ABM, ACIW, AEIS, AJRD, AFL, A, ALB, AA, AYX, AEO, AEP, AEL, AME, ANIK, APA, AAPL, ACGL, ARW, BECN, BBBY, BIO, BKH, BKNG, BBW, CE, CX, CNP, CRL, CHS, CIEN, CTAS, CLF, CLX, CMCO, CONN, COP, GLW, CSGP, CR, CRH, CROX, CCRN, CSGS, D, BOOM, EMN, EFX, RE, EXPI, XOM, EZPW, FIS, FDP, FRD, GE, GNW, GL, GMS, GOOGL, GPRO, GFF, HLIT, HIG, HOLX, HD, HON, HOV, HUBG, HURC, ILMN, INFN, IBP, IIIN, INTC, TILE, IPG, IPI, IRM, KELYA, KEYS, KFRC, KMB, KLIC, LHX, LEG, LEN, LLY, LNC, LMT, L, LOW, LPLA, M, MGY, MAN, MRTN, MRCY, MU, MLKN, MLI, MYGN, NTGR, NJR, NXGN, NOVT, OGE, OLN, OUT, OMI, PCTY, PYPL, PRFT, PFE, PLXS, PINC, PG, PHM, QCOM, DGX, RRC, REGN, ROK, ROP, SAIA, SCHW, SAIC, SMTC, SWN, SXI, TFX, TPX, TMO, TKR, TOL, TSCO, TZOO, TREX, UIS, VLO, VRTX, VC, WSM, WOLF, WDAY, ITB, IHE, IDU, QTEC, FXL, FXI, IYH, IYZ, IHI, EWO, EWC, ECH, EEM, EWJ, EWW, EWP, EWD, TUR, EWU, IBB, PPA, PEJ, PJP, IEV, MXI, XLF, XHB, XLI, XLU, UNG, VHT, VIS. Click this link for details (pattern type, start and end dates).
For a list of small patterns (those a few days wide) click this link.
-- Thomas Bulkowski
![]()
$ $ $
I show another slider trading quiz featuring Williams-Sonoma: WSM stock.
$ $ $
Here's a symbol list of 121 chart and candlestick patterns (13 "investment grade" candle patterns) found in today's securities using my version of Patternz: AXDX, AJRD, AES, AFL, ATSG, AKAM, ABC, AR, APA, APOG, ACGL, ARW, AXS, BSET, BBBY, BIIB, BOOT, BAH, CALM, CPB, CLS, CX, CNP, CF, CHD, CSCO, CLX, CNA, CNX, CXW, CRH, CROX, CCK, CTS, FANG, DFS, BOOM, EQT, FICO, FISV, FLEX, FORM, GME, GE, GNW, HBI, HLIT, HSY, HOLX, HURC, INFN, IIIN, KMB, KLIC, LANC, LEG, LLY, MGY, MANH, MRTN, MYGN, NFG, NCR, NFLX, NXGN, NI, OGE, OUT, PTEN, PYPL, PEN, PXD, PGR, PRU, PHM, QCOM, RRC, RJF, RTX, REGN, RGS, RGA, ROST, ^GSPC, SAIC, SMG, STR, SCS, SUM, TPR, TRGP, TFX, TER, SLCA, UNM, VLO, VECO, VRTX, VC, WWD, WDAY, SLV, IYF, EWM, THD, DBA, PBE, ILF, SSO, XLF, GLD, SPY, UNG, VAW. Click this link for details (pattern type, start and end dates).
For a list of small patterns (those a few days wide) click this link.
$ $ $
The following table shows where Fibonacci retrace values of the day's high-low range are plus pivot points, calculated on the Dow industrials, sorted by value. When several are near each other (small differences), the area might act as support or resistance.
-- Thomas Bulkowski
![]()
| © 2023 ThePatternSite.com Metric | Value | Diff | Close (within 10% of the high-low range for the day)? |
| Monthly S2 | 30,513.53 | ||
| Monthly S1 | 32,250.35 | 1,736.83 | |
| Weekly S2 | 33,065.01 | 814.65 | |
| Monthly Pivot | 33,166.65 | 101.64 | |
| Weekly S1 | 33,526.09 | 359.45 | |
| Daily S2 | 33,730.79 | 204.69 | |
| Low | 33,796.91 | 66.13 | |
| Weekly Pivot | 33,804.52 | 7.61 | Yes! The Weekly Pivot is close to the Low. |
| Daily S1 | 33,858.98 | 54.47 | |
| 61.8% Down from Intraday High | 33,871.14 | 12.16 | Yes! The 61.8% Down from Intraday High is close to the Daily S1. |
| 50% Down from Intraday High | 33,894.07 | 22.93 | |
| 38.2% Down from Intraday High | 33,917.00 | 22.93 | |
| Daily Pivot | 33,925.11 | 8.11 | Yes! The Daily Pivot is close to the 38.2% Down from Intraday High. |
| Open | 33,930.46 | 5.36 | Yes! The Open is close to the Daily Pivot. |
| Close | 33,987.18 | 56.72 | |
| High | 33,991.23 | 4.05 | Yes! The High is close to the Close. |
| Daily R1 | 34,053.30 | 62.07 | |
| Daily R2 | 34,119.43 | 66.12 | |
| Weekly R1 | 34,265.60 | 146.18 | |
| Weekly R2 | 34,544.03 | 278.43 | |
| Monthly R1 | 34,903.47 | 359.45 | |
| Monthly R2 | 35,819.77 | 916.29 |

There's not a lot happening in the Dow transports, which I show on the daily scale.
I highlight a chart pattern that isn't fully developed. It's a potential head-and-shoulders top or perhaps a complex head-and-shoulders top chart pattern.
Those have one or more left shoulders, a head centrally located, and one or more right shoulders.
With complex head-and-shoulders chart patterns, the neckline is typically almost flat. We see that kind of slope on this neckline, so it might be a complex head-and-shoulders top forming.
The right shoulder could use more development (rising higher) and it has to close below the neckline before it becomes a valid head-and-shoulders.
The chart pattern, if verified, is bearish.
$ $ $
I released version 8 of Patternz, my free pattern recognition software. It has about a half dozen more chart patterns implemented and should work better than prior versions. I still have a bug when listing and drawing a chart of the result. The program knows the pattern is there but it can't display it. That's a function of zooming in from the List form. I'd have to redesign the List and List Chart forms to fix it. Other than that, let me know if you find any problems. If you do, please include the data file (quote file) you were using and a screen shot of the setup so I can duplicate it on my computer. Then tell me what's broken. -- Thanks. Tom
![]()
The following is a brief review of how the markets performed over time. The numbers refer to the close-to-close move in the Dow industrials.
Many options expire this week, so traders will be looking to close out their positions, and that suggests increased volatility (large daily price swings).
![]()
The following is based on an SFO article in December 2004 by John Seekinger, titled, "Take a two-dimensional approach." He offers these tips.
| Index | S2 | S1 | Pivot | R1 | R2 |
| Dow Industrials (^DJI): Daily | 33,548 | 33,717 | 33,900 | 34,069 | 34,252 |
| Weekly | 33,031 | 33,459 | 33,771 | 34,198 | 34,510 |
| Monthly | 30,480 | 32,183 | 33,133 | 34,836 | 35,786 |
| S&P500 (^GSPC): Daily | 4,088 | 4,113 | 4,138 | 4,163 | 4,188 |
| Weekly | 4,034 | 4,086 | 4,124 | 4,176 | 4,215 |
| Monthly | 3,682 | 3,910 | 4,037 | 4,264 | 4,391 |
| Nasdaq (^IXIC): Daily | 11,939 | 12,031 | 12,119 | 12,211 | 12,298 |
| Weekly | 11,793 | 11,958 | 12,082 | 12,247 | 12,371 |
| Monthly | 10,533 | 11,328 | 11,778 | 12,573 | 13,023 |
Here are the formulas:
![]()
Earnings season is either underway or should be starting soon. The sessions could be more volatile.
Here's a symbol list of 99 chart and candlestick patterns (13 "investment grade" candle patterns) found in today's securities using my version of Patternz: DDD, AXDX, ADTN, AFL, AFG, AMWD, APH, ARCB, ACGL, ARW, AIZ, AGO, BECN, BZH, BCO, BLDR, CALM, CAL, CNP, CENX, CDAY, CI, CINF, CNO, CNX, CXW, CCK, CSGS, CTS, DFS, BOOM, EBAY, EFX, EZPW, FLEX, FCX, FDP, GME, GIS, GNW, GS, GFF, HBI, THG, HOLX, IIIN, PODD, KBAL, KLIC, LH, LRCX, LANC, MKTX, MLKN, MS, MYGN, NTAP, ASGN, OMI, PATK, PTEN, PGR, QCOM, RLI, R, SIGI, SMTC, SHOP, STR, SMAR, SCS, SSYS, TFX, SLCA, VFC, VLO, VECO, WRB, WERN, WU, WWD, WDAY, BOTZ, IAT, SLV, IYF, EWK, EWC, EWD, MXI, XLF, XHB. Click this link for details (pattern type, start and end dates).
For a list of small patterns (those a few days wide) click this link.
The below industries were the best (rank 1) or worst performing of those I follow.
|
-- Thomas Bulkowski
![]()
$ $ $
Here's a symbol list of 93 chart and candlestick patterns (13 "investment grade" candle patterns) found in today's securities using my version of Patternz: ADBE, AEIS, AJRD, AES, ATSG, AEO, AIG, AR, ATR, ARCB, ARW, ASH, ATO, BECN, BIO, BKNG, CALM, CAL, CX, CNP, CNO, CNX, CONN, CROX, CCK, CTS, ^DJU, D, EXP, EFX, EL, FE, FLEX, FTV, GPS, GILD, GS, GES, HBI, HE, HQY, HL, HOLX, IPAR, KALU, KBAL, KLIC, LZB, MCHX, MS, MYGN, NFG, NEE, POR, PHM, SAIA, SMG, SIGI, SCCO, SNPS, TDY, TFX, UIS, VMC, WERN, WMB, WWD, WDAY, IYE, FXI, BOTZ, ICF, SLV, EWK, EWC, ECH, EWQ, EWG, EIS, EWJ, EWS, EZA, EWY, EWL, DBA, PBE, IEV, XLE, GLD. Click this link for details (pattern type, start and end dates).
For a list of small patterns (those a few days wide) click this link.
$ $ $
You can find setups based on a Fibonacci retrace by clicking on the link.
The following patterns were found manually, not using Patternz. Mr. Bulkowski has excluded any securities he owns from appearing in the list. However, he may add any of the securities listed to his portfolio at any time, just as you can.
In the table below, the red and green colors are based on the historical breakout direction for the associated chart pattern. If a high and tight flag appears, the start and end dates highlight the flagpole only and not the flag.
For details about the chart patterns, click here.
-- Thomas Bulkowski
![]()
| Symbol | Chart Pattern | Bullish Bearish | Start | End | Industry |
| MMM | Triple bottom | 03/15/2023 | 04/10/2023 | Diversified Co. | |
| ADTN | Dead-cat bounce | 04/11/2023 | 04/11/2023 | Telecom. Equipment | |
| A | Head-and-shoulders bottom | 03/02/2023 | 04/10/2023 | Precision Instrument | |
| AMZN | Ugly double bottom | 03/13/2023 | 03/28/2023 | Internet | |
| AMED | Head-and-shoulders bottom | 03/17/2023 | 03/30/2023 | Medical Services | |
| AEP | Double Bottom, Adam and Adam | 03/01/2023 | 03/23/2023 | Electric Utility (Central) | |
| AFG | Double Bottom, Adam and Adam | 03/15/2023 | 03/24/2023 | Insurance (Prop/Casualty) | |
| APOG | Pipe bottom | 03/13/2023 | 03/20/2023 | Building Materials | |
| ARCB | Double Bottom, Adam and Adam | 03/20/2023 | 04/05/2023 | Trucking/Transp. Leasing | |
| AIZ | Pipe bottom | 03/13/2023 | 03/20/2023 | Insurance (Diversified) | |
| AVY | Head-and-shoulders bottom | 03/13/2023 | 03/24/2023 | Packaging and Container | |
| AVNT | Pipe bottom | 03/13/2023 | 03/20/2023 | Chemical (Specialty) | |
| AVA | Triple bottom | 03/01/2023 | 03/24/2023 | Electric Utility (West) | |
| BCPC | Double Bottom, Adam and Adam | 03/24/2023 | 03/31/2023 | Chemical (Specialty) | |
| BECN | Broadening bottom | 03/15/2023 | 04/12/2023 | Retail Building Supply | |
| BKH | Double Bottom, Adam and Adam | 03/10/2023 | 03/23/2023 | Electric Utility (West) | |
| CNP | Triple bottom | 03/01/2023 | 03/23/2023 | Electric Utility (Central) | |
| CF | Pipe bottom | 03/20/2023 | 03/27/2023 | Chemical (Basic) | |
| CRL | Triple bottom | 03/17/2023 | 04/06/2023 | Biotechnology | |
| CLNE | Head-and-shoulders bottom | 03/13/2023 | 04/04/2023 | Natural Gas (Distributor) | |
| CLF | Broadening bottom | 03/21/2023 | 04/12/2023 | Metals and Mining (Div.) | |
| CNA | Double Bottom, Adam and Adam | 03/15/2023 | 03/24/2023 | Insurance (Prop/Casualty) | |
| CNX | Double Bottom, Adam and Adam | 02/22/2023 | 03/15/2023 | Natural Gas (Diversified) | |
| CGNX | Rectangle bottom | 02/21/2023 | 04/13/2023 | Precision Instrument | |
| CMTL | Triangle, symmetrical | 03/13/2023 | 04/04/2023 | Telecom. Equipment | |
| CROX | Ugly double bottom | 03/13/2023 | 03/27/2023 | Shoe | |
| CMI | Broadening bottom | 03/15/2023 | 04/05/2023 | Machinery | |
| DHR | Head-and-shoulders bottom | 03/02/2023 | 03/24/2023 | Medical Services | |
| DFS | Double Bottom, Adam and Adam | 03/16/2023 | 03/24/2023 | Financial Services | |
| D | Broadening bottom | 03/02/2023 | 03/23/2023 | Electric Utility (East) | |
| DOV | Pipe bottom | 03/13/2023 | 03/20/2023 | Machinery | |
| DRQ | Double Bottom, Adam and Adam | 03/16/2023 | 03/24/2023 | Oilfield Svcs/Equipment | |
| DTE | Double Bottom, Adam and Adam | 03/10/2023 | 03/23/2023 | Electric Utility (Central) | |
| DUK | Triple bottom | 03/02/2023 | 03/23/2023 | Electric Utility (East) | |
| ELV | Head-and-shoulders bottom | 03/15/2023 | 03/30/2023 | Medical Services | |
| RE | Double Bottom, Eve and Adam | 03/15/2023 | 03/24/2023 | Insurance (Prop/Casualty) | |
| EVH | Double Bottom, Eve and Adam | 03/15/2023 | 03/24/2023 | Healthcare Information | |
| XOM | Pipe bottom | 03/13/2023 | 03/20/2023 | Petroleum (Integrated) | |
| FFIV | Head-and-shoulders bottom | 02/24/2023 | 03/28/2023 | Internet | |
| FICO | Rectangle top | 02/02/2023 | 04/13/2023 | IT Services | |
| FE | Double Bottom, Adam and Adam | 03/13/2023 | 03/23/2023 | Electric Utility (East) | |
| FLS | Pipe bottom | 03/13/2023 | 03/20/2023 | Machinery | |
| FMC | Three Rising Valleys | 03/16/2023 | 04/06/2023 | Chemical (Basic) | |
| FCX | Head-and-shoulders bottom | 02/24/2023 | 04/05/2023 | Metals and Mining (Div.) | |
| IT | Pipe bottom | 03/13/2023 | 03/20/2023 | IT Services | |
| GMS | Pipe bottom | 03/13/2023 | 03/20/2023 | Cement and Aggregates | |
| GS | Double Bottom, Eve and Adam | 03/16/2023 | 03/24/2023 | Securities Brokerage | |
| THG | Double Bottom, Adam and Adam | 03/17/2023 | 03/24/2023 | Insurance (Prop/Casualty) | |
| HE | Double Bottom, Adam and Adam | 03/13/2023 | 03/24/2023 | Electric Utility (West) | |
| HSIC | Double Bottom, Adam and Eve | 03/02/2023 | 03/13/2023 | Medical Supplies | |
| HOLX | Head-and-shoulders complex bottom | 03/02/2023 | 03/24/2023 | Medical Supplies | |
| HOV | Triangle, descending | 02/07/2023 | 04/13/2023 | Homebuilding | |
| HUM | Triple bottom | 02/07/2023 | 03/29/2023 | Medical Services | |
| HUN | Falling wedge | 03/13/2023 | 04/06/2023 | Chemical (Specialty) | |
| NSP | Double Bottom, Adam and Adam | 03/15/2023 | 03/24/2023 | Human Resources | |
| IBP | Pipe bottom | 03/13/2023 | 03/20/2023 | Retail Building Supply | |
| IIIN | Rectangle bottom | 03/13/2023 | 04/13/2023 | Building Materials | |
| IBKR | Double Bottom, Eve and Adam | 03/15/2023 | 03/24/2023 | Securities Brokerage | |
| KALU | Pipe bottom | 03/13/2023 | 03/20/2023 | Metals and Mining (Div.) | |
| LAMR | Double Bottom, Adam and Adam | 03/16/2023 | 03/24/2023 | Advertising | |
| RAMP | Double Bottom, Eve and Adam | 03/15/2023 | 03/24/2023 | Computer Software and Svcs | |
| MGY | Pipe bottom | 03/13/2023 | 03/20/2023 | Petroleum (Producing) | |
| MRO | Pipe bottom | 03/13/2023 | 03/20/2023 | Petroleum (Integrated) | |
| MCHX | Double Bottom, Eve and Eve | 03/10/2023 | 03/27/2023 | Advertising | |
| MTDR | Double Bottom, Eve and Adam | 03/16/2023 | 03/24/2023 | Petroleum (Producing) | |
| MDT | Triangle, symmetrical | 03/06/2023 | 04/10/2023 | Medical Supplies | |
| MRCY | Ugly double bottom | 03/17/2023 | 04/05/2023 | Computers and Peripherals | |
| MUR | Pipe bottom | 03/13/2023 | 03/20/2023 | Petroleum (Integrated) | |
| NBR | Double Bottom, Adam and Adam | 03/17/2023 | 03/24/2023 | Oilfield Svcs/Equipment | |
| NTAP | Double Bottom, Adam and Adam | 03/15/2023 | 03/24/2023 | Computers and Peripherals | |
| NEE | Head-and-shoulders bottom | 02/09/2023 | 03/23/2023 | Electric Utility (East) | |
| NKE | Three Rising Valleys | 03/13/2023 | 04/06/2023 | Shoe | |
| NOC | Pipe bottom | 03/13/2023 | 03/20/2023 | Aerospace/Defense | |
| OXY | Head-and-shoulders bottom | 02/22/2023 | 03/24/2023 | Petroleum (Producing) | |
| OLN | Double Bottom, Adam and Adam | 03/16/2023 | 03/24/2023 | Chemical (Basic) | |
| OMCL | Ugly double bottom | 03/13/2023 | 03/28/2023 | Healthcare Information | |
| ON | Triangle, symmetrical | 03/02/2023 | 04/13/2023 | Semiconductor | |
| PYPL | Triangle, symmetrical | 03/09/2023 | 04/10/2023 | Financial Services | |
| PKI | Head-and-shoulders bottom | 02/28/2023 | 03/24/2023 | Precision Instrument | |
| PCG | Double Bottom, Adam and Adam | 02/23/2023 | 03/24/2023 | Electric Utility (West) | |
| PNW | Double Bottom, Adam and Adam | 03/13/2023 | 03/23/2023 | Electric Utility (West) | |
| PPL | Double Bottom, Adam and Adam | 03/13/2023 | 03/23/2023 | Electric Utility (East) | |
| PSTG | Head-and-shoulders bottom | 03/02/2023 | 03/24/2023 | Computers and Peripherals | |
| QCOM | Pipe bottom | 03/06/2023 | 03/13/2023 | Telecom. Equipment | |
| RRC | Pipe bottom | 03/13/2023 | 03/20/2023 | Petroleum (Producing) | |
| SBH | Pipe bottom | 03/13/2023 | 03/20/2023 | Toiletries/Cosmetics | |
| SLB | Double Bottom, Adam and Adam | 03/16/2023 | 03/24/2023 | Oilfield Svcs/Equipment | |
| SEIC | Double Bottom, Adam and Adam | 03/20/2023 | 03/24/2023 | IT Services | |
| NOW | Pipe bottom | 03/06/2023 | 03/13/2023 | IT Services | |
| SLGN | Double Bottom, Eve and Adam | 03/16/2023 | 03/24/2023 | Packaging and Container | |
| STR | Pipe bottom | 03/13/2023 | 03/20/2023 | Natural Gas (Diversified) | |
| LUV | Ugly double bottom | 03/24/2023 | 04/05/2023 | Air Transport | |
| SWN | Double Bottom, Adam and Adam | 03/16/2023 | 03/24/2023 | Natural Gas (Diversified) | |
| SR | Triangle, symmetrical | 02/23/2023 | 03/31/2023 | Natural Gas (Distributor) | |
| TECH | Double Bottom, Adam and Adam | 03/13/2023 | 03/24/2023 | Biotechnology | |
| TEVA | Double Bottom, Adam and Adam | 03/20/2023 | 03/24/2023 | Drug | |
| TSCO | Triple bottom | 03/02/2023 | 03/24/2023 | Retail Building Supply | |
| UHAL | Pipe bottom | 03/20/2023 | 03/27/2023 | Trucking/Transp. Leasing | |
| SLCA | Pipe bottom | 03/13/2023 | 03/20/2023 | Metals and Mining (Div.) | |
| UNH | Double Bottom, Eve and Adam | 03/10/2023 | 03/30/2023 | Medical Services | |
| VEEV | Broadening top, right-angled and descending | 02/02/2023 | 03/31/2023 | Healthcare Information | |
| WU | Double Bottom, Adam and Adam | 03/24/2023 | 04/05/2023 | Financial Services | |
| WMB | Double Bottom, Eve and Adam | 03/16/2023 | 03/24/2023 | Natural Gas (Distributor) | |
| WSM | Triangle, symmetrical | 03/09/2023 | 04/13/2023 | Retail (Special Lines) | |
| WSC | Pennant | 04/05/2023 | 04/12/2023 | Industrial Services | |
| XEL | Triple bottom | 03/01/2023 | 03/23/2023 | Electric Utility (West) |
![]()
Since I post this the night before, check how the futures are trading before market open. Large moves can affect the opening direction.
$ $ $
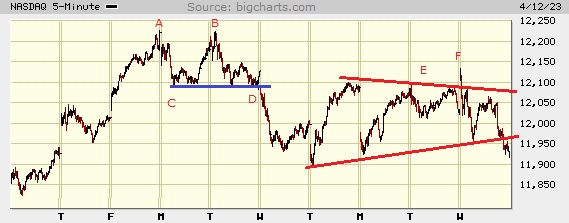
I show a picture of the Nasdaq composite on the 5-minute scale.
At AB, the index forms a double top. It confirms at D when the index closes below blue line C. Notice that the drop after D is extensive, exceeding the measure rule target. That target, generally, is the height of the pattern subtracted from the the low price at C.
After that, we see pattern E, which is a symmetrical triangle. I ignored spike F when drawing the top trendline. Even so, the downward sloping trendline is clear and it's in keeping with the spirit of the pattern. The index has closed below the bottom trendline, suggesting the downward move will continue.
$ $ $
Here's a symbol list of 204 chart and candlestick patterns (13 "investment grade" candle patterns) found in today's securities using my version of Patternz: ACIW, AEIS, AFL, ATSG, ALRM, AA, DOX, AEO, AXP, AME, AMGN, ANIK, AR, ARCB, ACGL, ARW, ATO, ADSK, AVY, AVNT, AVA, BALL, BBBY, BBY, BIG, BSX, BFH, BLDR, CDNS, CALM, CAL, CNP, CENX, CDAY, CRL, CHKP, CTAS, CLF, CLX, CGNX, CTSH, ED, CONN, COP, COST, CR, CCK, CSGS, CTS, DFS, DSGR, ^DJU, D, BOOM, EXP, EBAY, ECL, EOG, EPAM, EFX, FE, FLEX, FTV, GME, GPS, GPN, GGG, HBI, THG, HE, HAYN, HQY, HELE, HSIC, HD, HOV, HUBG, HUN, PODD, TILE, IPI, NVTA, JAZZ, LZB, LAMR, LLY, LOW, MGY, MAN, MRO, MA, MDC, MRK, MRCY, MU, NCR, NTGR, NWL, NEU, NI, JWN, NUS, NTNX, OMI, OXM, PTEN, PAYX, PEN, PRFT, PETS, PCG, POR, PPG, PPL, PSTG, QTWO, DGX, RTX, RHI, ROP, ROST, RES, SAIC, SMG, SWN, SNPS, TECH, TDOC, TFX, TTD, TSCO, TZOO, TG, TWLO, UIS, UPS, VFC, VRTX, WMT, WU, WLK, WSM, WOLF, WWD, WDAY, IYM, IYK, IYC, FXI, BOTZ, ICF, IHF, IAT, IYZ, IEO, EWA, EWO, EWZ, EWC, ECH, EWQ, EWG, EWH, EWI, EWD, EWL, EWU, PBE, PEJ, IEV, ILF, MXI, XLY, XRT, USO. Click this link for details (pattern type, start and end dates).
For a list of small patterns (those a few days wide) click this link.
$ $ $
The following table shows where Fibonacci retrace values of the day's high-low range are plus pivot points, calculated on the Nasdaq composite, sorted by value. When several are near each other (small differences), the area might act as support or resistance.
-- Thomas Bulkowski
![]()
| © 2023 ThePatternSite.com Metric | Value | Diff | Close (within 10% of the high-low range for the day)? |
| Monthly S2 | 10,468.23 | ||
| Monthly S1 | 11,198.78 | 730.56 | |
| Weekly S2 | 11,691.14 | 492.36 | |
| Monthly Pivot | 11,713.36 | 22.22 | |
| Daily S2 | 11,775.50 | 62.14 | |
| Weekly S1 | 11,810.24 | 34.74 | |
| Daily S1 | 11,852.42 | 42.18 | |
| Low | 11,916.54 | 64.12 | |
| Close | 11,929.34 | 12.80 | Yes! The Close is close to the Low. |
| Daily Pivot | 11,993.46 | 64.12 | |
| 61.8% Down from Intraday High | 11,999.80 | 6.34 | Yes! The 61.8% Down from Intraday High is close to the Daily Pivot. |
| Weekly Pivot | 12,017.46 | 17.66 | Yes! The Weekly Pivot is close to the 61.8% Down from Intraday High. |
| 50% Down from Intraday High | 12,025.52 | 8.06 | Yes! The 50% Down from Intraday High is close to the Weekly Pivot. |
| 38.2% Down from Intraday High | 12,051.24 | 25.72 | |
| Daily R1 | 12,070.38 | 19.14 | Yes! The Daily R1 is close to the 38.2% Down from Intraday High. |
| Open | 12,110.87 | 40.49 | |
| High | 12,134.50 | 23.63 | |
| Weekly R1 | 12,136.56 | 2.06 | Yes! The Weekly R1 is close to the High. |
| Daily R2 | 12,211.42 | 74.86 | |
| Weekly R2 | 12,343.78 | 132.36 | |
| Monthly R1 | 12,443.91 | 100.13 | |
| Monthly R2 | 12,958.49 | 514.57 |
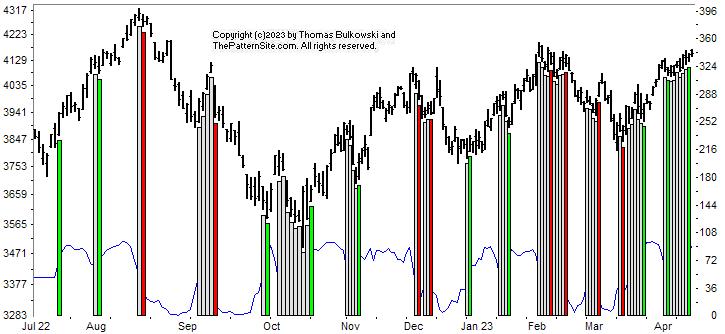
This is a picture of the chart pattern indicator on the daily scale. The indicator is the line chart below a chart of the S&P 500 composite.
The most recent signal is bullish, shown on the chart with the vertical green bar on the far right of the chart. It's been there for four days, so it's probably solid (meaning it won't disappear) unless we get a huge market move (large rise or drop). Signals can change for up to a week but are usually solid after three days.
The thin blue CPI line (near chart bottom) shows it dipping lower today (Tuesday, after the close) and that's a sign of weakness. I don't know how strong that signal is.
Based on what we see on the chart, the next signal will be bearish (two green bars precede a bearish signal. You can see that in July to August 2022, Jan to Feb 2023, but three green bars in Oct to Nov 2022. However the Oct-Nov period is where price is at the bottom of the chart, rising. The other two areas are approaching a top).
So this chart is bullish but hints of a coming reversal.
The red line is the percentage of stocks at least 20% below their 1-year high (plotted upside down). The blue line is the average percentage drop of stocks below their 1-year high (plotted upside down).
On Tuesday, 38% of stocks in my database are in bear market territory (down at least 20% from their 1-year high).A week ago, it was 40%.The fewest was 32% on 02/02/2023.And the most was 81% on 06/17/2022.
The 520 stocks in my database are down an average of 20% from their yearly high.A week ago, the average was 20%.The peak was 17% on 02/02/2023.And the bottom was 34% on 09/30/2022.
The red line is marginally better than it was a week ago, but the blue line is flat. The red line continues to recover from the February to March dip. However, the price chart doesn't show such a robust recovery.
If you're an Elliott waver, you can count from the October low, five waves (up, retrace, rinse, repeat). It also suggests weakness. After wave 5, we can see an extension or a correction, so who knows?
Taken together, the warnings are subtle but present, I think. In the next two to four weeks, we might see a significant reversal begin. That's a guess, of course.
$ $ $
Here's a symbol list of 193 chart and candlestick patterns (13 "investment grade" candle patterns) found in today's securities using my version of Patternz: ADTN, AEIS, AJRD, AFL, APD, AKAM, ALB, AMED, AXP, AFG, AMWD, AMN, AAPL, AWI, ARW, AGO, AZTA, BAX, BECN, BIG, BRC, BRKR, CALM, CAL, CPB, CE, CNA, CGNX, CMCO, CMTL, ED, CONN, CXW, COTY, CROX, CCRN, CCK, CSGS, CTS, CW, DHR, XRAY, DFS, DSGR, DOV, BOOM, EXP, EMN, ECL, ELV, RE, EXPI, FARO, FIS, FE, FISV, FLEX, FLS, FTV, FCX, FDP, GNW, GL, GMS, GPRO, GGG, GFF, GES, HBI, HSC, HL, DHI, HOV, HWM, HUM, IEX, IDXX, ITW, ILMN, INFN, IBP, IIIN, IPAR, ISRG, IRM, KMT, LEG, LNC, MHO, MCHX, MRTN, MLM, MAS, MTRX, MDT, META, MLI, NCR, NWL, NEU, JWN, NOC, OMCL, ASGN, OMI, PKG, PATK, PDCO, PYPL, PCG, PLXS, PHM, KWR, RL, RMBS, RJF, RTX, RHI, ROK, ROL, ROST, RES, R, SAIA, SMG, SHW, SCCO, LUV, SUM, TPX, TEVA, TMO, TKR, SLCA, VFC, VRTX, V, VC, WMT, WSO, WERN, WU, WSM, WWD, WDAY, XEL, ITA, DDM, IYH, IHF, IYF, IHI, EWA, EWO, EWK, EWC, EEM, EWQ, EWH, EPP, EWY, EWD, EWU, IBB, DBA, PEJ, PHO, IEV, XLF, XLV, XHB, XLI, XLB, XAR, VHT, VIS. Click this link for details (pattern type, start and end dates).
For a list of small patterns (those a few days wide) click this link.
-- Thomas Bulkowski
![]()
$ $ $
I show another slider trading quiz featuring Wolverine World Wide: WWW stock.
$ $ $
Here's a symbol list of 106 chart and candlestick patterns (13 "investment grade" candle patterns) found in today's securities using my version of Patternz: AEIS, AFL, ALK, AMED, AFG, AMGN, AMN, ADM, AIZ, ATO, AXS, BMI, BECN, BZH, BKH, BCO, CX, CNC, CENX, CF, CHS, CLNE, CLF, CLX, CGNX, CTSH, GLW, CRH, CCRN, CW, XRAY, EXP, EME, EQT, EL, EVH, EXC, FARO, FLS, GPS, GES, HTLD, HL, HWM, IIIN, ISRG, NVTA, KALU, KEYS, KFRC, KLIC, LHX, LZB, LAMR, LXU, MAN, MCHX, MTRX, NCR, NJR, JWN, ASGN, PTEN, PCG, PSTG, DGX, RNG, RLI, ROG, SCHW, SAIC, SMG, SEIC, SLGN, STR, SCCO, LUV, TTD, TMO, TSCO, UHAL, UGI, IYM, IHF, EWG, EWI, EWJ, TUR, PPA, PEJ, PHO, XLI, XRT, UNG, VAW. Click this link for details (pattern type, start and end dates).
For a list of small patterns (those a few days wide) click this link.
$ $ $
The following table shows where Fibonacci retrace values of the day's high-low range are plus pivot points, calculated on the Dow industrials, sorted by value. When several are near each other (small differences), the area might act as support or resistance.
-- Thomas Bulkowski
![]()
| © 2023 ThePatternSite.com Metric | Value | Diff | Close (within 10% of the high-low range for the day)? |
| Monthly S2 | 30,678.79 | ||
| Monthly S1 | 32,132.65 | 1,453.87 | |
| Monthly Pivot | 32,883.69 | 751.03 | |
| Weekly S2 | 33,100.07 | 216.38 | |
| Daily S2 | 33,259.92 | 159.86 | |
| Weekly S1 | 33,343.29 | 83.37 | |
| Low | 33,343.43 | 0.14 | Yes! The Low is close to the Weekly S1. |
| Daily S1 | 33,423.22 | 79.79 | |
| Open | 33,425.25 | 2.03 | Yes! The Open is close to the Daily S1. |
| 61.8% Down from Intraday High | 33,437.71 | 12.46 | Yes! The 61.8% Down from Intraday High is close to the Open. |
| 50% Down from Intraday High | 33,466.84 | 29.13 | |
| Weekly Pivot | 33,489.01 | 22.17 | Yes! The Weekly Pivot is close to the 50% Down from Intraday High. |
| 38.2% Down from Intraday High | 33,495.96 | 6.95 | Yes! The 38.2% Down from Intraday High is close to the Weekly Pivot. |
| Daily Pivot | 33,506.73 | 10.77 | Yes! The Daily Pivot is close to the 38.2% Down from Intraday High. |
| Close | 33,586.52 | 79.79 | |
| High | 33,590.24 | 3.72 | Yes! The High is close to the Close. |
| Daily R1 | 33,670.03 | 79.79 | |
| Weekly R1 | 33,732.23 | 62.20 | |
| Daily R2 | 33,753.54 | 21.30 | Yes! The Daily R2 is close to the Weekly R1. |
| Weekly R2 | 33,877.95 | 124.41 | |
| Monthly R1 | 34,337.55 | 459.61 | |
| Monthly R2 | 35,088.59 | 751.03 |
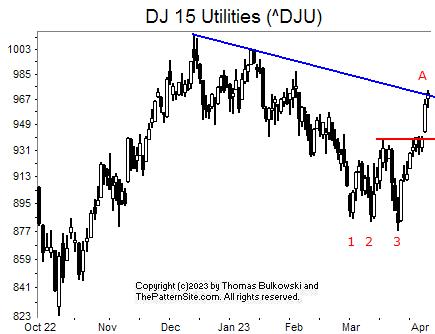
I show the Dow utilities on the daily chart.
One pattern jumps out and that's the triple bottom, which I highlight on the chart as 1, 2, and 3. The pattern confirms as a valid chart pattern when the index closes above the highest peak between the three bottoms. That's the horizontal red line.
I also drew a blue trendline connecting the recent chart peaks and today's price, at A.
If I were wanting to buy the index (an ETF based on it, really), I'd wait. I've seen these trendlines put up overhead resistance that a stock struggles to break though. I don't know if that's the case with an index, but I wouldn't take the chance.
So I'm looking for the utility index to drop this week.
![]()
The following is a brief review of how the markets performed over time. The numbers refer to the close-to-close move in the Dow industrials.
No options expire this week.
![]()
The following is based on an SFO article in December 2004 by John Seekinger, titled, "Take a two-dimensional approach." He offers these tips.
| Index | S2 | S1 | Pivot | R1 | R2 |
| Dow Industrials (^DJI): Daily | 33,245 | 33,365 | 33,446 | 33,566 | 33,646 |
| Weekly | 32,003 | 32,744 | 33,018 | 33,759 | 34,032 |
| Monthly | 30,687 | 32,086 | 32,829 | 34,228 | 34,972 |
| S&P500 (^GSPC): Daily | 4,057 | 4,081 | 4,094 | 4,118 | 4,132 |
| Weekly | 3,897 | 4,001 | 4,056 | 4,160 | 4,215 |
| Monthly | 3,706 | 3,906 | 4,008 | 4,208 | 4,310 |
| Nasdaq (^IXIC): Daily | 11,828 | 11,958 | 12,028 | 12,158 | 12,228 |
| Weekly | 11,391 | 11,739 | 11,984 | 12,332 | 12,577 |
| Monthly | 10,521 | 11,305 | 11,766 | 12,550 | 13,011 |
Here are the formulas:
![]()
Earnings season will be starting in about 7 days.
Here's a symbol list of 112 chart and candlestick patterns (13 "investment grade" candle patterns) found in today's securities using my version of Patternz: DDD, AXDX, ALB, AIG, ACGL, ADM, ARW, BECN, BBY, BOOT, BSX, BR, BRKR, BLDR, CPB, CF, ED, CRH, CCRN, DHR, XRAY, DFS, BOOM, EXP, EL, EZPW, FDX, GPS, GMS, GES, HAYN, HL, HP, HURC, IDXX, INFN, TILE, IPI, INTU, NVTA, LNC, MHO, MCHX, MTRX, MDC, META, MSFT, MLKN, MUR, ^IXIC, NFG, NJR, NI, JWN, ORI, OMC, PATK, PTEN, PCG, POR, PG, RNG, RES, ^GSPC, SBH, SHW, SUM, TPR, TDOC, TFX, TPX, TEVA, TMO, TKR, UHAL, VRTX, WAT, WEX, WMB, WSC, WWD, IHE, IDU, ICF, IGE, IEO, EWK, EWQ, EWI, EWJ, EWS, EWP, EWL, EWU, QLD, PXJ, IXC, SSO, SPY, MGK. Click this link for details (pattern type, start and end dates).
For a list of small patterns (those a few days wide) click this link.
The below industries were the best (rank 1) or worst performing of those I follow.
|
-- Thomas Bulkowski
![]()
Since I post this the night before, check how the futures are trading before market open. Large moves can affect the opening direction.
$ $ $
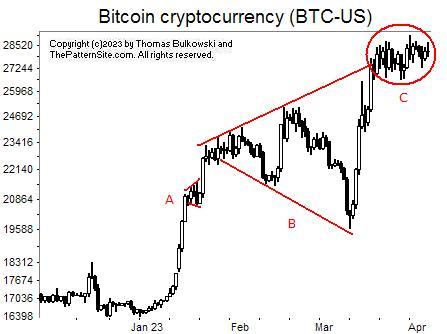
I show a picture of bitcoin (BTC-USD) on the daily scale.
On the chart two patterns and one anomaly appear. The first, A, caught my attention because I'm struggling with Patternz to teach it how to find flags. This isn't a flag but a cousin: pennant. A flag has a retrace that looks like two parallel lines. Pennants are everything else, really, except that both need to be at the end of a flagpole. The flagpole to his one began min mid January. That's when price went vertical.
At B, we see a nicely formed broadening top. Those patterns have peaks which follow an upward trend and valleys which follow a downward trend, so that the two trendlines highlighting those trends diverge.
I once read somewhere that a congestion region that appears near the breakout suggests a strong move. I was not able to prove that theory worked. I think C is an example of the type of congestion region they were talking about although this one is long.
$ $ $
Here's a symbol list of 202 chart and candlestick patterns (13 "investment grade" candle patterns) found in today's securities using my version of Patternz: DDD, ANF, ACN, AMD, AJRD, AES, ALB, ALKS, ALL, AMZN, AEE, AEP, ABC, AME, AMGN, APH, APA, AMAT, AWI, ATO, ADSK, AXS, BMI, BECN, BBY, BIG, BKH, BKNG, BOOT, CPB, CNP, CF, CHKP, CHS, CLF, CTSH, ED, CXW, COTY, CRH, DHR, DDS, ^DJU, D, DUK, EXP, EME, EPAM, EL, EZPW, FDS, FAST, FDX, FIS, FE, FORM, GPS, GE, GNW, GS, GES, THG, HLIT, HSC, HAYN, HL, HELE, HSY, HNI, HOV, HUBG, IDA, ITW, IBP, IIIN, TILE, NVTA, JBLU, JNJ, KMT, KEYS, KBAL, KLAC, LZB, LH, LRCX, LAMR, LLY, RAMP, MHO, MRO, MTRX, MRK, MCO, MS, NBR, ^IXIC, NTAP, NJR, NWL, NEU, NEE, NI, JWN, NOC, NOVT, NVDA, OLN, ASGN, PKG, PATK, PKI, PFE, PNW, PLXS, POR, PPL, PG, PGR, RL, RGA, RNG, ROK, RES, ^GSPC, SAIA, SCHW, SEE, SRE, SO, SR, SNPS, TRGP, TECH, TER, TXN, TXT, RIG, UHAL, UGI, UPS, UNH, VRSN, VRTX, WMT, WSO, WEX, WSM, WOLF, WWW, WDAY, XEL, IYM, IYC, ITB, IEZ, IHE, IDU, FTEC, FXL, BOTZ, SOXX, EWH, EWS, EWL, PBE, ROBO, ILF, SSO, XLF, XHB, XLI, XRT, SPY, XAR, XLK, XLU, SMH, VIS. Click this link for details (pattern type, start and end dates).
For a list of small patterns (those a few days wide) click this link.
$ $ $
The following table shows where Fibonacci retrace values of the day's high-low range are plus pivot points, calculated on the Nasdaq composite, sorted by value. When several are near each other (small differences), the area might act as support or resistance.
-- Thomas Bulkowski
![]()
| © 2023 ThePatternSite.com Metric | Value | Diff | Close (within 10% of the high-low range for the day)? |
| Monthly S2 | 10,490.73 | ||
| Monthly S1 | 11,243.80 | 753.06 | |
| Weekly S2 | 11,360.37 | 116.58 | |
| Weekly S1 | 11,678.62 | 318.24 | |
| Monthly Pivot | 11,735.86 | 57.25 | |
| Daily S2 | 11,850.25 | 114.39 | |
| Daily S1 | 11,923.56 | 73.30 | |
| Low | 11,931.85 | 8.29 | Yes! The Low is close to the Daily S1. |
| Weekly Pivot | 11,953.27 | 21.42 | |
| 61.8% Down from Intraday High | 11,991.02 | 37.75 | |
| Close | 11,996.86 | 5.84 | Yes! The Close is close to the 61.8% Down from Intraday High. |
| Daily Pivot | 12,005.15 | 8.29 | Yes! The Daily Pivot is close to the Close. |
| 50% Down from Intraday High | 12,009.30 | 4.15 | Yes! The 50% Down from Intraday High is close to the Daily Pivot. |
| 38.2% Down from Intraday High | 12,027.58 | 18.28 | |
| Daily R1 | 12,078.46 | 50.88 | |
| Open | 12,081.76 | 3.30 | Yes! The Open is close to the Daily R1. |
| High | 12,086.75 | 4.99 | Yes! The High is close to the Open. |
| Daily R2 | 12,160.05 | 73.30 | |
| Weekly R1 | 12,271.52 | 111.46 | |
| Monthly R1 | 12,488.93 | 217.41 | |
| Weekly R2 | 12,546.17 | 57.25 | |
| Monthly R2 | 12,980.99 | 434.82 |
Here's the updated 2023 forecast, presented in slider format.
$ $ $
Based on sector performance from Fidelity, the best performing sectors for year-to-date performance as of 4/3/2023 were... (The numbering is how they ranked a month ago.)
The folks at two firms polled by Fidelity weigh the sectors in this order, as of 3/31/23.
Here's how they rank the industries, but only the top 10 appear. One-year change, as of 4/3/23. The numbering is how they ranked a month ago.
$ $ $
Here's a symbol list of 265 chart and candlestick patterns (13 "investment grade" candle patterns) found in today's securities using my version of Patternz: DDD, MMM, ABT, ANF, ABM, AYI, AFL, ALB, AA, AFG, AMWD, AMN, APA, AMAT, ACGL, AWI, ARW, ADSK, ADP, AVY, AXS, BMI, BCPC, BZH, BBY, BKNG, BRC, BCO, BMY, BG, CALM, CPB, CE, CX, CF, CHKP, CVX, CHS, CINF, CLNE, CNA, CTSH, CL, CMCO, CMTL, ED, CXW, COTY, CR, CCRN, CCK, CW, DHR, FANG, DDS, DOV, BOOM, EXP, ECL, EME, EOG, EPAM, EL, EVH, FDS, FAST, FDX, FISV, FIVN, FLEX, FORM, FDP, FRD, GPS, GE, GPN, GMS, GS, GES, THG, HSC, HIG, HAYN, HL, HELE, HP, HNI, HOLX, HOV, HURC, IEX, ITW, NSP, IBP, IIIN, INTC, TILE, NVTA, JBLU, KALU, KELYA, KMT, KEYS, KBAL, KLAC, LZB, LAMR, LEN, L, LPLA, MHO, MTSI, MGY, MAN, MRO, MCHX, MRTN, MLM, MAS, MTDR, MTRX, MSFT, MLKN, MCO, MUR, NBR, NTAP, NJR, NWL, NKE, JWN, NVDA, ASGN, OXM, PDCO, PAYX, PETS, PFG, PG, DGX, RL, RJF, RTX, RGS, RGA, RNG, ROK, ROP, RES, SAIA, SLB, NOW, SLGN, SKYW, SCCO, SXI, SSYS, SUM, SNPS, TDY, TPX, TER, TXT, RIG, TRV, TG, TREX, UHAL, SLCA, UPS, UNM, VRSN, VRTX, WRB, WSO, WEX, WSM, WSC, WWW, WDAY, IYM, IYC, IYE, ITB, IEZ, IHE, IDU, FTEC, FXL, BOTZ, IYH, IGE, IEO, EWK, EWG, EWI, EWS, EZA, EWP, EWD, PPA, PBE, ROBO, IXC, ILF, SSO, XLE, XLF, XHB, XLI, XRT, SPY, XAR, XLK, XLU, VIS, VAW. Click this link for details (pattern type, start and end dates).
For a list of small patterns (those a few days wide) click this link.
-- Thomas Bulkowski
![]()
$ $ $
I show another slider trading quiz featuring WM Wrigley: WWY stock.
$ $ $
Here's a symbol list of 188 chart and candlestick patterns (13 "investment grade" candle patterns) found in today's securities using my version of Patternz: ACIW, AJRD, ALB, AA, ALL, AFG, APA, APOG, ACGL, ADM, AIZ, AVNT, BAX, BBBY, BA, BCO, BLDR, CBT, CACI, CAL, CPB, CX, CNC, CVX, CHS, CINF, CNA, CNO, CAG, COP, CCRN, XRAY, DVN, FANG, D, DOV, DRQ, ELV, EOG, EQT, RE, EVH, XOM, FICO, FDX, FLS, GPS, IT, GFS, GL, GMS, GS, GFF, HIG, HQY, HL, HP, DHI, HOV, HWM, HUM, ILMN, IBP, IIIN, IBKR, TILE, KALU, LAMR, LEG, LEN, L, LOW, LPLA, MGY, MRO, MCHX, MLM, MTDR, MRCY, MGEE, MU, MUR, MYGN, NBR, NOV, NI, NOC, OXY, OLN, PTEN, PXD, PPG, PFG, PGR, PHM, RRC, RJF, RTX, RGS, RGA, ROK, SAIA, SBH, SLB, STR, SKYW, SCCO, SR, SUM, SRDX, TRGP, TPX, TEVA, TXT, RIG, TRV, SLCA, UIS, UNM, VECO, WLK, WSC, WWW, IYE, IEZ, IHE, DDM, IHF, IAT, SLV, IGE, IEO, EWA, EWO, EWK, EWC, ECH, EEM, EWG, EWH, EIS, EWI, EWM, EWW, EPP, EWS, TUR, EWU, PXJ, IEV, IXC, XLE, GLD, USO. Click this link for details (pattern type, start and end dates).
For a list of small patterns (those a few days wide) click this link.
$ $ $
The following table shows where Fibonacci retrace values of the day's high-low range are plus pivot points, calculated on the Dow industrials, sorted by value. When several are near each other (small differences), the area might act as support or resistance.
-- Thomas Bulkowski
![]()
| © 2023 ThePatternSite.com Metric | Value | Diff | Close (within 10% of the high-low range for the day)? |
| Monthly S2 | 30,725.33 | ||
| Weekly S2 | 32,042.01 | 1,316.68 | |
| Monthly S1 | 32,163.24 | 121.23 | |
| Weekly S1 | 32,821.58 | 658.34 | |
| Monthly Pivot | 32,867.73 | 46.15 | |
| Weekly Pivot | 33,056.29 | 188.56 | |
| Daily S2 | 33,106.16 | 49.87 | |
| Low | 33,245.78 | 139.63 | |
| Open | 33,245.78 | 0.00 | Yes! The Open is close to the Low. |
| Daily S1 | 33,353.65 | 107.87 | |
| 61.8% Down from Intraday High | 33,393.66 | 40.01 | |
| 50% Down from Intraday High | 33,439.34 | 45.68 | |
| 38.2% Down from Intraday High | 33,485.02 | 45.68 | |
| Daily Pivot | 33,493.28 | 8.26 | Yes! The Daily Pivot is close to the 38.2% Down from Intraday High. |
| Close | 33,601.15 | 107.87 | |
| High | 33,632.90 | 31.75 | Yes! The High is close to the Close. |
| Daily R1 | 33,740.77 | 107.88 | |
| Weekly R1 | 33,835.86 | 95.09 | |
| Daily R2 | 33,880.40 | 44.54 | |
| Weekly R2 | 34,070.57 | 190.17 | |
| Monthly R1 | 34,305.64 | 235.07 | |
| Monthly R2 | 35,010.13 | 704.49 |
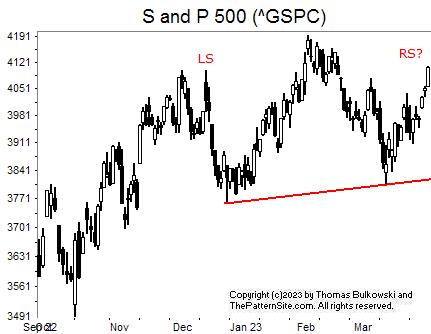
This is a picture of the S&P 500 index on the daily scale.
Not much is happening except for the potential drop. That's highlighted by a chart pattern called a head-and-shoulders top. I highlight the left shoulder (LS), a potential right shoulder (RS?) and a head straddling the two shoulders.
Before the squiggles can become a valid head-and-shoulders top, the index has to close below the red neckline. If that were to happen, it would represent a significant drop and that's just a start.
Worst case, the index could drop below the red line by the height of the pattern, and perhaps more.
Of course, none of this might happen. The index could continue rising but it would have to push through overhead resistance and it has already made a good move upward. That sets the stage for a downward retrace in my opinion.
![]()
The following is a brief review of how the markets performed over time. The numbers refer to the close-to-close move in the Dow industrials.
No options expire this week.
![]()
The following is based on an SFO article in December 2004 by John Seekinger, titled, "Take a two-dimensional approach." He offers these tips.
| Index | S2 | S1 | Pivot | R1 | R2 |
| Dow Industrials (^DJI): Daily | 32,767 | 33,020 | 33,156 | 33,409 | 33,545 |
| Weekly | 31,933 | 32,604 | 32,947 | 33,618 | 33,962 |
| Monthly | 30,616 | 31,945 | 32,759 | 34,088 | 34,901 |
| S&P500 (^GSPC): Daily | 4,038 | 4,073 | 4,092 | 4,128 | 4,147 |
| Weekly | 3,898 | 4,004 | 4,057 | 4,163 | 4,216 |
| Monthly | 3,708 | 3,909 | 4,010 | 4,210 | 4,312 |
| Nasdaq (^IXIC): Daily | 11,963 | 12,092 | 12,160 | 12,290 | 12,358 |
| Weekly | 11,435 | 11,829 | 12,028 | 12,422 | 12,621 |
| Monthly | 10,566 | 11,394 | 11,811 | 12,639 | 13,056 |
Here are the formulas:
![]()
Earnings season is over.
Here's a symbol list of 182 chart and candlestick patterns (13 "investment grade" candle patterns) found in today's securities using my version of Patternz: ABT, AXDX, AEIS, AMD, AJRD, ALB, ALKS, AFG, AIG, APH, APA, APOG, ACGL, AIZ, AVNT, BZH, BBBY, BIO, BSX, BCO, BR, CBT, CX, CNC, CHS, CHD, CINF, CNA, CNO, ED, COP, CRH, CROX, XRAY, DSGR, DOV, EOG, EPAM, RE, EXPD, XOM, FICO, FLEX, FLS, FTV, GME, IT, GFS, GL, GMS, GS, GFF, THG, HIG, HQY, HL, HSII, HD, HOV, HUM, ILMN, INFN, IBP, IIIN, IBKR, TILE, IPG, KALU, KMB, KLIC, LH, LAMR, LEG, L, LPLA, LXU, MGY, MRO, MCHX, MLM, MRCY, MSFT, MUR, NEU, NOC, NUS, OLN, OMC, OUT, OMI, PKG, PKE, PEN, PXD, PFG, PG, PGR, PSTG, DGX, RRC, RJF, RGS, RGA, ROK, SBH, SCI, SHOP, STR, SKYW, SCCO, SWN, SR, SRDX, TRGP, TDY, TPX, TZOO, TG, SLCA, UIS, UNM, VLO, VRSN, WAT, WERN, WLK, WWD, ZBRA, IYM, IYK, IYC, IHE, DDM, ICF, IAT, SLV, IEO, IHI, EWA, EWK, ECH, EIS, EWI, EWJ, EWW, EWY, EWP, EWD, EWL, PPA, PEJ, PJP, IEV, SSO, MXI, XLP, XLE, XLV, SPY, USO, VHT, VIS, MGK. Click this link for details (pattern type, start and end dates).
For a list of small patterns (those a few days wide) click this link.
The below industries were the best (rank 1) or worst performing of those I follow.
|
-- Thomas Bulkowski
![]()
Support this site! Clicking any of the books (below) takes you to
Amazon.com If you buy ANYTHING while there, they pay for the referral.
Legal notice for paid links: "As an Amazon Associate I earn from qualifying purchases."
|
My Stock Market Books
|
My Novels
Orb Foresight Rewrite Coming!
|