
As of 04/16/2026
Indus: 48,579 +115.00 +0.2%
Trans: 21,813 +865.04 +4.1%
Utils: 1,165 +7.98 +0.7%
Nasdaq: 24,103 +86.68 +0.4%
S&P 500: 7,041 +18.33 +0.3%
|
YTD
+1.1%
+25.7%
+9.1%
+3.7%
+2.9%
|
|
As of 04/16/2026
Indus: 48,579 +115.00 +0.2%
Trans: 21,813 +865.04 +4.1%
Utils: 1,165 +7.98 +0.7%
Nasdaq: 24,103 +86.68 +0.4%
S&P 500: 7,041 +18.33 +0.3%
|
YTD
+1.1%
+25.7%
+9.1%
+3.7%
+2.9%
| |
|
| ||
This is a picture of the chart pattern indicator on the daily scale. The indicator is the line chart below a chart of the S&P 500 composite.
The CPI is bearish and it's been that way for about two weeks and yet price has climbed over that time (in the index).
It suggests the index will turn lower, but I'm not so sure. If congress raises the debt ceiling, I think we'll get a lift. Of course, if congress doesn't do their job, then the index could tumble.
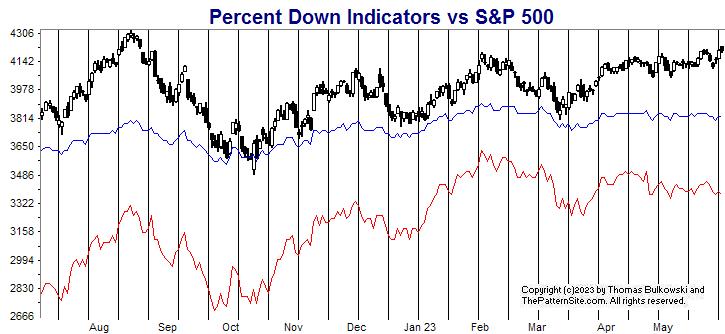
The red line is the percentage of stocks at least 20% below their 1-year high (plotted upside down). The blue line is the average percentage drop of stocks below their 1-year high (plotted upside down).
On Tuesday, 44% of stocks in my database are in bear market territory (down at least 20% from their 1-year high).A week ago, it was 40%.The fewest was 31% on 02/02/2023.And the most was 80% on 06/17/2022.
The 523 stocks in my database are down an average of 21% from their yearly high.A week ago, the average was 19%.The peak was 16% on 02/02/2023.And the bottom was 34% on 09/30/2022.
Both the red and blue lines are worse this week compared to last week. Since mid April, the red line has eased lower, suggesting weakness.
Both charts are weak or bearish this week but the final direction rests with congress and the debt limit.
$ $ $
Here's a symbol list of 181 chart and candlestick patterns (13 "investment grade" candle patterns) found in today's securities using my version of Patternz: ACIW, AYI, ADTN, AEIS, AFL, ATSG, AKAM, ALKS, ALGT, AMWD, AR, APOG, AAPL, ARCB, AWI, ADP, BALL, BIG, BMRN, BSX, BRC, BCO, BMY, BR, BRKR, CALM, CLS, CX, CNC, CNP, CENX, CDAY, CVX, CHS, CGNX, CL, CSGP, CROX, CMI, XRAY, FANG, DRQ, BOOM, ELV, EOG, EPAM, EVH, XOM, FRD, GIS, GNW, GILD, HE, HAYN, HSII, IDA, INFN, IBKR, INTU, K, KELYA, KMB, LAMR, M, MAN, MAS, MA, MDT, MGEE, MLKN, MOS, NBR, NOV, NCR, NFLX, NJR, NEE, NKE, NOVT, NTNX, NVDA, OMI, OXM, PATK, PTEN, PRFT, PETS, PFE, PCG, PINC, PG, PSTG, KWR, QCOM, RRC, RNG, RLI, RHI, RES, R, SBH, SEIC, SIGI, SWX, SWN, SR, SPSC, SCS, SNPS, TPR, TRGP, TTD, TOL, VECO, V, WERN, WU, WEX, WPM, WWW, WDAY, IYK, IYE, IEZ, IHE, IDU, FTEC, BOTZ, IXC, IGE, IEO, IHI, EWZ, EWC, ECH, EWH, EIS, EWM, EWW, EWS, EZA, EWY, TUR, IBB, PBE, PEJ, PXJ, PJP, ROBO, XLE, SPY, XLK, XLU, UNG, USO, VAW. Click this link for details (pattern type, start and end dates).
For a list of small patterns (those a few days wide) click this link.
-- Thomas Bulkowski
![]()
$ $ $
I show another slider trading quiz featuring Vulcan materials: VMC stock.
$ $ $
Here's a symbol list of 151 chart and candlestick patterns (13 "investment grade" candle patterns) found in today's securities using my version of Patternz: DDD, AXDX, ACN, AEIS, AMD, ATSG, AYX, DOX, AEE, AEP, ANIK, ATR, ACGL, ANET, ADP, AVY, AVA, AZTA, BMI, BAX, BIG, BMRN, BKH, BSX, BMY, CBT, CDNS, CAL, CNC, CENX, CHS, CIEN, CI, CLNE, CNA, CNO, CTSH, CMCO, ED, CR, ^DJU, ^DJT, ^DJI, D, DUK, ELV, WIRE, EPAM, EXC, FDX, FIVN, FRD, GILD, GFS, GS, GOOGL, GPRO, HBI, THG, HAYN, HELE, INCY, TILE, JAZZ, K, KMT, LH, MGY, MCHX, MA, MTDR, MDC, MDT, MGEE, MS, MYGN, NBR, JWN, NTNX, NVDA, OMCL, OMI, OXM, PTEN, PFE, PXD, PPL, PEG, RRC, RNG, ROG, RES, CRM, SIGI, SCI, SKYW, SMAR, SO, SWN, TXN, TRV, TREX, TWLO, VMI, WMB, WDAY, IAI, IYC, ITB, IHE, FDN, QTEC, FXL, BOTZ, IHF, IGV, IXN, ILF, SOXX, SLV, IEO, EWZ, EEM, EWH, EIS, EWM, EPP, EWS, EZA, EWT, DBA, PJP, GLD, XRT, SPY, SMH. Click this link for details (pattern type, start and end dates).
For a list of small patterns (those a few days wide) click this link.
$ $ $
The following table shows where Fibonacci retrace values of the day's high-low range are plus pivot points, calculated on the Dow industrials, sorted by value. When several are near each other (small differences), the area might act as support or resistance.
-- Thomas Bulkowski
![]()
| © 2023 ThePatternSite.com Metric | Value | Diff | Close (within 10% of the high-low range for the day)? |
| Monthly S2 | 31,641.31 | ||
| Weekly S2 | 32,138.33 | 497.02 | |
| Monthly S1 | 32,367.32 | 229.00 | |
| Weekly S1 | 32,615.83 | 248.51 | |
| Daily S2 | 32,650.41 | 34.57 | Yes! The Daily S2 is close to the Weekly S1. |
| Low | 32,795.50 | 145.09 | |
| Open | 32,795.50 | 0.00 | Yes! The Open is close to the Low. |
| Daily S1 | 32,871.88 | 76.38 | |
| 61.8% Down from Intraday High | 32,935.53 | 63.65 | |
| 50% Down from Intraday High | 32,978.78 | 43.25 | |
| Daily Pivot | 33,016.96 | 38.18 | |
| 38.2% Down from Intraday High | 33,022.04 | 5.07 | Yes! The 38.2% Down from Intraday High is close to the Daily Pivot. |
| Weekly Pivot | 33,064.07 | 42.03 | |
| Close | 33,093.34 | 29.27 | Yes! The Close is close to the Weekly Pivot. |
| High | 33,162.06 | 68.72 | |
| Daily R1 | 33,238.43 | 76.38 | |
| Monthly Pivot | 33,312.58 | 74.14 | |
| Daily R2 | 33,383.53 | 70.95 | |
| Weekly R1 | 33,541.57 | 158.05 | |
| Weekly R2 | 33,989.81 | 448.23 | |
| Monthly R1 | 34,038.59 | 48.79 | |
| Monthly R2 | 34,983.85 | 945.25 |
$ $ $
Here's a symbol list of 228 chart and candlestick patterns (13 "investment grade" candle patterns) found in today's securities using my version of Patternz: DDD, ABT, ABM, AYI, AEIS, AMD, AFL, ALRM, AA, AYX, DOX, AEE, AEO, AEP, AMWD, AMGN, APH, ARCB, ANET, ARW, ATO, ADP, AVA, AXS, AZTA, BMI, BALL, BAX, BECN, BIIB, BMRN, BKH, BKNG, BAH, BFH, BMY, BG, CACI, CALM, CAL, CE, CLS, CNC, CENX, CI, CINF, CSCO, CLNE, CNA, CL, ED, CONN, COST, COTY, DECK, XRAY, DSGR, ^DJU, D, DOV, DTE, DUK, ECL, ELV, WIRE, EPAM, EFX, EVRG, EVH, EXC, EXPI, FIS, FIVN, FLEX, FLS, FNV, GIS, GFS, GL, GPRO, GES, THG, HE, HL, HUM, HURC, INTC, IBKR, TILE, IPG, INTU, IRM, JAZZ, K, LHX, LZB, LNC, RAMP, L, MCHX, MAS, MTRN, MDT, MRCY, MGEE, MU, MSFT, MLKN, MYGN, NWPX, NUS, NTNX, OXY, ORI, OMC, OMI, PATK, PDCO, PAYX, PCTY, PNW, PXD, PPG, PPL, PINC, PG, PEG, PSTG, QTWO, DGX, RJF, RGS, RHI, RCKY, CRM, SLB, SCHW, SAIC, SEIC, SHOP, STR, SKYW, SO, SWN, TGT, TDOC, TEVA, TXT, TJX, TOL, TRV, TWLO, WERN, WU, WEX, WPM, WWW, XEL, ITA, IYM, IAI, IYK, IYC, IHE, FXI, BOTZ, ICF, IYH, IHF, IYZ, IEV, MXI, SLV, IHI, EWA, EWO, EWK, EWC, ECH, EWH, EWI, EWJ, EWM, EPP, EWS, EZA, EWP, EWD, TUR, EWU, IBB, PPA, DBA, PBE, PEJ, PXJ, PJP, XLP, GLD, XLV, XLB, XRT, XAR, VHT, VIS, VAW. Click this link for details (pattern type, start and end dates).
For a list of small patterns (those a few days wide) click this link.
$ $ $
You can find setups based on a Fibonacci retrace by clicking on the link.
The following patterns were found manually, not using Patternz. Mr. Bulkowski has excluded any securities he owns from appearing in the list. However, he may add any of the securities listed to his portfolio at any time, just as you can.
In the table below, the red and green colors are based on the historical breakout direction for the associated chart pattern. If a high and tight flag appears, the start and end dates highlight the flagpole only and not the flag.
For details about the chart patterns, click here.
-- Thomas Bulkowski
![]()
| Symbol | Chart Pattern | Bullish Bearish | Start | End | Industry |
| ABT | Double Top, Adam and Adam | 04/19/2023 | 05/03/2023 | Medical Supplies | |
| ANF | Double Bottom, Adam and Adam | 05/04/2023 | 05/22/2023 | Apparel | |
| ALB | Horn bottom | 04/17/2023 | 05/01/2023 | Chemical (Diversified) | |
| ACGL | Head-and-shoulders top | 05/01/2023 | 05/19/2023 | Insurance (Prop/Casualty) | |
| ANET | Double Bottom, Adam and Adam | 05/04/2023 | 05/18/2023 | E-Commerce | |
| ADSK | Triangle, ascending | 04/27/2023 | 05/16/2023 | Computer Software and Svcs | |
| AVA | Triple top | 04/12/2023 | 05/10/2023 | Electric Utility (West) | |
| CAL | Triple top | 04/24/2023 | 05/18/2023 | Shoe | |
| CE | Triple bottom | 04/26/2023 | 05/10/2023 | Chemical (Basic) | |
| CHKP | Double Bottom, Eve and Eve | 05/02/2023 | 05/18/2023 | E-Commerce | |
| CRH | Triangle, symmetrical | 04/04/2023 | 05/10/2023 | Cement and Aggregates | |
| EBAY | Double Top, Adam and Eve | 04/28/2023 | 05/09/2023 | Internet | |
| EPAM | Pipe bottom | 05/08/2023 | 05/15/2023 | IT Services | |
| EXC | Head-and-shoulders top | 04/12/2023 | 05/01/2023 | Electric Utility (East) | |
| IT | Double Bottom, Eve and Adam | 04/26/2023 | 05/04/2023 | IT Services | |
| GD | Triangle, symmetrical | 05/03/2023 | 05/17/2023 | Aerospace/Defense | |
| GFF | Rising wedge | 04/19/2023 | 05/22/2023 | Building Materials | |
| HSC | Double Top, Eve and Eve | 05/10/2023 | 05/19/2023 | Diversified Co. | |
| HP | Triple bottom | 05/04/2023 | 05/17/2023 | Petroleum (Producing) | |
| IPG | Pipe bottom | 04/24/2023 | 05/01/2023 | Advertising | |
| JKHY | Pipe top | 04/24/2023 | 05/01/2023 | IT Services | |
| KLIC | Head-and-shoulders bottom | 04/25/2023 | 05/11/2023 | Semiconductor Cap Equip. | |
| LRCX | Triangle, symmetrical | 04/20/2023 | 05/12/2023 | Semiconductor Cap Equip. | |
| LEN | Triple top | 05/03/2023 | 05/19/2023 | Homebuilding | |
| MRO | Double Bottom, Adam and Eve | 05/04/2023 | 05/16/2023 | Petroleum (Integrated) | |
| MTDR | Triple bottom | 05/04/2023 | 05/17/2023 | Petroleum (Producing) | |
| MUR | Double Bottom, Adam and Eve | 05/03/2023 | 05/12/2023 | Petroleum (Integrated) | |
| MYGN | Pipe bottom | 05/08/2023 | 05/15/2023 | Biotechnology | |
| NXGN | Pipe top | 04/17/2023 | 04/24/2023 | Healthcare Information | |
| NWPX | Double Bottom, Adam and Eve | 05/04/2023 | 05/16/2023 | Building Materials | |
| PANW | Head-and-shoulders bottom | 04/06/2023 | 05/18/2023 | Computer Software and Svcs | |
| PNW | Triple top | 04/06/2023 | 05/12/2023 | Electric Utility (West) | |
| POR | Triple top | 04/12/2023 | 05/08/2023 | Electric Utility (West) | |
| PEG | Triple top | 04/21/2023 | 05/10/2023 | Electric Utility (East) | |
| KWR | Double Top, Eve and Eve | 05/08/2023 | 05/19/2023 | Chemical (Specialty) | |
| RNG | Ugly double bottom | 05/04/2023 | 05/16/2023 | Computer Software and Svcs | |
| RLI | Pipe top | 04/17/2023 | 04/24/2023 | Insurance (Prop/Casualty) | |
| ROP | Double Top, Eve and Eve | 05/02/2023 | 05/15/2023 | Industrial Services | |
| SPLK | Head-and-shoulders bottom | 04/25/2023 | 05/12/2023 | E-Commerce | |
| TPR | Broadening bottom | 03/27/2023 | 05/18/2023 | Apparel | |
| TXN | Triple bottom | 04/27/2023 | 05/11/2023 | Semiconductor | |
| TRV | Triple top | 04/19/2023 | 05/19/2023 | Insurance (Prop/Casualty) | |
| TWLO | Pipe bottom | 05/08/2023 | 05/15/2023 | E-Commerce | |
| V | Triangle, symmetrical | 05/05/2023 | 05/22/2023 | Financial Services | |
| WLK | Broadening top | 04/03/2023 | 05/05/2023 | Chemical (Basic) | |
| ITA | Triple bottom | 03/15/2023 | 05/04/2023 | Aerospace/Defense | |
| IYM | Double Bottom, Eve and Eve | 03/15/2023 | 05/24/2023 | Metals and Mining (Div.) | |
| IAI | Double Top, Eve and Eve | 09/18/2019 | 11/15/2019 | Securities Brokerage | |
| IYK | Triple bottom | 04/30/2015 | 06/30/2015 | Household Products | |
| IYC | Triple bottom | 04/06/2023 | 05/04/2023 | Retail Store | |
| IYE | Double Bottom, Eve and Eve | 08/27/2019 | 10/03/2019 | Petroleum (Integrated) | |
| ITB | Double Top, Eve and Eve | 12/13/2021 | 12/30/2021 | Homebuilding | |
| IEZ | Triple bottom | 03/24/2023 | 05/16/2023 | Oilfield Svcs/Equipment | |
| IDU | Triple bottom | 04/03/2017 | 05/04/2017 | Electric Utility (Central) | |
| DOG | Triple bottom | 01/13/2023 | 02/14/2023 | Short ETFs | |
| DXD | Double Top, Eve and Eve | 09/30/2022 | 10/13/2022 | Short ETFs | |
| FTEC | Triple bottom | 05/18/2017 | 07/06/2017 | IT Services | |
| FDN | Triple bottom | 04/27/2016 | 06/27/2016 | Internet | |
| QTEC | Triple top | 03/07/2014 | 04/03/2014 | Electronics | |
| FXL | Double Top, Eve and Eve | 03/13/2018 | 06/14/2018 | IT Services | |
| FXI | Double Bottom, Eve and Eve | 07/27/2021 | 08/20/2021 | Investment Co. (Foreign) | |
| BOTZ | Triple bottom | 08/09/2021 | 10/06/2021 | Electronics | |
| ICF | Triple bottom | 02/21/2018 | 03/23/2018 | Long ETFs | |
| IHF | Double Bottom, Eve and Eve | 01/24/2022 | 02/24/2022 | Long ETFs | |
| IAT | Double Bottom, Eve and Eve | 07/09/2020 | 09/24/2020 | Long ETFs | |
| IYZ | Double Top, Eve and Eve | 06/08/2020 | 08/11/2020 | Telecom. Equipment | |
| IEV | Double Bottom, Eve and Eve | 09/27/2022 | 10/13/2022 | Investment Co. (Foreign) | |
| IGV | Triple bottom | 05/15/2018 | 06/27/2018 | Computer Software and Svcs | |
| IXC | Double Bottom, Eve and Eve | 07/10/2020 | 07/31/2020 | Investment Co. (Foreign) | |
| MXI | Triple bottom | 05/04/2017 | 06/21/2017 | Investment Co. (Foreign) | |
| IXN | Triple bottom | 07/27/2017 | 08/21/2017 | IT Services | |
| ILF | Double Bottom, Eve and Eve | 09/29/2020 | 10/29/2020 | Investment Co. (Foreign) | |
| SOXX | Double Bottom, Eve and Eve | 11/25/2011 | 12/19/2011 | Semiconductor | |
| SLV | Triple top | 01/03/2023 | 02/02/2023 | Metals and Mining (Div.) | |
| IGE | Triple bottom | 06/15/2020 | 07/09/2020 | Petroleum (Integrated) | |
| IEO | Double Bottom, Eve and Eve | 08/25/2015 | 09/29/2015 | Petroleum (Integrated) | |
| IYF | Double Top, Eve and Eve | 04/09/2020 | 04/29/2020 | Financial Services | |
| IHI | Triple bottom | 05/14/2020 | 06/25/2020 | Medical Supplies | |
| EWA | Triple bottom | 03/08/2019 | 05/15/2019 | Investment Co. (Foreign) | |
| EWO | Triple top | 04/18/2023 | 05/08/2023 | Investment Co. (Foreign) | |
| EWK | Triple top | 01/17/2023 | 04/24/2023 | Investment Co. (Foreign) | |
| EWZ | Double Bottom, Eve and Eve | 12/14/2022 | 01/04/2023 | Investment Co. (Foreign) | |
| EWC | Triple bottom | 12/22/2022 | 03/24/2023 | Investment Co. (Foreign) | |
| ECH | Double Bottom, Eve and Eve | 11/18/2022 | 12/16/2022 | Investment Co. (Foreign) | |
| EEM | Double Bottom, Eve and Eve | 05/19/2016 | 06/27/2016 | Investment Co. (Foreign) | |
| EWQ | Triple top | 02/03/2023 | 03/06/2023 | Investment Co. (Foreign) | |
| EWG | Double Bottom, Eve and Eve | 09/27/2022 | 10/13/2022 | Investment Co. (Foreign) | |
| EWH | Triple top | 10/20/2021 | 11/22/2021 | Investment Co. (Foreign) | |
| EIS | Triple bottom | 06/17/2019 | 09/03/2019 | Investment Co. (Foreign) | |
| EWI | Triple top | 04/14/2023 | 05/05/2023 | Investment Co. (Foreign) | |
| EWJ | Triple bottom | 05/31/2019 | 08/14/2019 | Investment Co. (Foreign) | |
| EWM | Triple top | 02/16/2022 | 03/25/2022 | Investment Co. (Foreign) | |
| EWW | Double Bottom, Eve and Eve | 09/01/2022 | 09/26/2022 | Investment Co. (Foreign) | |
| EPP | Triple bottom | 07/31/2020 | 10/30/2020 | Investment Co. (Foreign) | |
| EWS | Triple bottom | 11/28/2022 | 12/16/2022 | Investment Co. (Foreign) | |
| EZA | Double Bottom, Eve and Eve | 08/20/2021 | 09/20/2021 | Investment Co. (Foreign) | |
| EWY | Double Bottom, Eve and Eve | 05/18/2016 | 06/27/2016 | Investment Co. (Foreign) | |
| EWP | Double Top, Eve and Eve | 04/21/2022 | 05/27/2022 | Investment Co. (Foreign) | |
| EWD | Triple top | 08/04/2021 | 09/02/2021 | Investment Co. (Foreign) | |
| EWL | Triple bottom | 06/18/2021 | 07/19/2021 | Investment Co. (Foreign) | |
| EWT | Triple top | 12/13/2019 | 01/13/2020 | Investment Co. (Foreign) | |
| TUR | Triple top | 05/10/2021 | 09/02/2021 | Long ETFs | |
| EWU | Triple bottom | 09/20/2021 | 12/15/2021 | Investment Co. (Foreign) | |
| QLD | Double Top, Eve and Eve | 12/01/2022 | 12/13/2022 | Long ETFs | |
| PSQ | Triple bottom | 11/15/2022 | 12/13/2022 | Short ETFs | |
| QID | Double Top, Eve and Eve | 02/24/2022 | 03/14/2022 | Short ETFs | |
| PPA | Triple bottom | 11/17/2022 | 01/20/2023 | Aerospace/Defense | |
| DBA | Triple top | 08/29/2022 | 09/20/2022 | Investment Co. (Domestic) | |
| PEJ | Triple bottom | 02/10/2012 | 06/04/2012 | Long ETFs |
![]()
Since I post this the night before, check how the futures are trading before market open. Large moves can affect the opening direction.
$ $ $
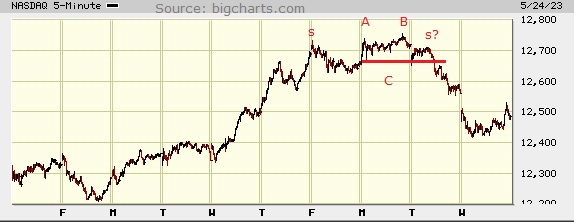
I show a picture of the Nasdaq composite on the 5-minute scale.
There's not much to discuss on this pic. AB is a double top chart pattern that confirms when the index drops below C, the red line highlighting the valley between the two peaks.
After that, the index drops, just as it's supposed to after confirmation of a bearish chart pattern.
The two s's are potential shoulders of a complex head-and-shoulders top. I didn't think it was well-shaped, so I don't think it's a valid pattern.
Based only on this picture and disregarding debt ceiling news, it looks like the index is resting on support. And that's bullish. So I'd expect a recovery in the days ahead. If we consider the debt ceiling, then who knows what will happen? I've seen estimates of a 17% to 20% drop in the indices if we default. I think it'll be worse, though. And if we pass it, we could see a nice pop, maybe 10%.
$ $ $
Here's a symbol list of 232 chart and candlestick patterns (13 "investment grade" candle patterns) found in today's securities using my version of Patternz: ABT, ANF, ABM, ACIW, AYI, AFL, A, AA, ALKS, ALL, AEP, AFG, AMWD, AME, AMGN, AMAT, ARCB, ADM, ANET, AWI, ASH, AGO, AVY, AVA, BMI, BAX, BIO, BIIB, BMRN, BOOT, BAH, BMY, BRKR, CDNS, CALM, CE, CNC, CENX, CF, CHS, CSCO, CNA, ED, CAG, CONN, COST, COTY, CRH, XRAY, ^DJT, D, DOV, EMR, EPAM, EL, EVH, FARO, FIS, FIVN, FLS, FNV, FCX, GFS, GL, GS, GPRO, THG, HL, HSIC, HWM, IDA, ILMN, NSP, IPAR, TILE, IRM, JBLU, KMB, KLAC, LZB, LRCX, LEN, L, LPLA, MTSI, MANH, MCHX, MLM, MAS, MA, MTRN, MDC, MRCY, META, MGEE, MLKN, MYGN, NWL, NEU, NOVT, NVDA, OXY, ORI, OMC, ON, OR, OUT, OMI, OXM, PANW, PETS, PNW, PXD, PPG, PG, KWR, QCOM, RJF, ROK, ROL, ROP, ROST, RGLD, ^GSPC, SBH, SEIC, SCI, SLGN, STR, SKX, SCCO, SWN, SXI, SCS, SUM, SRDX, TPR, TGT, TECH, TDY, TFX, TER, TEVA, TXT, TJX, TSCO, TRV, TZOO, TREX, TWLO, VMI, VEEV, V, WRB, WMT, WAT, WU, WEX, WPM, WWW, WDAY, ITA, IYM, IYK, IYC, ITB, IHE, IDU, QTEC, FXI, ICF, IYH, IYZ, IEV, MXI, SLV, IHI, EWA, EWO, EWK, EWC, EEM, EWQ, EWG, EWH, EWI, EWJ, EWM, EPP, EWS, EWP, EWD, EWL, EWT, TUR, EWU, PPA, PEJ, PHO, SSO, XLP, XLF, GLD, XLV, XHB, XLI, XLB, XRT, SPY, XLU, SMH, VIS, VAW. Click this link for details (pattern type, start and end dates).
For a list of small patterns (those a few days wide) click this link.
$ $ $
The following table shows where Fibonacci retrace values of the day's high-low range are plus pivot points, calculated on the Nasdaq composite, sorted by value. When several are near each other (small differences), the area might act as support or resistance.
-- Thomas Bulkowski
![]()
| © 2023 ThePatternSite.com Metric | Value | Diff | Close (within 10% of the high-low range for the day)? |
| Monthly S2 | 11,405.26 | ||
| Monthly S1 | 11,944.71 | 539.45 | |
| Weekly S2 | 12,024.70 | 79.99 | |
| Weekly S1 | 12,254.43 | 229.73 | |
| Monthly Pivot | 12,338.22 | 83.79 | |
| Daily S2 | 12,362.77 | 24.55 | |
| Low | 12,415.85 | 53.08 | |
| Daily S1 | 12,423.46 | 7.61 | Yes! The Daily S1 is close to the Low. |
| 61.8% Down from Intraday High | 12,459.31 | 35.85 | |
| 50% Down from Intraday High | 12,472.74 | 13.43 | |
| Daily Pivot | 12,476.55 | 3.81 | Yes! The Daily Pivot is close to the 50% Down from Intraday High. |
| Open | 12,481.89 | 5.34 | Yes! The Open is close to the Daily Pivot. |
| Close | 12,484.16 | 2.27 | Yes! The Close is close to the Open. |
| 38.2% Down from Intraday High | 12,486.17 | 2.01 | Yes! The 38.2% Down from Intraday High is close to the Close. |
| Weekly Pivot | 12,493.08 | 6.91 | Yes! The Weekly Pivot is close to the 38.2% Down from Intraday High. |
| High | 12,529.63 | 36.55 | |
| Daily R1 | 12,537.24 | 7.61 | Yes! The Daily R1 is close to the High. |
| Daily R2 | 12,590.33 | 53.08 | |
| Weekly R1 | 12,722.81 | 132.48 | |
| Monthly R1 | 12,877.67 | 154.86 | |
| Weekly R2 | 12,961.46 | 83.79 | |
| Monthly R2 | 13,271.18 | 309.72 |
This is a picture of the chart pattern indicator on the daily scale. The indicator is the line chart below a chart of the S&P 500 composite.
The CPI has turned bearish with a 30 reading. That's well above 0, the lowest it can go, so we just ventured into bearish territory as if dipping a toe to test the water's temperature.
Today's drop is a reflection of the markets growing concern about the debt ceiling talks. The longer this goes on, the more volatile the markets are likely to be. However, I'm looking at this as a buying opportunity. With the growth in interest rates, the housing market has taken off. I'd like to expand my holdings there and add to soxx, a semiconductor ETF. Both are expensive now and for all I know, they might not drop far enough to warrant a buy. I'm actually hoping to see a nice market correction here...
The red line is the percentage of stocks at least 20% below their 1-year high (plotted upside down). The blue line is the average percentage drop of stocks below their 1-year high (plotted upside down).
On Tuesday, 41% of stocks in my database are in bear market territory (down at least 20% from their 1-year high).A week ago, it was 44%.The fewest was 31% on 02/02/2023.And the most was 80% on 06/17/2022.
The 523 stocks in my database are down an average of 20% from their yearly high.A week ago, the average was 21%.The peak was 16% on 02/02/2023.And the bottom was 34% on 09/30/2022.
Both the red and blue lines show improvement over what we saw a week ago. That's odd because the CPI is dropping even as the red line is climbing. You can see the red line gathering strength for the last two weeks or so.
With more negotiating on the debt ceiling to come, I think the CPI is the correct chart. It's warning of a downturn.
$ $ $
Here's a symbol list of 114 chart and candlestick patterns (13 "investment grade" candle patterns) found in today's securities using my version of Patternz: ABT, APD, ALB, ALKS, ALL, AEE, AIG, AAPL, ANET, AGO, BAX, BBY, BIIB, BLDR, CNC, CENX, CVX, CL, CMTL, ED, CONN, COST, COTY, XRAY, DVN, BOOM, EIX, EPAM, EL, EVH, EXC, FIVN, FNV, FCX, GPS, GD, GILD, GFS, GPRO, HOLX, IEX, IIIN, ITGR, INTC, TILE, KBH, K, KBAL, LZB, LAMR, LDOS, LLY, LNC, MCHX, MRTN, MLKN, MYGN, NJR, NKE, OMI, PATK, PCTY, PETS, PG, PHM, RJF, REGN, RLI, ROL, RGLD, SBH, SCHW, SCI, STR, SKYW, SCCO, SWN, TECH, TOL, TSCO, TWLO, SLCA, VEEV, WU, WPM, IYM, IYK, QTEC, ICF, IAT, MXI, IHI, EWK, EWG, EWH, EIS, EWM, EWS, EWD, PBE, PXJ, XLP, XLB, USO. Click this link for details (pattern type, start and end dates).
For a list of small patterns (those a few days wide) click this link.
-- Thomas Bulkowski
![]()
$ $ $
I show another slider trading quiz featuring UIL Holdings: UIL stock.
$ $ $
Here's a symbol list of 137 chart and candlestick patterns (13 "investment grade" candle patterns) found in today's securities using my version of Patternz: ANF, ADBE, AMD, APD, ALKS, AYX, AMZN, AEE, ABC, AMN, APH, ASH, AGO, AZTA, BZH, BERY, BIIB, BRC, BMY, BBW, BLDR, CE, CNC, CENX, CLNE, CLF, CTSH, CL, CMTL, ED, CAG, CONN, COST, CROX, CCRN, DECK, EIX, EFX, EVH, EXPI, FDX, FLEX, GD, GE, GILD, GFS, HTLD, HD, DHI, IDA, ITGR, IPAR, KALU, KBH, K, KEYS, KLIC, LZB, LEN, LLY, MCHX, MAS, META, MGEE, MCO, MUR, NKE, OMCL, PPG, PG, PHM, QTWO, KWR, REGN, RGS, RNG, RGLD, SAND, SLB, SEIC, SMTC, STR, SKX, SMAR, LUV, SWX, SPLK, TPR, TECH, TDY, TXN, TTD, TZOO, TREX, SLCA, VLO, MDRX, VRTX, WSO, WWW, ITB, IEZ, FTEC, FDN, QTEC, FXL, BOTZ, QQQ, IXN, ILF, SOXX, SLV, IHI, EWO, EWJ, EWM, EWY, QLD, PBE, PXJ, XLP, XHB, XRT, XLK. Click this link for details (pattern type, start and end dates).
For a list of small patterns (those a few days wide) click this link.
$ $ $
The following table shows where Fibonacci retrace values of the day's high-low range are plus pivot points, calculated on the Dow industrials, sorted by value. When several are near each other (small differences), the area might act as support or resistance.
-- Thomas Bulkowski
![]()
| © 2023 ThePatternSite.com Metric | Value | Diff | Close (within 10% of the high-low range for the day)? |
| Monthly S2 | 32,173.64 | ||
| Weekly S2 | 32,668.51 | 494.87 | |
| Monthly S1 | 32,730.11 | 61.60 | |
| Weekly S1 | 32,977.55 | 247.44 | |
| Daily S2 | 33,031.13 | 53.58 | |
| Daily S1 | 33,158.85 | 127.73 | |
| Low | 33,207.85 | 49.00 | |
| Close | 33,286.58 | 78.73 | |
| Weekly Pivot | 33,315.22 | 28.64 | Yes! The Weekly Pivot is close to the Close. |
| 61.8% Down from Intraday High | 33,324.15 | 8.93 | Yes! The 61.8% Down from Intraday High is close to the Weekly Pivot. |
| Daily Pivot | 33,335.58 | 11.43 | Yes! The Daily Pivot is close to the 61.8% Down from Intraday High. |
| 50% Down from Intraday High | 33,360.07 | 24.50 | Yes! The 50% Down from Intraday High is close to the Daily Pivot. |
| 38.2% Down from Intraday High | 33,396.00 | 35.93 | |
| Open | 33,408.54 | 12.54 | Yes! The Open is close to the 38.2% Down from Intraday High. |
| Daily R1 | 33,463.30 | 54.77 | |
| Monthly Pivot | 33,493.97 | 30.66 | |
| High | 33,512.30 | 18.33 | Yes! The High is close to the Monthly Pivot. |
| Weekly R1 | 33,624.26 | 111.96 | |
| Daily R2 | 33,640.03 | 15.77 | Yes! The Daily R2 is close to the Weekly R1. |
| Weekly R2 | 33,961.93 | 321.91 | |
| Monthly R1 | 34,050.44 | 88.51 | |
| Monthly R2 | 34,814.30 | 763.86 |
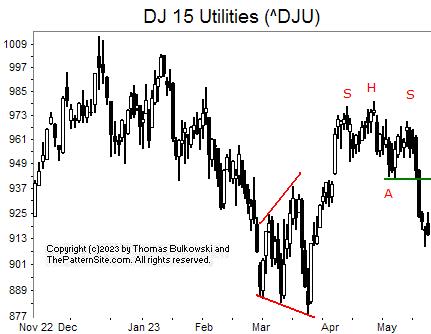
Highlighted in red is a broadening bottom chart pattern. This one acted as a reversal pattern, reversing the downward trend to up.
SHS is a head-and-shoulders top chart pattern. It looks weird because the right shoulder is well below the left. At A, the pattern changes from being squiggles on a price chart to an actual chart pattern. The index makes a strong downward push thereafter.
To me, I think the index has reached support and you'll see it climb over the next week. Alternatively, this might only be the midway point of a strong push lower.
$ $ $
New research: Is gold a good investment?
$ $ $
![]()
The following is a brief review of how the markets performed over time. The numbers refer to the close-to-close move in the Dow industrials.
No options expire this week.
![]()
The following is based on an SFO article in December 2004 by John Seekinger, titled, "Take a two-dimensional approach." He offers these tips.
| Index | S2 | S1 | Pivot | R1 | R2 |
| Dow Industrials (^DJI): Daily | 33,156 | 33,291 | 33,472 | 33,607 | 33,788 |
| Weekly | 32,715 | 33,071 | 33,362 | 33,718 | 34,009 |
| Monthly | 32,220 | 32,823 | 33,541 | 34,144 | 34,861 |
| S&P500 (^GSPC): Daily | 4,162 | 4,177 | 4,195 | 4,210 | 4,228 |
| Weekly | 4,069 | 4,130 | 4,172 | 4,233 | 4,275 |
| Monthly | 3,986 | 4,089 | 4,151 | 4,254 | 4,316 |
| Nasdaq (^IXIC): Daily | 12,564 | 12,611 | 12,671 | 12,718 | 12,779 |
| Weekly | 12,083 | 12,370 | 12,551 | 12,839 | 13,019 |
| Monthly | 11,463 | 12,061 | 12,396 | 12,993 | 13,329 |
Here are the formulas:
![]()
Earnings season is either underway or should be starting soon. The sessions could be more volatile.
Here's a symbol list of 180 chart and candlestick patterns (13 "investment grade" candle patterns) found in today's securities using my version of Patternz: ANF, ABM, ACIW, AJRD, ATSG, AA, ALGT, ALL, AMZN, DOX, AEL, ABC, APH, APOG, AAPL, ACGL, ANET, ASH, AIZ, AGO, AVNT, AVA, AXS, BMI, BCPC, BSET, BZH, BERY, BA, BAH, BRC, BR, BBW, BLDR, CHS, CSCO, CLNE, CLF, CNA, CL, ED, CONN, COP, CXW, COTY, CROX, DECK, DVN, DSGR, ^DJT, DOV, BOOM, EIX, EVH, EXC, EZPW, FFIV, FDX, GD, GPN, GFF, THG, HTLD, HNI, HD, DHI, HUN, IBP, IPAR, TILE, JKHY, KALU, KBH, KBAL, KSS, LHX, LZB, LANC, LDOS, LEN, LMT, LXU, MHO, MTSI, MGY, MAN, MAS, META, MLKN, NEE, NKE, OGE, ASGN, OXM, PATK, PDCO, PFE, PNW, PLXS, POR, PPG, PG, PHM, QTWO, RGLD, ^GSPC, SAND, SLB, SAIC, SEIC, SRE, NOW, SO, LUV, SWN, SXI, TPR, TECH, TXT, TMO, TKR, TDG, TZOO, TREX, VLO, VEEV, VC, WU, WLK, WMB, WWD, ITA, IAI, ITB, IDU, BOTZ, IAT, IXN, IHI, EWO, EWG, EIS, EWW, EWY, EWT, TUR, PEJ, ROBO, XHB, XRT, SPY, XAR. Click this link for details (pattern type, start and end dates).
For a list of small patterns (those a few days wide) click this link.
The below industries were the best (rank 1) or worst performing of those I follow.
|
-- Thomas Bulkowski
![]()
$ $ $
Here's a symbol list of 131 chart and candlestick patterns (13 "investment grade" candle patterns) found in today's securities using my version of Patternz: AJRD, AMZN, AMGN, ARCB, AGO, AVA, BIO, BOOT, BMY, CENX, CRL, CLNE, CNX, CL, CMTL, ED, CSGP, DSGR, D, EIX, EQT, EVRG, EVH, EXPD, EZPW, FICO, FE, FIVN, FORM, FTNT, FDP, GME, GIS, GFF, HIG, HTLD, HP, HOLX, JBHT, HURC, IDA, IIIN, PODD, IPG, LEN, LXU, MHO, MTSI, MCHX, MTRX, META, MGEE, MCO, NFLX, NVDA, ORI, OTEX, OR, PANW, PDCO, PETS, POR, PPG, PPL, PG, QTWO, QCOM, RMBS, RNG, RGLD, ^GSPC, SAND, NOW, SHW, SMAR, SO, SCCO, SWN, SNPS, TPR, TECH, TXN, TZOO, TREX, VLO, VRSN, V, WMT, WLK, WPM, IDU, FTEC, FXL, BOTZ, ICF, IGV, MXI, IXN, IHI, EWH, EWM, EZA, EWT, TUR, DBA, PEJ, PHO, XLY, XLP, GLD, XLI, XLB, SPY, XLU, SMH, MGK. Click this link for details (pattern type, start and end dates).
For a list of small patterns (those a few days wide) click this link.
$ $ $
You can find setups based on a Fibonacci retrace by clicking on the link.
The following patterns were found manually, not using Patternz. Mr. Bulkowski has excluded any securities he owns from appearing in the list. However, he may add any of the securities listed to his portfolio at any time, just as you can.
In the table below, the red and green colors are based on the historical breakout direction for the associated chart pattern. If a high and tight flag appears, the start and end dates highlight the flagpole only and not the flag.
For details about the chart patterns, click here.
-- Thomas Bulkowski
![]()
| Symbol | Chart Pattern | Bullish Bearish | Start | End | Industry |
| ADBE | Double Bottom, Adam and Adam | 05/04/2023 | 05/12/2023 | Computer Software and Svcs | |
| AEIS | Double Bottom, Adam and Adam | 04/27/2023 | 05/04/2023 | Semiconductor | |
| ALRM | Triangle, descending | 03/16/2023 | 04/24/2023 | Computer Software and Svcs | |
| ALL | Ugly double bottom | 03/24/2023 | 04/14/2023 | Insurance (Prop/Casualty) | |
| AMWD | Pipe bottom | 04/24/2023 | 05/01/2023 | Building Materials | |
| AON | Ugly double bottom | 03/15/2023 | 04/28/2023 | Insurance (Diversified) | |
| BKH | Broadening top | 04/18/2023 | 05/05/2023 | Electric Utility (West) | |
| BR | Head-and-shoulders bottom | 03/01/2023 | 04/06/2023 | Information Services | |
| BRKR | Big M | 04/14/2023 | 05/04/2023 | Precision Instrument | |
| CRH | Head-and-shoulders bottom | 03/16/2023 | 05/02/2023 | Cement and Aggregates | |
| CCRN | Pipe bottom | 04/24/2023 | 05/01/2023 | Human Resources | |
| DTE | Head-and-shoulders top | 04/12/2023 | 05/10/2023 | Electric Utility (Central) | |
| DUK | Head-and-shoulders top | 04/12/2023 | 05/08/2023 | Electric Utility (East) | |
| EXP | Head-and-shoulders bottom | 02/24/2023 | 04/10/2023 | Cement and Aggregates | |
| EQT | Double Bottom, Adam and Adam | 04/26/2023 | 05/04/2023 | Natural Gas (Diversified) | |
| FLS | Ugly double bottom | 03/17/2023 | 04/10/2023 | Machinery | |
| FTNT | Pipe bottom | 04/24/2023 | 05/01/2023 | Computer Software and Svcs | |
| GME | Pipe bottom | 04/24/2023 | 05/01/2023 | Retail (Special Lines) | |
| GMS | Triple bottom | 03/16/2023 | 04/06/2023 | Cement and Aggregates | |
| IPG | Double Bottom, Adam and Adam | 04/27/2023 | 05/04/2023 | Advertising | |
| MTRX | Big W | 03/24/2023 | 04/28/2023 | Oilfield Svcs/Equipment | |
| PPG | Double Bottom, Adam and Adam | 05/04/2023 | 05/11/2023 | Chemical (Diversified) | |
| PSTG | Double Bottom, Eve and Eve | 04/26/2023 | 05/04/2023 | Computers and Peripherals | |
| RMBS | Pipe bottom | 04/24/2023 | 05/01/2023 | Semiconductor Cap Equip. | |
| RRC | Head-and-shoulders bottom | 04/26/2023 | 05/11/2023 | Petroleum (Producing) | |
| RGLD | Pipe top | 05/01/2023 | 05/08/2023 | Metals and Mining (Div.) | |
| SAND | Double Top, Eve and Eve | 04/13/2023 | 05/08/2023 | Metals and Mining (Div.) | |
| SSYS | Head-and-shoulders bottom | 04/26/2023 | 05/12/2023 | Electronics | |
| TPR | Pipe bottom | 05/01/2023 | 05/08/2023 | Apparel | |
| WPM | Double Top, Adam and Eve | 04/13/2023 | 05/09/2023 | Metals and Mining (Div.) | |
| WSC | Triangle, symmetrical | 04/03/2023 | 05/18/2023 | Industrial Services | |
| ZBRA | Ugly double bottom | 05/02/2023 | 05/12/2023 | Computers and Peripherals | |
| IXN | Pipe bottom | 03/07/2022 | 03/14/2022 | IT Services |
![]()
Since I post this the night before, check how the futures are trading before market open. Large moves can affect the opening direction.
$ $ $
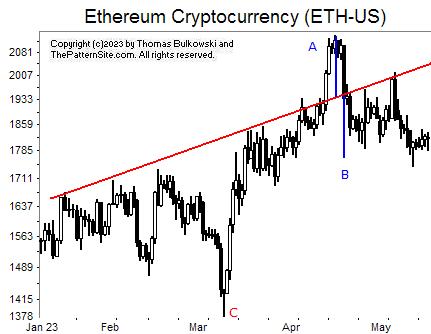
I show a picture of Ethereum on the daily scale.
The first thing I notice is that the cryptocurrency follows a trendline. I show that on the chart with a red line.
The measure rule for trendlines is that the height of the move above the trendline will mirror the drop below the trendline, and vice versa.
I show how successful it was with blue lines A and B. I hand drew these so they are approximate. Before you get too excited, notice that the drop at C wasn't met by a corresponding rise at A.
In other words, this doesn't work as well as we hope.
$ $ $
Here's a symbol list of 157 chart and candlestick patterns (13 "investment grade" candle patterns) found in today's securities using my version of Patternz: ABM, AEIS, AJRD, ALK, ALGT, AMED, AMGN, AMAT, AWI, AGO, AVA, BECN, BBY, BIO, BKH, BSX, BFH, CHS, CLNE, CNO, CL, ED, CONN, COP, GLW, CSGS, DDS, ^DJT, ECL, EIX, EOG, EFX, RE, EVRG, EXPD, EZPW, FICO, FARO, FE, FTNT, FRD, GPS, GIS, GS, GPRO, HBI, HLIT, HIG, HOLX, HON, DHI, HWM, IDA, IDXX, ITW, ILMN, PODD, INTC, IPAR, IBKR, JNJ, KALU, K, KMT, KEYS, LMT, L, LXU, MHO, MAN, MRO, MTDR, MDT, MRK, MGEE, MS, NXGN, NKE, JWN, NOC, PDCO, PPG, PFG, PG, PGR, PRU, QTWO, RL, ROP, RGLD, ^GSPC, CRM, SAND, SLB, SIGI, SCCO, SPLK, TPR, TGT, TECH, TSCO, TREX, VLO, WERN, WLK, WMB, WSM, XEL, IYC, IHE, IDU, DDM, QTEC, BOTZ, ICF, IYH, MXI, SLV, IYF, IHI, EWO, EEM, EWH, EIS, EWM, EWS, EWY, EWL, EWT, THD, PPA, PEJ, SSO, XLE, XLF, GLD, XLI, SPY, XAR, XLU, VHT. Click this link for details (pattern type, start and end dates).
For a list of small patterns (those a few days wide) click this link.
$ $ $
The following table shows where Fibonacci retrace values of the day's high-low range are plus pivot points, calculated on the Nasdaq composite, sorted by value. When several are near each other (small differences), the area might act as support or resistance.
-- Thomas Bulkowski
![]()
| © 2023 ThePatternSite.com Metric | Value | Diff | Close (within 10% of the high-low range for the day)? |
| Monthly S2 | 11,655.45 | ||
| Monthly S1 | 12,078.01 | 422.56 | |
| Weekly S2 | 12,155.84 | 77.83 | |
| Monthly Pivot | 12,221.33 | 65.49 | |
| Daily S2 | 12,270.84 | 49.51 | |
| Weekly S1 | 12,328.20 | 57.37 | |
| Low | 12,335.02 | 6.82 | Yes! The Low is close to the Weekly S1. |
| Weekly Pivot | 12,346.43 | 11.41 | Yes! The Weekly Pivot is close to the Low. |
| Daily S1 | 12,385.70 | 39.28 | |
| Open | 12,388.58 | 2.88 | Yes! The Open is close to the Daily S1. |
| 61.8% Down from Intraday High | 12,403.42 | 14.84 | Yes! The 61.8% Down from Intraday High is close to the Open. |
| 50% Down from Intraday High | 12,424.54 | 21.13 | |
| 38.2% Down from Intraday High | 12,445.67 | 21.13 | |
| Daily Pivot | 12,449.89 | 4.21 | Yes! The Daily Pivot is close to the 38.2% Down from Intraday High. |
| Close | 12,500.57 | 50.68 | |
| High | 12,514.07 | 13.50 | Yes! The High is close to the Close. |
| Weekly R1 | 12,518.79 | 4.72 | Yes! The Weekly R1 is close to the High. |
| Weekly R2 | 12,537.02 | 18.22 | |
| Daily R1 | 12,564.75 | 27.74 | |
| Daily R2 | 12,628.94 | 64.18 | |
| Monthly R1 | 12,643.89 | 14.95 | Yes! The Monthly R1 is close to the Daily R2. |
| Monthly R2 | 12,787.21 | 143.32 |
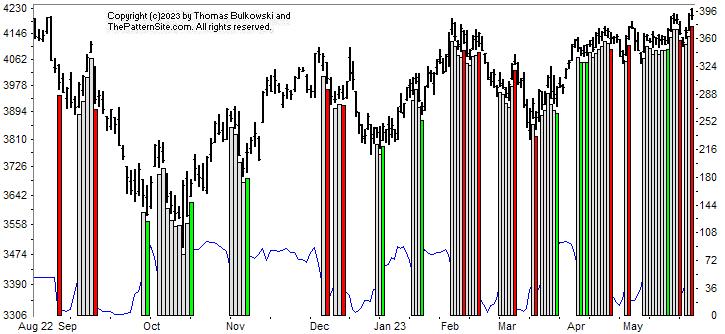
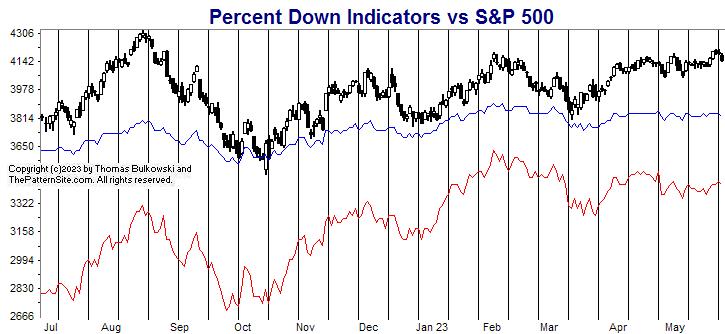
This is a picture of the chart pattern indicator on the daily scale. The indicator is the line chart below a chart of the S&P 500 composite.
The CPI turned bearish two days ago, if you believe the chart, after being neutral for about two weeks. Does this mean the index will tumble?
Because the index is near the top of the chart, at overhead resistance, it suggests the index will drop.
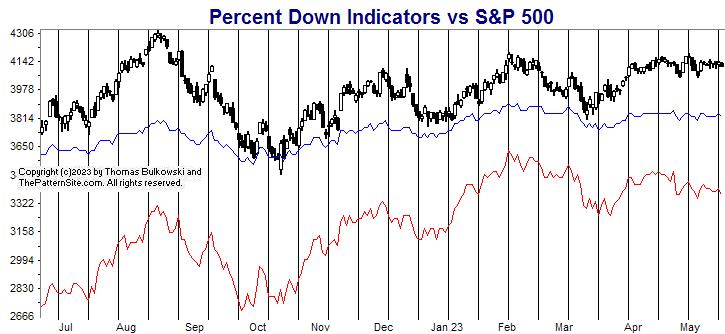
The red line is the percentage of stocks at least 20% below their 1-year high (plotted upside down). The blue line is the average percentage drop of stocks below their 1-year high (plotted upside down).
On Tuesday, 44% of stocks in my database are in bear market territory (down at least 20% from their 1-year high).A week ago, it was 42%.The fewest was 31% on 02/02/2023.And the most was 80% on 06/17/2022.
The 523 stocks in my database are down an average of 21% from their yearly high.A week ago, the average was 20%.The peak was 16% on 02/02/2023.And the bottom was 34% on 09/30/2022.
Both lines show marginally lower (worse) readings from a week ago. The red line has been trending lower for a month now. Often a trend in motion continues in the same direction.
Together with the prior chart, it seems reasonable to assume the index will drop further.
$ $ $
Here's a symbol list of 124 chart and candlestick patterns (13 "investment grade" candle patterns) found in today's securities using my version of Patternz: AMD, AJRD, AFL, AMGN, APA, AMAT, ATR, AWI, AGO, ATO, AVY, AVNT, BZH, CBT, CDNS, CPB, CI, CLNE, CLF, CL, ED, CSGS, CW, DSGR, DOV, DUK, EIX, EL, EVRG, EXPD, EZPW, FIVN, FLS, FORM, FTNT, FDP, FRD, GMS, HNI, HD, DHI, HURC, IDA, ILMN, NSP, PODD, IBKR, TILE, IRM, JKHY, KMT, LDOS, LLY, LMT, MHO, MGY, MCHX, MKTX, MTDR, MDC, MGEE, NOV, NTGR, NEE, NKE, NI, NOC, NWPX, OXY, OGE, PETS, POR, PFG, PG, PEG, QTWO, RRC, RGLD, CRM, SAND, SEIC, SIGI, SCI, SHW, SWN, SSYS, TPR, TJX, TSCO, TREX, VLO, WERN, WLK, WSM, XEL, IHE, IDU, BOTZ, ICF, IYH, IHF, IXC, ILF, SLV, IHI, EWZ, EWD, THD, PJP, XLP, GLD, XLU, USO, VHT. Click this link for details (pattern type, start and end dates).
For a list of small patterns (those a few days wide) click this link.
-- Thomas Bulkowski
![]()
$ $ $
I show another slider trading quiz featuring Walmart: WMT stock.
$ $ $
Here's a symbol list of 109 chart and candlestick patterns (13 "investment grade" candle patterns) found in today's securities using my version of Patternz: AXDX, AMD, ALB, AEO, AEP, AEL, AMWD, ABC, AMN, ARCB, ACGL, ATO, AVA, BKH, BLDR, CDNS, CPB, CNP, CTAS, CLX, CNA, CNX, CL, ED, CCRN, CSGS, DSGR, D, DUK, EXC, FICO, FORM, FTNT, GME, HTLD, HSY, HNI, IDA, PODD, IPG, JKHY, KMB, L, MTRN, MTRX, MLKN, ^IXIC, NJR, NEWR, NKE, NI, NWPX, OGE, PKE, POR, PG, PEG, RMBS, RGS, RES, SCHW, SEIC, SMAR, SO, SWN, SR, SCS, TPR, TFX, TDC, TJX, TREX, UNH, WERN, WMB, WDAY, XEL, IHE, FXI, BOTZ, ILF, IHI, EWO, ECH, EEM, EIS, EWM, EPP, EZA, EWY, EWT, DBA, USO. Click this link for details (pattern type, start and end dates).
For a list of small patterns (those a few days wide) click this link.
$ $ $
The following table shows where Fibonacci retrace values of the day's high-low range are plus pivot points, calculated on the Dow industrials, sorted by value. When several are near each other (small differences), the area might act as support or resistance.
-- Thomas Bulkowski
![]()
| © 2023 ThePatternSite.com Metric | Value | Diff | Close (within 10% of the high-low range for the day)? |
| Monthly S2 | 32,194.31 | ||
| Weekly S2 | 32,748.95 | 554.64 | |
| Monthly S1 | 32,771.46 | 22.50 | Yes! The Monthly S1 is close to the Weekly S2. |
| Weekly S1 | 33,048.78 | 277.32 | |
| Daily S2 | 33,065.24 | 16.46 | Yes! The Daily S2 is close to the Weekly S1. |
| Low | 33,161.93 | 96.69 | |
| Daily S1 | 33,206.92 | 44.99 | |
| 61.8% Down from Intraday High | 33,252.99 | 46.07 | |
| 50% Down from Intraday High | 33,281.11 | 28.13 | |
| Daily Pivot | 33,303.61 | 22.50 | Yes! The Daily Pivot is close to the 50% Down from Intraday High. |
| 38.2% Down from Intraday High | 33,309.24 | 5.63 | Yes! The 38.2% Down from Intraday High is close to the Daily Pivot. |
| Open | 33,321.21 | 11.97 | Yes! The Open is close to the 38.2% Down from Intraday High. |
| Close | 33,348.60 | 27.39 | |
| High | 33,400.30 | 51.70 | |
| Weekly Pivot | 33,410.43 | 10.13 | Yes! The Weekly Pivot is close to the High. |
| Daily R1 | 33,445.29 | 34.86 | |
| Monthly Pivot | 33,514.64 | 69.36 | |
| Daily R2 | 33,541.98 | 27.34 | |
| Weekly R1 | 33,710.26 | 168.28 | |
| Weekly R2 | 34,071.91 | 361.66 | |
| Monthly R1 | 34,091.79 | 19.87 | Yes! The Monthly R1 is close to the Weekly R2. |
| Monthly R2 | 34,834.97 | 743.19 |
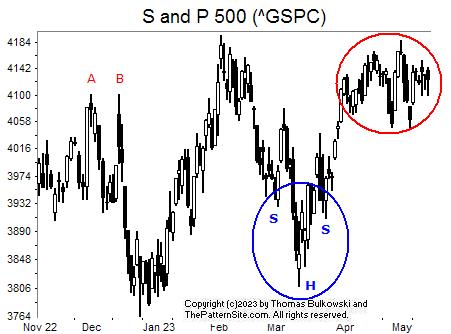
I show the S&P 500 index on the daily scale.
There's not a lot going on in this chart so I had to search for something to write about.
AB is a Adam & Adam double top. The Adam part means the peak is slender and tall. In this case, both peaks are that shape. Performance differs from Adam patterns and Eve (wide) and the combinations of Adam and Eve.
Price drops fast to a valley in December, fulfilling the measure rule target or nearly so. That's the height of the pattern subtracted from the price of the valley between the two peaks. It's not magical. It does NOT mean that price will drop that far. But it does allow us to calculate the probability of the index reaching the target.
The pattern circled in blue may look like a head-and-shoulders bottom but it's too weird looking for me to actually log it as one.
The same can be said of the red circle. Here we may have a diamond top. Again, it's too strange for it to qualify as one.
The red area is a congestion region. My guess is we'll see a drop out of that region simply because we've hit overhead resistance setup by the February peak..
![]()
The following is a brief review of how the markets performed over time. The numbers refer to the close-to-close move in the Dow industrials.
Many options expire this week, so traders will be looking to close out their positions, and that suggests increased volatility (large daily price swings).
![]()
The following is based on an SFO article in December 2004 by John Seekinger, titled, "Take a two-dimensional approach." He offers these tips.
| Index | S2 | S1 | Pivot | R1 | R2 |
| Dow Industrials (^DJI): Daily | 32,977 | 33,139 | 33,273 | 33,434 | 33,568 |
| Weekly | 32,733 | 33,017 | 33,394 | 33,678 | 34,056 |
| Monthly | 32,178 | 32,739 | 33,499 | 34,060 | 34,819 |
| S&P500 (^GSPC): Daily | 4,078 | 4,101 | 4,122 | 4,146 | 4,167 |
| Weekly | 4,070 | 4,097 | 4,126 | 4,153 | 4,181 |
| Monthly | 3,981 | 4,053 | 4,120 | 4,191 | 4,258 |
| Nasdaq (^IXIC): Daily | 12,131 | 12,208 | 12,286 | 12,363 | 12,441 |
| Weekly | 12,084 | 12,184 | 12,274 | 12,375 | 12,465 |
| Monthly | 11,584 | 11,934 | 12,149 | 12,500 | 12,715 |
Here are the formulas:
![]()
Earnings season is either underway or should be starting soon. The sessions could be more volatile.
Here's a symbol list of 148 chart and candlestick patterns (13 "investment grade" candle patterns) found in today's securities using my version of Patternz: MMM, ACN, AMD, AFL, ATSG, AKAM, ALK, ALB, AEP, AEL, AXP, AMWD, ACGL, BALL, BECN, BZH, BMRN, BKNG, BRKR, BLDR, CALM, CNP, CNA, CNX, CL, CMTL, CROX, CCRN, DHR, XRAY, ^DJT, D, DRQ, EXPI, FORM, FTNT, FDP, GME, IT, GE, GPN, GL, GS, HTLD, HL, HSY, HNI, HURC, NSP, INTC, IPG, IPI, ISRG, JKHY, JAZZ, KELYA, LNC, LXU, MHO, MANH, MCHX, MA, MTRN, MTRX, MSFT, MLKN, MUR, NBR, ^IXIC, NJR, NEWR, NWL, NKE, NUS, NTNX, OLN, PATK, PDCO, PXD, PFG, PG, PRU, DGX, RMBS, RJF, RGS, R, SLB, SMG, SMTC, SHW, SSYS, SRDX, TDY, TJX, TOL, TRV, TREX, MDRX, VMC, WU, IAI, IYK, IYC, ITB, IHE, FXL, FXI, BOTZ, QQQ, IYH, SLV, IGE, IYF, IHI, EWA, EWK, ECH, EWH, EWJ, EWM, EWS, EWD, THD, QLD, ROBO, ILF, SSO, MXI, XLY, XLP, XHB, XLB, XRT, SPY, UNG, MGK. Click this link for details (pattern type, start and end dates).
For a list of small patterns (those a few days wide) click this link.
The below industries were the best (rank 1) or worst performing of those I follow.
|
-- Thomas Bulkowski
![]()
$ $ $
Here's a symbol list of 146 chart and candlestick patterns (13 "investment grade" candle patterns) found in today's securities using my version of Patternz: ABM, AYI, AMD, AJRD, ALRM, ALK, ALB, DOX, AEE, AEL, AMWD, ABC, APOG, ANET, BERY, BSX, CPB, CNP, CRL, CINF, CTAS, CSCO, CNA, CNX, CL, CMTL, ED, CRH, CCRN, CSGS, CTS, DHR, FANG, ^DJT, D, DOV, DRQ, EMN, EIX, EMR, EOG, EZPW, FIS, FLEX, FLS, FORM, FTNT, FCX, GME, GOOGL, GPRO, HIG, HAYN, HTLD, HL, HNI, HOLX, HOV, NSP, IBKR, IPG, NVTA, JKHY, JNJ, KBH, KEYS, LXU, MHO, MCHX, MTRN, MTRX, MOS, MLI, NBR, ^IXIC, NTAP, NEWR, NXGN, NKE, OLN, OUT, PKI, PFE, PFG, PG, PEG, DGX, RMBS, RGS, RGA, ROK, R, SLB, SMG, SHOP, SCCO, SRDX, TPR, TECH, TEVA, TSCO, TZOO, TG, TREX, UIS, VRSN, VC, WU, WMB, WSM, ITA, IEZ, FXL, BOTZ, SLV, IGE, IHI, EWO, EWG, EIS, EWI, EWM, EPP, EZA, EWY, EWT, EWU, IXC, MXI, XLB, XLU. Click this link for details (pattern type, start and end dates).
For a list of small patterns (those a few days wide) click this link.
$ $ $
You can find setups based on a Fibonacci retrace by clicking on the link.
The following patterns were found manually, not using Patternz. Mr. Bulkowski has excluded any securities he owns from appearing in the list. However, he may add any of the securities listed to his portfolio at any time, just as you can.
In the table below, the red and green colors are based on the historical breakout direction for the associated chart pattern. If a high and tight flag appears, the start and end dates highlight the flagpole only and not the flag.
For details about the chart patterns, click here.
-- Thomas Bulkowski
![]()
| Symbol | Chart Pattern | Bullish Bearish | Start | End | Industry |
| AMD | Pipe bottom | 04/24/2023 | 05/01/2023 | Semiconductor | |
| ATSG | Dead-cat bounce | 05/05/2023 | 05/05/2023 | Air Transport | |
| ALB | Double Bottom, Adam and Eve | 04/21/2023 | 05/02/2023 | Chemical (Diversified) | |
| CMCO | Triangle, symmetrical | 03/24/2023 | 05/11/2023 | Machinery | |
| CAG | Triple top | 04/05/2023 | 05/03/2023 | Food Processing | |
| FORM | Pipe bottom | 04/24/2023 | 05/01/2023 | Semiconductor | |
| GMS | Pipe bottom | 04/03/2023 | 04/10/2023 | Cement and Aggregates | |
| GGG | Flag | 05/02/2023 | 05/11/2023 | Machinery | |
| HSC | Triangle, ascending | 04/04/2023 | 04/25/2023 | Diversified Co. | |
| HNI | Pipe bottom | 04/24/2023 | 05/01/2023 | Furn/Home Furnishings | |
| HUM | Pipe bottom | 04/17/2023 | 04/24/2023 | Medical Services | |
| NVTA | Pipe bottom | 03/20/2023 | 03/27/2023 | Medical Services | |
| LOW | Triangle, symmetrical | 04/21/2023 | 05/11/2023 | Retail Building Supply | |
| MTRN | Horn top | 04/17/2023 | 05/01/2023 | Metals and Mining (Div.) | |
| ^IXIC | Roof, inverted | 04/03/2023 | 05/05/2023 | None | |
| NEWR | Pipe bottom | 04/24/2023 | 05/01/2023 | E-Commerce | |
| OXM | Double Bottom, Adam and Adam | 04/27/2023 | 05/04/2023 | Apparel | |
| PKE | Three Falling Peaks | 04/03/2023 | 05/03/2023 | Chemical (Specialty) | |
| ROK | Double Top, Adam and Adam | 04/28/2023 | 05/08/2023 | Diversified Co. | |
| ROL | Pennant | 04/28/2023 | 05/09/2023 | Industrial Services | |
| TDY | Pennant | 04/26/2023 | 05/11/2023 | Aerospace/Defense | |
| XLK | Roof, inverted | 03/31/2023 | 05/08/2023 | IT Services |
![]()
Since I post this the night before, check how the futures are trading before market open. Large moves can affect the opening direction.
$ $ $
Bigcharts.com apparently is down, so I'm showing a quiz instead of the intraday chart.
$ $ $
I show another slider trading quiz featuring Waters Corp: WAT stock.
$ $ $
Here's a symbol list of 183 chart and candlestick patterns (13 "investment grade" candle patterns) found in today's securities using my version of Patternz: ANF, AYI, AMD, ALK, ALB, ALGT, AMZN, AEL, AXP, AFG, AMWD, ADM, AGO, BERY, BIO, BMRN, BA, BOOT, BCO, BR, BRKR, CE, CNP, CENX, CVX, CINF, CTAS, CLNE, CLF, CNA, CNX, CL, CMTL, CAG, CONN, CXW, CCRN, CMI, DECK, FANG, DDS, DFS, ^DJT, D, DOV, DTE, EMN, ELV, EMR, EOG, XOM, EZPW, FIS, FISV, FLS, FORM, FTNT, FCX, GME, GE, GL, GOOGL, GES, HIG, HTLD, HL, HP, HNI, HOLX, HUM, HUN, IDA, IBKR, TILE, IPG, JKHY, KALU, LLY, RAMP, LPLA, LXU, M, MCHX, MKTX, MTRN, MTRX, MLKN, MS, MUR, NBR, ^IXIC, NFG, NTAP, NEWR, NEE, NXGN, NKE, NI, OLN, OMCL, PTEN, PYPL, PXD, PFG, PG, RL, RMBS, RRC, REGN, RGS, ROK, ROG, ROST, R, SBH, SMG, SHOP, SMAR, SCCO, LUV, SWN, SPSC, SRDX, SNPS, TPR, TECH, TPX, TKR, TJX, TG, TREX, UPS, UNH, VFC, VEEV, WMT, WU, WLK, WEX, WMB, WSM, ITA, IYE, IEZ, QTEC, BOTZ, IAT, IGV, SLV, IGE, IHI, EWO, EWK, EIS, EWW, EZA, PBE, PEJ, PJP, ILF, SSO, MXI, XLP, XLE, XLF, XLB. Click this link for details (pattern type, start and end dates).
For a list of small patterns (those a few days wide) click this link.
$ $ $
The following table shows where Fibonacci retrace values of the day's high-low range are plus pivot points, calculated on the Nasdaq composite, sorted by value. When several are near each other (small differences), the area might act as support or resistance.
-- Thomas Bulkowski
![]()
| © 2023 ThePatternSite.com Metric | Value | Diff | Close (within 10% of the high-low range for the day)? |
| Monthly S2 | 11,657.29 | ||
| Weekly S2 | 11,826.09 | 168.80 | |
| Monthly S1 | 11,981.86 | 155.78 | |
| Weekly S1 | 12,066.26 | 84.40 | |
| Daily S2 | 12,118.17 | 51.90 | |
| Monthly Pivot | 12,123.35 | 5.18 | Yes! The Monthly Pivot is close to the Daily S2. |
| Weekly Pivot | 12,165.55 | 42.20 | |
| Low | 12,180.86 | 15.31 | Yes! The Low is close to the Weekly Pivot. |
| Daily S1 | 12,212.30 | 31.44 | |
| 61.8% Down from Intraday High | 12,240.77 | 28.47 | |
| 50% Down from Intraday High | 12,259.28 | 18.51 | |
| Daily Pivot | 12,275.00 | 15.72 | |
| 38.2% Down from Intraday High | 12,277.78 | 2.78 | Yes! The 38.2% Down from Intraday High is close to the Daily Pivot. |
| Open | 12,286.70 | 8.92 | Yes! The Open is close to the 38.2% Down from Intraday High. |
| Close | 12,306.44 | 19.74 | |
| High | 12,337.69 | 31.25 | |
| Daily R1 | 12,369.13 | 31.44 | |
| Weekly R1 | 12,405.72 | 36.59 | |
| Daily R2 | 12,431.83 | 26.10 | |
| Monthly R1 | 12,447.92 | 16.10 | |
| Weekly R2 | 12,505.01 | 57.08 | |
| Monthly R2 | 12,589.41 | 84.40 |
This is a picture of the chart pattern indicator on the daily scale. The indicator is the line chart below a chart of the S&P 500 composite.
The indicator has turned from bearish to neutral. That's an improvement, but is it enough?
No. Why not?
Because the debt ceiling fight will roil the markets in the weeks to come. So I don't put much importance on the improvement
The red line is the percentage of stocks at least 20% below their 1-year high (plotted upside down). The blue line is the average percentage drop of stocks below their 1-year high (plotted upside down).
On Tuesday, 43% of stocks in my database are in bear market territory (down at least 20% from their 1-year high).A week ago, it was 43%.The fewest was 32% on 02/02/2023.And the most was 81% on 06/17/2022.
The 519 stocks in my database are down an average of 20% from their yearly high.A week ago, the average was 20%.The peak was 16% on 02/02/2023.And the bottom was 34% on 09/30/2022.
The red and blue lines show no improvement this week compared to a week ago. It's as if the indicators are waiting for a new development.
The two charts show a waiting pattern. Call it neutral with a hint of bullishness (from the CPI chart).
Again, my worry is that the debt ceiling will crater the markets.
$ $ $
Here's a symbol list of 148 chart and candlestick patterns (13 "investment grade" candle patterns) found in today's securities using my version of Patternz: MMM, AMD, A, ALB, AA, AEO, AEP, AEL, AMWD, ABC, AMN, APH, ANIK, ANET, ASH, AVNT, AVA, BIG, BIO, BMRN, BRKR, BG, CBT, CALM, CPB, CE, CX, CNP, CENX, CRL, CIEN, CSCO, CLNE, CNA, CNX, CTSH, CL, CMCO, CMTL, CONN, COTY, CCRN, CCK, CMI, DECK, DRQ, ELV, EME, EMR, EQT, EVH, FMC, FORM, FTNT, GME, GPN, GFS, GOOGL, GPRO, HBI, HE, HQY, HTLD, HSIC, HNI, HUM, HUN, IIIN, TILE, IPG, JKHY, KALU, KFRC, KBAL, LXU, MHO, MTSI, MCHX, MLM, MTRN, MTRX, MOS, MLI, NEWR, OTEX, OMI, OXM, PANW, PKE, PYPL, PETS, PG, RMBS, RRC, RGS, RLI, RHI, ROG, CRM, SLB, SMG, SIGI, SCI, SKYW, SCCO, SRDX, TECH, TMO, RIG, TREX, SLCA, UNH, WAT, WERN, WLK, WMB, WSM, WSC, IAT, IYZ, IHI, EWZ, EWJ, EWM, EZA, EWL, THD, PJP, ILF, SSO, XLP, USO. Click this link for details (pattern type, start and end dates).
For a list of small patterns (those a few days wide) click this link.
-- Thomas Bulkowski
![]()
$ $ $
I show another slider trading quiz featuring TXU: TXU stock.
$ $ $
Here's a symbol list of 140 chart and candlestick patterns (13 "investment grade" candle patterns) found in today's securities using my version of Patternz: MMM, ABM, ADTN, AES, ATSG, ALGT, AEL, APH, ASH, ADP, BSET, BAX, BIG, BIO, BA, BKNG, BOOT, BRC, BRKR, BBW, BLDR, BG, CBT, CACI, CALM, CAL, CNP, CTSH, CL, CMCO, COTY, CCK, CMI, DOV, BOOM, EME, EMR, EPAM, FARO, FMC, FTNT, FRD, GPS, GE, GILD, HSC, HSII, HON, HUM, HURC, ITW, ILMN, IBP, IBKR, TILE, IPG, NVTA, K, KELYA, KBAL, LDOS, LLY, LMT, MANH, MCHX, MRCY, MGEE, MOS, MUR, ^IXIC, NOV, NXGN, NOC, NWPX, OXY, OMC, OTEX, OMI, PANW, PCTY, PKI, PETS, POR, PG, RL, RTX, RGS, RLI, RHI, ROK, ROG, CRM, SCHW, SAIC, SIGI, SRE, SKYW, SCCO, SRDX, TPR, TRGP, TEVA, TXT, TKR, RIG, TWLO, UIS, UPS, VMI, VMC, WERN, WLK, WMB, WSM, ITA, FXI, IAT, IHI, EWO, EWC, ECH, EWM, EWS, EWL, THD, IBB, PXJ, USO. Click this link for details (pattern type, start and end dates).
For a list of small patterns (those a few days wide) click this link.
$ $ $
The following table shows where Fibonacci retrace values of the day's high-low range are plus pivot points, calculated on the Dow industrials, sorted by value. When several are near each other (small differences), the area might act as support or resistance.
-- Thomas Bulkowski
![]()
| © 2023 ThePatternSite.com Metric | Value | Diff | Close (within 10% of the high-low range for the day)? |
| Monthly S2 | 32,284.34 | ||
| Weekly S2 | 32,284.34 | 0.00 | Yes! The Weekly S2 is close to the Monthly S2. |
| Weekly S1 | 32,951.52 | 667.17 | |
| Monthly S1 | 32,951.52 | 0.00 | Yes! The Monthly S1 is close to the Weekly S1. |
| Daily S2 | 33,386.88 | 435.36 | |
| Daily S1 | 33,502.79 | 115.91 | |
| Low | 33,509.23 | 6.45 | Yes! The Low is close to the Daily S1. |
| 61.8% Down from Intraday High | 33,600.25 | 91.02 | |
| Weekly Pivot | 33,604.67 | 4.43 | Yes! The Weekly Pivot is close to the 61.8% Down from Intraday High. |
| Monthly Pivot | 33,604.67 | 0.00 | Yes! The Monthly Pivot is close to the Weekly Pivot. |
| Close | 33,618.69 | 14.02 | Yes! The Close is close to the Monthly Pivot. |
| Daily Pivot | 33,625.14 | 6.45 | Yes! The Daily Pivot is close to the Close. |
| 50% Down from Intraday High | 33,628.36 | 3.22 | Yes! The 50% Down from Intraday High is close to the Daily Pivot. |
| 38.2% Down from Intraday High | 33,656.48 | 28.12 | |
| Open | 33,715.15 | 58.67 | |
| Daily R1 | 33,741.04 | 25.89 | |
| High | 33,747.49 | 6.45 | Yes! The High is close to the Daily R1. |
| Daily R2 | 33,863.40 | 115.91 | |
| Weekly R1 | 34,271.85 | 408.45 | |
| Monthly R1 | 34,271.85 | 0.00 | Yes! The Monthly R1 is close to the Weekly R1. |
| Monthly R2 | 34,925.00 | 653.16 | |
| Weekly R2 | 34,925.00 | 0.00 | Yes! The Weekly R2 is close to the Monthly R2. |
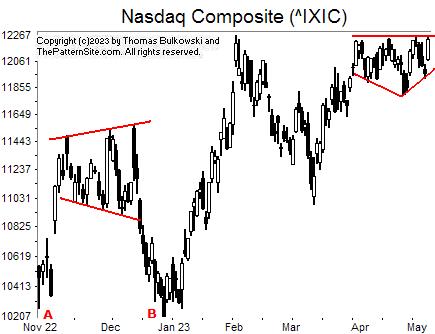
At point A, we see the index launch upward in a powerful move higher. Then it consolidates and forms a broadening top chart pattern.
After the broadening top ends, notice that price returns to the launch price at B. I see this behavior (where A and B are about equal, often with B slightly above A) most often with diamond tops.
More recently, we see what I call an inverted roof. It looks like a head-and-shoulders bottom except that price enters the pattern from the bottom and not the top. Often with the IRoof, you'll see uneven shoulders (minor lows) so that it doesn't resemble a head-and-shoulders at all. That's the best case. This roof looks like a H&S variation, and not really a new type of chart pattern.
![]()
The following is a brief review of how the markets performed over time. The numbers refer to the close-to-close move in the Dow industrials.
No options expire this week.
![]()
The following is based on an SFO article in December 2004 by John Seekinger, titled, "Take a two-dimensional approach." He offers these tips.
| Index | S2 | S1 | Pivot | R1 | R2 |
| Dow Industrials (^DJI): Daily | 33,057 | 33,366 | 33,557 | 33,866 | 34,057 |
| Weekly | 32,303 | 32,989 | 33,623 | 34,309 | 34,944 |
| Monthly | 32,303 | 32,989 | 33,623 | 34,309 | 34,944 |
| S&P500 (^GSPC): Daily | 4,060 | 4,098 | 4,123 | 4,161 | 4,185 |
| Weekly | 3,985 | 4,061 | 4,124 | 4,199 | 4,262 |
| Monthly | 3,985 | 4,061 | 4,124 | 4,199 | 4,262 |
| Nasdaq (^IXIC): Daily | 11,990 | 12,112 | 12,189 | 12,312 | 12,388 |
| Weekly | 11,802 | 12,019 | 12,142 | 12,358 | 12,481 |
| Monthly | 11,634 | 11,935 | 12,100 | 12,401 | 12,566 |
Here are the formulas:
![]()
Earnings season is either underway or should be starting soon. The sessions could be more volatile.
Here's a symbol list of 149 chart and candlestick patterns (13 "investment grade" candle patterns) found in today's securities using my version of Patternz: ANF, ACN, AEIS, AMD, ATSG, ALL, APOG, ATR, ANET, AXS, AZTA, BSET, BAX, BRKR, CALM, CPB, CLS, CX, CNP, CHKP, CTAS, CLF, CNX, CL, COTY, CRH, DDS, DFS, DSGR, ^DJI, DOV, DTE, EME, EPAM, FIS, FISV, FORM, FTV, FCX, GME, GILD, GMS, GS, GES, HSC, HAYN, HSII, HSY, HNI, HUM, HUN, IEX, INFN, IIIN, PODD, TILE, IPI, NVTA, KLAC, LH, LRCX, LNC, MAN, MA, MTRX, MDT, MGEE, MS, MLI, ^IXIC, NOV, NCR, NXGN, NKE, JWN, OGE, OTEX, OUT, OMI, OXM, PDCO, PTEN, PCTY, PKI, PLXS, POR, PG, QTWO, RL, RMBS, RNG, RLI, SAIC, SIGI, SO, SWX, SPLK, SXI, SRDX, TPR, TRGP, TGT, TDC, TRV, TG, UHAL, UNM, VFC, VLO, VECO, VC, WMT, WU, WEX, WSC, WOLF, IYC, IDU, QTEC, BOTZ, IHI, EWK, EWC, EWG, EWJ, EWM, EWP, TUR, PEJ, PXJ, PHO, ROBO, XRT, XAR, XLU, SMH, VIS, MGK. Click this link for details (pattern type, start and end dates).
For a list of small patterns (those a few days wide) click this link.
The below industries were the best (rank 1) or worst performing of those I follow.
|
-- Thomas Bulkowski
![]()
$ $ $
Here's a symbol list of 193 chart and candlestick patterns (13 "investment grade" candle patterns) found in today's securities using my version of Patternz: AYI, ADBE, AFL, APD, ATSG, AEO, AXP, ANIK, APA, APOG, ASH, ATO, ADSK, AVNT, AXS, AZTA, BALL, BAX, BERY, BA, BKNG, BSX, BFH, BCO, CNP, CHS, CI, CNO, CTSH, CL, CMCO, CMTL, CAG, GLW, CR, CRH, CCK, DDS, DFS, DSGR, ^DJT, ^DJI, EPAM, EQT, EVH, FARO, FORM, FTNT, FWRD, FCX, FRD, GNW, GILD, GS, GES, HSC, HQY, HSII, HNI, HOLX, HUM, IEX, IDXX, INCY, INFN, ITGR, IPG, IPI, NVTA, JKHY, JNJ, KELYA, KMB, KSS, LH, LEG, LNC, LPLA, MTSI, MGY, MAN, MCHX, MRTN, MLM, MTDR, MDC, MLKN, MS, MOS, NEWR, NXGN, NKE, NWPX, OGE, ASGN, OTEX, OUT, OMI, PKE, PATK, PDCO, PXD, PLXS, PPG, PFG, PG, PRU, QTWO, QCOM, DGX, RJF, RTX, RGS, RGA, RLI, RCKY, ROP, ^GSPC, SBH, SCHW, SAIC, SMG, SEIC, SIGI, SRE, SMTC, SWN, SUM, TPR, TRGP, TDY, TXT, TMO, TKR, TZOO, UPS, UNM, VMC, WSM, WOLF, WWW, XEL, ITA, IAI, IYC, IEZ, IDU, DDM, IHF, IAT, IYZ, IGE, IYF, IHI, EWQ, EWI, EWJ, PPA, DBA, PBE, PEJ, PXJ, PJP, IXC, SSO, MXI, XLF, XLB, SPY, XAR, XLU, UNG. Click this link for details (pattern type, start and end dates).
For a list of small patterns (those a few days wide) click this link.
$ $ $
You can find setups based on a Fibonacci retrace by clicking on the link.
The following patterns were found manually, not using Patternz. Mr. Bulkowski has excluded any securities he owns from appearing in the list. However, he may add any of the securities listed to his portfolio at any time, just as you can.
In the table below, the red and green colors are based on the historical breakout direction for the associated chart pattern. If a high and tight flag appears, the start and end dates highlight the flagpole only and not the flag.
For details about the chart patterns, click here.
-- Thomas Bulkowski
![]()
| Symbol | Chart Pattern | Bullish Bearish | Start | End | Industry |
| MMM | Triple top | 04/18/2023 | 05/01/2023 | Diversified Co. | |
| ALL | Head-and-shoulders top | 04/12/2023 | 05/01/2023 | Insurance (Prop/Casualty) | |
| AYX | Dead-cat bounce | 04/28/2023 | 04/28/2023 | Computer Software and Svcs | |
| AFG | Head-and-shoulders top | 04/04/2023 | 05/01/2023 | Insurance (Prop/Casualty) | |
| AIG | Double Top, Adam and Adam | 04/19/2023 | 05/01/2023 | Insurance (Prop/Casualty) | |
| AME | Double Bottom, Adam and Adam | 04/10/2023 | 04/26/2023 | Industrial Services | |
| APOG | Double Top, Adam and Eve | 04/03/2023 | 04/19/2023 | Building Materials | |
| BCO | Double Top, Adam and Eve | 04/03/2023 | 04/14/2023 | Industrial Services | |
| BMY | Double Top, Eve and Eve | 04/06/2023 | 04/25/2023 | Drug | |
| BR | Double Bottom, Adam and Adam | 04/06/2023 | 04/26/2023 | Information Services | |
| CACI | Ugly double bottom | 03/17/2023 | 04/26/2023 | IT Services | |
| CCK | Triple bottom | 03/17/2023 | 04/17/2023 | Packaging and Container | |
| ^DJU | Double Top, Eve and Eve | 04/12/2023 | 04/25/2023 | None | |
| ^DJI | Double Top, Eve and Adam | 04/14/2023 | 05/01/2023 | None | |
| EL | Dead-cat bounce | 05/03/2023 | 05/03/2023 | Toiletries/Cosmetics | |
| EVH | Double Top, Adam and Eve | 04/24/2023 | 05/01/2023 | Healthcare Information | |
| EXPI | Double Top, Eve and Eve | 03/31/2023 | 04/14/2023 | E-Commerce | |
| FARO | Dead-cat bounce | 05/04/2023 | 05/04/2023 | Precision Instrument | |
| FIS | Double Top, Adam and Adam | 04/18/2023 | 04/27/2023 | Computer Software and Svcs | |
| FLS | Double Bottom, Adam and Adam | 04/10/2023 | 04/26/2023 | Machinery | |
| GILD | Pipe top | 04/17/2023 | 04/24/2023 | Biotechnology | |
| GGG | Double Bottom, Eve and Adam | 04/10/2023 | 04/26/2023 | Machinery | |
| HBI | Rectangle bottom | 03/13/2023 | 05/03/2023 | Apparel | |
| HAYN | Double Top, Adam and Adam | 04/04/2023 | 04/19/2023 | Building Materials | |
| IBP | Double Top, Adam and Eve | 04/20/2023 | 05/01/2023 | Retail Building Supply | |
| L | Triple bottom | 04/05/2023 | 04/26/2023 | Insurance (Prop/Casualty) | |
| MAS | Double Bottom, Eve and Adam | 03/24/2023 | 04/06/2023 | Building Materials | |
| MTRN | Broadening top | 03/31/2023 | 05/04/2023 | Metals and Mining (Div.) | |
| MRCY | Dead-cat bounce | 05/03/2023 | 05/03/2023 | Computers and Peripherals | |
| MU | Triangle, ascending | 03/29/2023 | 05/04/2023 | Semiconductor | |
| MUR | Double Top, Adam and Adam | 04/03/2023 | 04/11/2023 | Petroleum (Integrated) | |
| OMCL | Double Bottom, Adam and Adam | 04/19/2023 | 04/27/2023 | Healthcare Information | |
| RTX | Head-and-shoulders top | 04/04/2023 | 05/01/2023 | Aerospace/Defense | |
| RCKY | Dead-cat bounce | 05/03/2023 | 05/03/2023 | Shoe | |
| SCI | Double Top, Eve and Adam | 04/12/2023 | 05/01/2023 | Industrial Services | |
| SUM | Head-and-shoulders bottom | 03/16/2023 | 04/26/2023 | Cement and Aggregates | |
| TPR | Double Top, Eve and Adam | 04/03/2023 | 04/20/2023 | Apparel | |
| TRGP | Head-and-shoulders top | 04/03/2023 | 04/24/2023 | Natural Gas (Diversified) | |
| VFC | Double Top, Adam and Adam | 04/14/2023 | 04/28/2023 | Apparel | |
| V | Head-and-shoulders top | 04/14/2023 | 05/01/2023 | Financial Services |
![]()
Since I post this the night before, check how the futures are trading before market open. Large moves can affect the opening direction.
$ $ $
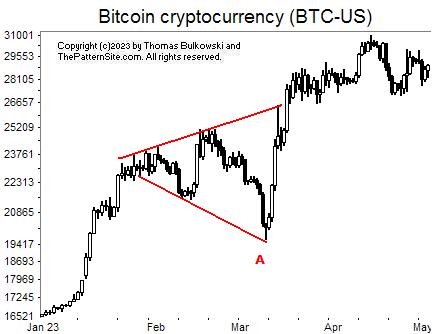
I show a picture of the bitcoin (BTC-USD) on the daily scale.
At point A is a chart pattern called a broadening top. The breakout is upward 60% of the time and that's what we see here. A breakout occurs when price closes either above the top or below the bottom of the chart pattern.
After the breakout, the currency has struggled to move higher. To me, that suggests the coin could drop, but that's just a guess. Sometimes, it means it's gathering strength before a strong push higher. I'd be cautious, though. This could develop into a trap (bearish top trap).
$ $ $
Here's a symbol list of 200 chart and candlestick patterns (13 "investment grade" candle patterns) found in today's securities using my version of Patternz: ACN, ATSG, AKAM, AA, ALL, AXP, AFG, ABC, AME, AR, AAPL, AMAT, ADM, ANET, ASH, AIZ, AVY, AXS, AZTA, BMI, BAX, BZH, BERY, BA, BKNG, BSX, BCO, BR, BBW, BLDR, CDNS, CE, CNP, CVX, CHS, CIEN, CTAS, CSCO, CLF, CNO, CL, CMTL, CAG, GLW, CRH, DVN, FANG, DDS, ^DJI, EXP, EMN, EIX, EMR, EQT, EL, XOM, FDS, FMC, FCX, FDP, FRD, GD, GNW, GILD, GS, GES, THG, HAYN, HQY, HUM, ITW, INCY, INFN, PODD, INTU, NVTA, IRM, JNJ, KMB, KSS, LAMR, LLY, LOW, LPLA, MHO, MCHX, MTDR, MRCY, MLKN, MCO, MS, MOS, MUR, NXGN, JWN, OXY, OMC, OMI, OXM, PKE, PTEN, PPG, PG, PRU, PHM, QTWO, KWR, RJF, RTX, RLI, RCKY, ROP, ^GSPC, CRM, SAIC, SMG, SEE, SEIC, SCI, STR, SKX, SMAR, SWN, SSYS, TXT, TKR, TSCO, TRV, TZOO, UGI, UIS, UNM, VEEV, VRSN, VC, WAT, WU, WOLF, XEL, ITA, IYM, IAI, IYE, ITB, DDM, FXI, IYZ, IGV, SOXX, IGE, IEO, IYF, IHI, EWA, EWO, EWC, EEM, EWH, EWI, EPP, EWS, EWL, TUR, PXJ, ROBO, IXC, SSO, MXI, XLE, XLF, XHB, SPY, XLK, UNG, USO. Click this link for details (pattern type, start and end dates).
For a list of small patterns (those a few days wide) click this link.
$ $ $
The following table shows where Fibonacci retrace values of the day's high-low range are plus pivot points, calculated on the Nasdaq composite, sorted by value. When several are near each other (small differences), the area might act as support or resistance.
-- Thomas Bulkowski
![]()
| © 2023 ThePatternSite.com Metric | Value | Diff | Close (within 10% of the high-low range for the day)? |
| Monthly S2 | 11,358.20 | ||
| Weekly S2 | 11,588.32 | 230.13 | |
| Monthly S1 | 11,691.76 | 103.44 | |
| Weekly S1 | 11,806.83 | 115.06 | |
| Daily S2 | 11,896.69 | 89.86 | |
| Daily S1 | 11,961.01 | 64.32 | |
| Monthly Pivot | 11,968.60 | 7.59 | Yes! The Monthly Pivot is close to the Daily S1. |
| Weekly Pivot | 12,017.27 | 48.68 | |
| Low | 12,022.46 | 5.19 | Yes! The Low is close to the Weekly Pivot. |
| Close | 12,025.33 | 2.87 | Yes! The Close is close to the Low. |
| Daily Pivot | 12,086.78 | 61.45 | |
| 61.8% Down from Intraday High | 12,095.07 | 8.29 | Yes! The 61.8% Down from Intraday High is close to the Daily Pivot. |
| Open | 12,097.04 | 1.97 | Yes! The Open is close to the 61.8% Down from Intraday High. |
| 50% Down from Intraday High | 12,117.50 | 20.46 | |
| 38.2% Down from Intraday High | 12,139.94 | 22.43 | |
| Daily R1 | 12,151.10 | 11.16 | Yes! The Daily R1 is close to the 38.2% Down from Intraday High. |
| High | 12,212.55 | 61.45 | |
| Weekly R1 | 12,235.78 | 23.23 | |
| Daily R2 | 12,276.87 | 41.09 | |
| Monthly R1 | 12,302.16 | 25.29 | |
| Weekly R2 | 12,446.22 | 144.06 | |
| Monthly R2 | 12,579.00 | 132.77 |
$ $ $
A quick note: Within the next month, until the politicians see fit to raise the US debt limit, expect large swings in the market. If they don't agree, the market is going to crash.
You might want to view this as an opportunity to buy the dip on large down moves. If they don't agree on a limit, then I don't know how far we'll drop, but it's going to be breathtaking. In 1987, we dropped 22% in one session, 31% in three sessions. So maybe a third, 33% this time.
$ $ $
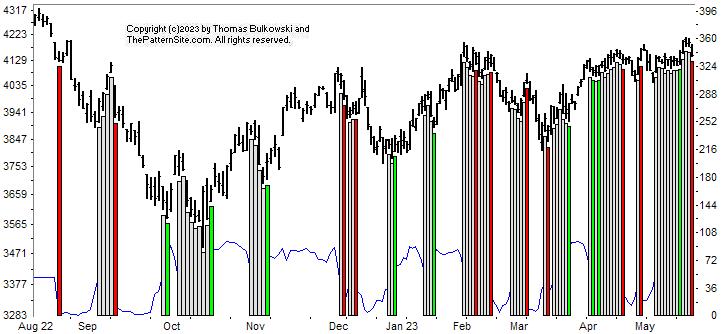
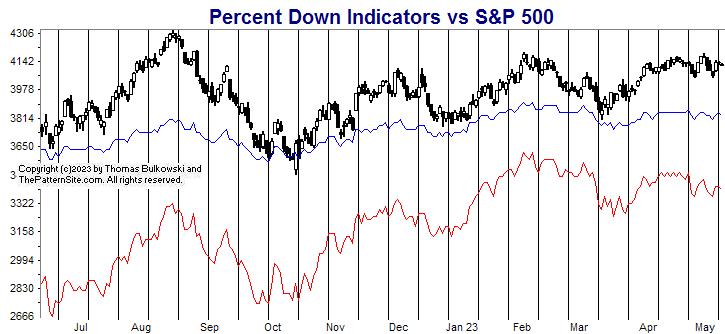
This is a picture of the chart pattern indicator on the daily scale. The indicator is the line chart below a chart of the S&P 500 composite.
Notice that the indicator has turned bearish and that's not good news. Of course, large swings in the market push the CPI around. The indicator can change for up to a week, but as the above note indicates, this month is going to be bumpy.
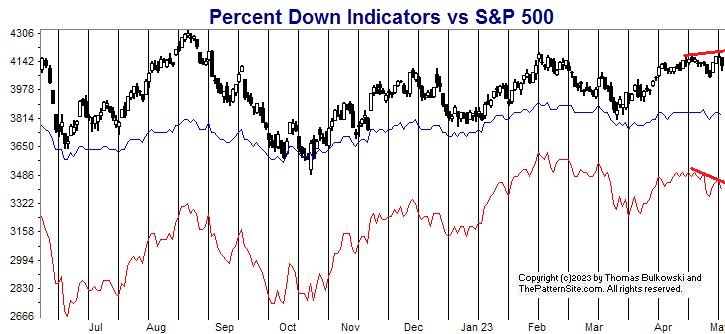
The red line is the percentage of stocks at least 20% below their 1-year high (plotted upside down). The blue line is the average percentage drop of stocks below their 1-year high (plotted upside down).
On Tuesday, 43% of stocks in my database are in bear market territory (down at least 20% from their 1-year high).A week ago, it was 44%.The fewest was 32% on 02/02/2023.And the most was 81% on 06/17/2022.
The 519 stocks in my database are down an average of 20% from their yearly high.A week ago, the average was 21%.The peak was 16% on 02/02/2023.And the bottom was 34% on 09/30/2022.
Both lines show marginal improvement over a week ago, but I think that's a fluke. The thin red line shows a lower peak even as price makes a new high. The thicker red lines show the bearish divergence between the indicator and the index.
So even though the numbers above are positive, this development is bearish.
Both charts are either bearish or hinting of being bearish. So expect the market to drop or continue lower.
$ $ $
Here's a symbol list of 148 chart and candlestick patterns (13 "investment grade" candle patterns) found in today's securities using my version of Patternz: ACN, ATSG, ALB, AEO, AEP, AME, AR, AAPL, ADM, ATO, ADSK, BAX, BKH, BCO, BR, CDNS, CNP, CVX, CLNE, CTSH, CL, COST, CRH, DVN, DFS, D, DTE, EIX, ELV, FLS, FORM, FDP, FRD, GPS, GNW, GILD, HBI, THG, HAYN, HQY, HSIC, HOV, HUM, HURC, IBKR, INTU, NVTA, JNJ, KSS, LZB, LEN, LOW, MTSI, MRO, MCHX, MKTX, MTDR, META, MLKN, MS, MUR, NCR, NFLX, NTAP, NXGN, NI, JWN, NWPX, OXY, OGE, PTEN, PRFT, PNW, PG, PEG, QTWO, RL, RJF, REGN, RNG, RLI, RCKY, CRM, SEE, STR, SO, SWN, SSYS, SNPS, TPR, TECH, TSCO, RIG, UHAL, UGI, VFC, VEEV, VC, WSM, WWD, WDAY, XEL, ITA, IYE, IEZ, IDU, IYZ, IGV, SOXX, IGE, IEO, IHI, EIS, EWI, EWJ, EWP, TUR, PXJ, IXC, ILF, MXI, XLE, XLF, XRT, XLK, XLU, UNG, USO. Click this link for details (pattern type, start and end dates).
For a list of small patterns (those a few days wide) click this link.
-- Thomas Bulkowski
![]()
$ $ $
I show another slider trading quiz featuring Watsco: WSO stock.
$ $ $
Here's a symbol list of 96 chart and candlestick patterns (13 "investment grade" candle patterns) found in today's securities using my version of Patternz: AXDX, AEIS, ALB, ALKS, ALL, AYX, AMED, AEL, AXP, AFG, AAPL, ADSK, AZTA, BAX, BECN, BOOT, BCO, BBW, CLS, CNP, CF, CHKP, CL, CMTL, COST, CROX, BOOM, ELV, EZPW, FE, FIVN, FCX, GPS, GGG, GFF, HLIT, HAYN, HSIC, HSY, HURC, INCY, PODD, IBKR, IPG, IPI, KFRC, LANC, LDOS, L, LXU, MHO, MDC, META, MS, MOS, NTAP, NXGN, NOVT, NVDA, OXM, PPL, PG, RL, RGS, RCKY, ROP, SBH, SO, TDC, UGI, VFC, VMI, VEEV, VC, WWW, FTEC, FXL, IYZ, IHI, EWA, EWO, EWZ, EIS, TUR, GLD, XRT, XLK, SMH. Click this link for details (pattern type, start and end dates).
For a list of small patterns (those a few days wide) click this link.
$ $ $
The following table shows where Fibonacci retrace values of the day's high-low range are plus pivot points, calculated on the Dow industrials, sorted by value. When several are near each other (small differences), the area might act as support or resistance.
-- Thomas Bulkowski
![]()
| © 2023 ThePatternSite.com Metric | Value | Diff | Close (within 10% of the high-low range for the day)? |
| Monthly S2 | 31,021.10 | ||
| Monthly S1 | 32,536.40 | 1,515.30 | |
| Weekly S2 | 32,928.66 | 392.26 | |
| Monthly Pivot | 33,320.48 | 391.82 | |
| Weekly S1 | 33,490.18 | 169.70 | |
| Weekly Pivot | 33,797.37 | 307.19 | |
| Daily S2 | 33,885.54 | 88.16 | |
| Daily S1 | 33,968.62 | 83.08 | |
| Low | 34,030.14 | 61.52 | |
| Close | 34,051.70 | 21.56 | Yes! The Close is close to the Low. |
| Daily Pivot | 34,113.22 | 61.52 | |
| Open | 34,116.81 | 3.59 | Yes! The Open is close to the Daily Pivot. |
| 61.8% Down from Intraday High | 34,117.12 | 0.31 | Yes! The 61.8% Down from Intraday High is close to the Open. |
| 50% Down from Intraday High | 34,143.98 | 26.87 | |
| 38.2% Down from Intraday High | 34,170.85 | 26.87 | |
| Daily R1 | 34,196.30 | 25.45 | |
| High | 34,257.83 | 61.52 | |
| Daily R2 | 34,340.91 | 83.09 | |
| Weekly R1 | 34,358.89 | 17.98 | Yes! The Weekly R1 is close to the Daily R2. |
| Weekly R2 | 34,666.08 | 307.19 | |
| Monthly R1 | 34,835.78 | 169.70 | |
| Monthly R2 | 35,619.86 | 784.08 |
Here's the updated 2023 forecast, presented in slider format.
$ $ $
Based on sector performance from Fidelity, the best performing sectors for year-to-date performance as of 4/28/2023 were... (The numbering is how they ranked a month ago.)
The folks at two firms polled by Fidelity weigh the sectors in this order, as of 4/21/23.
Here's how they rank the industries, but only the top 10 appear. One-year change, as of 4/27/23. The numbering is how they ranked a month ago.
Here's a symbol list of 108 chart and candlestick patterns (13 "investment grade" candle patterns) found in today's securities using my version of Patternz: ABT, AJRD, ALL, AYX, AMED, AEL, AMWD, ANIK, AAPL, ARW, ASH, AVY, BAX, BZH, BMY, BBW, BLDR, CBT, CPB, CLS, CNP, CF, CLNE, CL, CXW, GLW, COTY, XRAY, FANG, DSGR, DRQ, ELV, FARO, FDX, FE, FCX, GFF, HLIT, HOLX, HWM, HUBG, HUN, INTC, TILE, KFRC, LPLA, MAS, MA, MTRX, MDC, MU, MYGN, ^IXIC, NTGR, NTAP, NWL, NEE, NXGN, OMI, OXM, PKG, PEN, PG, PGR, PHM, DGX, REGN, RGS, RCKY, ROG, ROP, SMAR, TDY, TOL, TSCO, TZOO, SLCA, UNH, VRSN, WRB, WU, WMB, WWW, IYK, ITB, IEZ, IYH, IGE, IHI, EWZ, EWW, EWS, EWT, TUR. Click this link for details (pattern type, start and end dates).
For a list of small patterns (those a few days wide) click this link.
The below industries were the best (rank 1) or worst performing of those I follow.
|
-- Thomas Bulkowski
![]()
Support this site! Clicking any of the books (below) takes you to
Amazon.com If you buy ANYTHING while there, they pay for the referral.
Legal notice for paid links: "As an Amazon Associate I earn from qualifying purchases."
|
My Stock Market Books
|
My Novels
Orb Foresight Rewrite Coming!
|