
As of 04/17/2026
Indus: 49,447 +868.71 +1.8%
Trans: 22,422 +609.39 +2.8%
Utils: 1,158 -6.73 -0.6%
Nasdaq: 24,468 +365.78 +1.5%
S&P 500: 7,126 +84.78 +1.2%
|
YTD
+2.9%
+29.2%
+8.4%
+5.3%
+4.1%
|
|
As of 04/17/2026
Indus: 49,447 +868.71 +1.8%
Trans: 22,422 +609.39 +2.8%
Utils: 1,158 -6.73 -0.6%
Nasdaq: 24,468 +365.78 +1.5%
S&P 500: 7,126 +84.78 +1.2%
|
YTD
+2.9%
+29.2%
+8.4%
+5.3%
+4.1%
| |
|
| ||
$ $ $
Here's a symbol list of 171 chart and candlestick patterns (13 "investment grade" candle patterns) found in today's securities using my version of Patternz: DDD, ANF, ALKS, DOX, AMED, AEL, AIG, AMWD, AME, AR, ASH, AIZ, AGO, AVNT, AXS, BALL, BSET, BFH, BRKR, CBT, CX, CNP, CDAY, CHKP, CHS, CLNE, CNO, CGNX, CMTL, CSGP, CCRN, CTS, DSGR, DTE, DUK, BOOM, EME, EQT, EXPI, FDS, FAST, FE, FLS, FTNT, FTV, FNV, GIS, THG, HE, HAYN, HSII, HSIC, HON, HWM, HUBG, HUM, HURC, IEX, INCY, NSP, IBP, IIIN, INTC, IPI, INTU, ISRG, IRM, JNJ, KMT, LANC, LNC, MCHX, MAS, MTRN, MTRX, MU, MLKN, MS, MLI, MYGN, NCR, NTGR, NEWR, NXGN, JWN, OMCL, ORCL, OR, PKG, PKE, PATK, PAYX, PCG, PPG, PPL, PINC, PRU, RRC, REGN, RGS, RNG, ROL, ROST, SBH, SCHW, SMG, SHW, SHOP, SKX, SKYW, SO, SWX, SWN, SXI, SSYS, TRGP, TDY, TFX, TPX, TKR, TG, UNH, MDRX, V, WRB, WERN, WWW, ITA, IAI, IYE, IEZ, IHE, FXI, ICF, IYH, IEV, MXI, SLV, IEO, EWC, EEM, EWI, EWY, EWU, DBA, PXJ, PHO, GLD, XLI, XLB, XRT, XAR, VIS, VAW. Click this link for details (pattern type, start and end dates).
For a list of small patterns (those a few days wide) click this link.
$ $ $
You can find setups based on a Fibonacci retrace by clicking on the link.
The following patterns were found manually, not using Patternz. Mr. Bulkowski has excluded any securities he owns from appearing in the list. However, he may add any of the securities listed to his portfolio at any time, just as you can.
In the table below, the red and green colors are based on the historical breakout direction for the associated chart pattern. If a high and tight flag appears, the start and end dates highlight the flagpole only and not the flag.
For details about the chart patterns, click here.
-- Thomas Bulkowski
![]()
| Symbol | Chart Pattern | Bullish Bearish | Start | End | Industry |
| APD | Ugly double bottom | 06/01/2023 | 06/22/2023 | Chemical (Diversified) | |
| BALL | Double Bottom, Adam and Adam | 06/01/2023 | 06/08/2023 | Packaging and Container | |
| BBY | Ugly double bottom | 05/24/2023 | 06/23/2023 | Retail (Special Lines) | |
| BIG | Flag, high and tight | 05/31/2023 | 06/27/2023 | Retail Store | |
| BIIB | Double Top, Eve and Adam | 05/05/2023 | 06/12/2023 | Biotechnology | |
| BKNG | Diamond top | 04/18/2023 | 06/22/2023 | Internet | |
| CGNX | Double Top, Adam and Eve | 06/02/2023 | 06/13/2023 | Precision Instrument | |
| CSGS | Ugly double bottom | 05/31/2023 | 06/26/2023 | IT Services | |
| CMI | Ugly double bottom | 05/31/2023 | 06/23/2023 | Machinery | |
| WIRE | Double Bottom, Adam and Eve | 06/15/2023 | 06/23/2023 | Metals and Mining (Div.) | |
| FDX | Broadening top | 05/01/2023 | 06/16/2023 | Air Transport | |
| FISV | Ugly double bottom | 05/31/2023 | 06/21/2023 | IT Services | |
| GS | Broadening bottom | 05/04/2023 | 06/01/2023 | Securities Brokerage | |
| HSIC | Double Bottom, Adam and Eve | 05/09/2023 | 05/31/2023 | Medical Supplies | |
| HNI | Rising wedge | 05/19/2023 | 06/29/2023 | Furn/Home Furnishings | |
| ILMN | Triangle, symmetrical | 05/24/2023 | 06/16/2023 | Biotechnology | |
| NSP | Pipe top | 06/05/2023 | 06/12/2023 | Human Resources | |
| IBKR | Three Rising Valleys | 05/04/2023 | 06/13/2023 | Securities Brokerage | |
| MTRN | Ugly double bottom | 05/31/2023 | 06/23/2023 | Metals and Mining (Div.) | |
| NOC | Double Top, Eve and Eve | 06/09/2023 | 06/21/2023 | Aerospace/Defense | |
| OUT | Triangle, ascending | 04/10/2023 | 04/25/2023 | Advertising | |
| PFE | Double Top, Adam and Eve | 05/23/2023 | 06/13/2023 | Drug | |
| PPG | Pipe bottom | 05/22/2023 | 05/30/2023 | Chemical (Diversified) | |
| ROP | Three Rising Valleys | 03/15/2023 | 05/25/2023 | Industrial Services | |
| SAIC | Ugly double bottom | 05/25/2023 | 06/26/2023 | IT Services | |
| SKX | Pipe top | 06/05/2023 | 06/12/2023 | Shoe | |
| TDOC | Pipe bottom | 05/22/2023 | 05/30/2023 | Healthcare Information | |
| TPX | Pipe bottom | 05/30/2023 | 06/05/2023 | Furn/Home Furnishings | |
| TXT | Ugly double bottom | 05/31/2023 | 06/23/2023 | Diversified Co. | |
| TSCO | Broadening top, right-angled and ascending | 06/08/2023 | 06/28/2023 | Retail Building Supply | |
| TZOO | Pipe top | 06/05/2023 | 06/12/2023 | Internet | |
| VLO | Pipe bottom | 05/30/2023 | 06/05/2023 | Petroleum (Integrated) | |
| WLK | Head-and-shoulders bottom | 04/26/2023 | 06/23/2023 | Chemical (Basic) |
![]()
Since I post this the night before, check how the futures are trading before market open. Large moves can affect the opening direction.
$ $ $
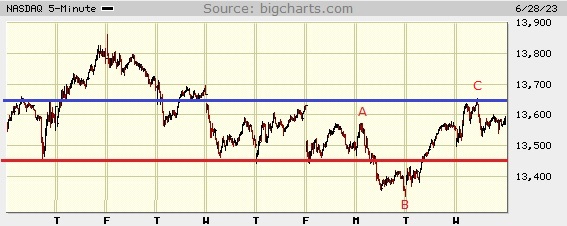
I show a picture of the Nasdaq composite on the 5-minute scale.
Not much is happening on the chart, so I drew some lines to make it look busy.
Notice the height of A above the red line. Compare that to the height of B to the red line. They are almost the same. That's called the measure rule for trendlines. See the link for an in depth explanation.
The red line is a trendline connecting the valleys. It shows support.
The blue line connects the peak at C and I drew it horizontally from there. It shows resistance. Could the index touch the blue line and drop like it did at C (and on Friday and on the first peak a week ago Wednesday)?
The answer is hard to say but my guess is we could be in for several days of a sideways move, mirroring the sideways move from last Wednesday to A (3 days). Often these mirrors look nice when they work, but there are lots of exceptions. Maybe this will be one of them.
$ $ $
Here's a symbol list of 121 chart and candlestick patterns (13 "investment grade" candle patterns) found in today's securities using my version of Patternz: DDD, MMM, ABT, ALKS, APA, ATR, ARW, AIZ, AGO, ATO, AVY, BSET, BZH, BCO, BMY, BBW, CNP, CDAY, CF, CHKP, CLNE, CGNX, CMCO, CMTL, ED, CAG, CRH, CCK, CSGS, ^DJU, DOV, DTE, BOOM, EQT, EVRG, FDS, FICO, FE, FISV, FTNT, FDP, GE, GIS, GPN, GGG, GES, THG, HLIT, HIG, HE, HQY, HSY, HON, HOV, INCY, INTC, JAZZ, JNJ, KMT, KFRC, LANC, LLY, LMT, MDT, MRK, MU, NTGR, JWN, NOC, ORCL, OR, PATK, PAYX, PRFT, PFE, POR, REGN, RGS, RNG, ROL, SAIA, SEE, SO, SWX, SWN, SUM, TRGP, TFX, TKR, TSCO, TDG, TZOO, TG, UNH, WDAY, IAI, ICF, EWK, EWZ, EWG, EWP, THD, EWU, DBA, GLD, XLI, VIS. Click this link for details (pattern type, start and end dates).
For a list of small patterns (those a few days wide) click this link.
$ $ $
The following table shows where Fibonacci retrace values of the day's high-low range are plus pivot points, calculated on the Nasdaq composite, sorted by value. When several are near each other (small differences), the area might act as support or resistance.
-- Thomas Bulkowski
![]()
| © 2023 ThePatternSite.com Metric | Value | Diff | Close (within 10% of the high-low range for the day)? |
| Monthly S2 | 11,845.67 | ||
| Monthly S1 | 12,718.71 | 873.04 | |
| Monthly Pivot | 13,288.89 | 570.18 | |
| Weekly S2 | 13,311.88 | 22.99 | |
| Daily S2 | 13,422.13 | 110.25 | |
| Weekly S1 | 13,451.81 | 29.68 | |
| Low | 13,495.73 | 43.92 | |
| Open | 13,506.02 | 10.29 | Yes! The Open is close to the Low. |
| Daily S1 | 13,506.94 | 0.92 | Yes! The Daily S1 is close to the Open. |
| 61.8% Down from Intraday High | 13,556.24 | 49.30 | |
| 50% Down from Intraday High | 13,574.93 | 18.69 | |
| Daily Pivot | 13,580.54 | 5.61 | Yes! The Daily Pivot is close to the 50% Down from Intraday High. |
| Weekly Pivot | 13,581.50 | 0.96 | Yes! The Weekly Pivot is close to the Daily Pivot. |
| Close | 13,591.75 | 10.25 | Yes! The Close is close to the Weekly Pivot. |
| 38.2% Down from Intraday High | 13,593.63 | 1.88 | Yes! The 38.2% Down from Intraday High is close to the Close. |
| High | 13,654.14 | 60.51 | |
| Daily R1 | 13,665.35 | 11.21 | Yes! The Daily R1 is close to the High. |
| Weekly R1 | 13,721.43 | 56.08 | |
| Daily R2 | 13,738.95 | 17.52 | |
| Weekly R2 | 13,851.12 | 112.17 | |
| Monthly R1 | 14,161.93 | 310.81 | |
| Monthly R2 | 14,732.11 | 570.18 |
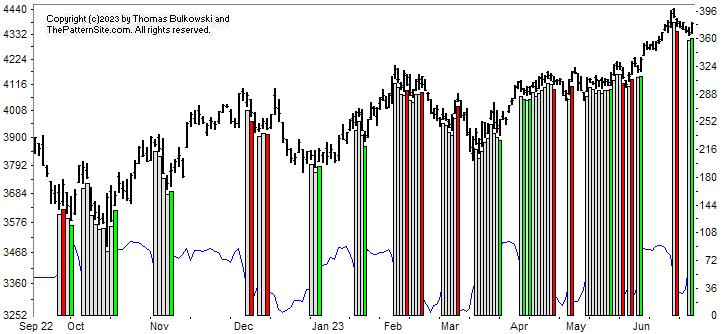
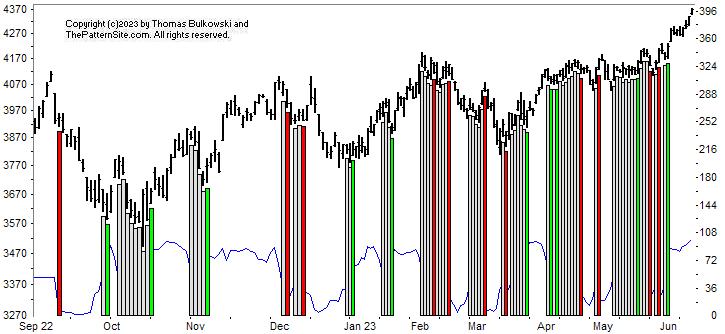
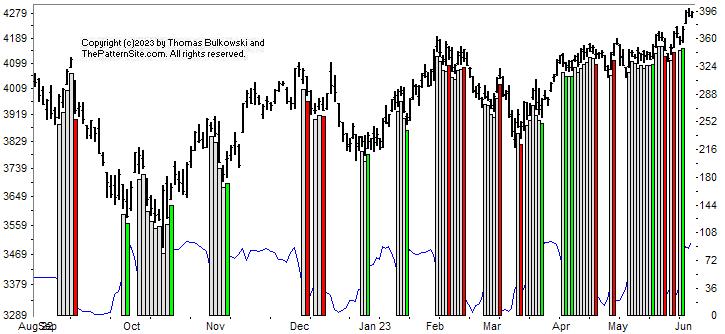
This is a picture of the chart pattern indicator on the daily scale. The indicator is the line chart below a chart of the S&P 500 composite.
The CPI has turned bullish as the vertical green bar shows on the chart. That's no surprise given that the markets were up today (Tuesday, over 1% point).
This upswing suggests the recent retrace has ended and we'll see new highs shortly.
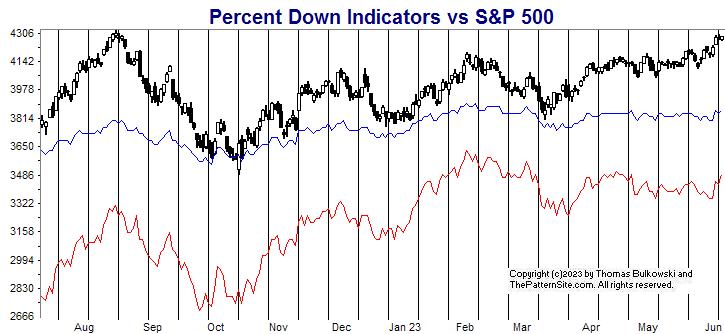
The red line is the percentage of stocks at least 20% below their 1-year high (plotted upside down). The blue line is the average percentage drop of stocks below their 1-year high (plotted upside down).
On Tuesday, 38% of stocks in my database are in bear market territory (down at least 20% from their 1-year high).A week ago, it was 37%.The fewest was 31% on 02/02/2023.And the most was 78% on 09/26/2022.
The 521 stocks in my database are down an average of 17% from their yearly high.A week ago, the average was 18%.The peak was 16% on 02/02/2023.And the bottom was 34% on 09/30/2022.
The red line shows weakness and the blue line shows strength compared to a week ago.
The red line since October has been trending higher, but has been weak since February.
This chart has a mixed signal but the CPI chart is more reliable and it's bullish. So I'm looking for the indices to continue rising.
$ $ $
Here's a symbol list of 139 chart and candlestick patterns (13 "investment grade" candle patterns) found in today's securities using my version of Patternz: MMM, ABT, ABM, AYI, ADTN, AEO, AEL, ARCB, ASH, AIZ, AGO, BZH, BERY, BIG, BBW, CDNS, CDAY, CHKP, CHS, CLNE, CGNX, CTSH, CL, CMTL, CXW, COST, CR, BOOM, ECL, EPAM, EXPI, XOM, EZPW, FDS, FIS, FWRD, GIS, GILD, GPN, HLIT, HAYN, HTLD, HL, HSII, HOLX, HOV, HUBG, ILMN, INCY, INFN, IBP, INTC, IPAR, NVTA, IRM, JAZZ, JBLU, JNJ, KFRC, LAMR, LANC, MHO, MTSI, M, MKTX, MSFT, NTGR, NEU, NEE, NTNX, OMC, OR, OUT, OMI, PATK, PAYX, PCTY, PFE, PINC, PFG, DGX, REGN, RNG, ROP, RES, SAIA, SAND, SMG, SWX, SWN, TRGP, TECH, TFX, TDC, TER, TKR, TJX, TG, UHAL, UIS, UPS, UNH, VMI, VECO, VC, WAT, WWD, IAI, DDM, IYH, MXI, IGE, EWK, EWZ, EWC, EEM, EWQ, EWH, EWS, EWY, EWL, EWT, THD, PJP, PHO, GLD, VHT. Click this link for details (pattern type, start and end dates).
For a list of small patterns (those a few days wide) click this link.
-- Thomas Bulkowski
![]()
$ $ $
I show another slider trading quiz featuring Varian Semiconductor: VSEA stock.
$ $ $
Here's a symbol list of 110 chart and candlestick patterns (13 "investment grade" candle patterns) found in today's securities using my version of Patternz: AYI, AMD, ALKS, AMZN, AEO, AMGN, AMN, AAPL, AMAT, AXS, BSET, BZH, BIIB, BBW, CLS, CNC, CNP, CF, CHS, CNO, CGNX, CMTL, COTY, CROX, DDS, BOOM, XOM, EZPW, FTNT, FWRD, IT, GIS, GILD, GFS, GS, GES, THG, HLIT, HL, HP, HOLX, HURC, ITW, NSP, PODD, INTU, JNJ, KBH, KELYA, LZB, LH, LRCX, LEG, LDOS, LEN, LLY, LPLA, MTSI, MAN, MLM, MTDR, MRCY, MLI, NKE, NOC, NTNX, ASGN, PKG, PATK, PFE, RTX, RNG, RES, R, SMG, SKX, SWX, SWN, SPLK, RIG, TG, UIS, UPS, MDRX, V, VMC, WU, WOLF, IEZ, IYZ, IGE, EWO, EWK, EWC, EIS, EWL, THD, XAR, XLK, UNG, VIS, VAW. Click this link for details (pattern type, start and end dates).
For a list of small patterns (those a few days wide) click this link.
$ $ $
The following table shows where Fibonacci retrace values of the day's high-low range are plus pivot points, calculated on the Dow industrials, sorted by value. When several are near each other (small differences), the area might act as support or resistance.
-- Thomas Bulkowski
![]()
| © 2023 ThePatternSite.com Metric | Value | Diff | Close (within 10% of the high-low range for the day)? |
| Monthly S2 | 31,627.86 | ||
| Monthly S1 | 32,671.29 | 1,043.42 | |
| Weekly S2 | 33,295.79 | 624.50 | |
| Weekly S1 | 33,505.25 | 209.46 | |
| Daily S2 | 33,505.67 | 0.43 | Yes! The Daily S2 is close to the Weekly S1. |
| Daily S1 | 33,610.19 | 104.52 | |
| Low | 33,610.32 | 0.13 | Yes! The Low is close to the Daily S1. |
| Monthly Pivot | 33,629.98 | 19.66 | Yes! The Monthly Pivot is close to the Low. |
| 61.8% Down from Intraday High | 33,690.22 | 60.24 | |
| Close | 33,714.71 | 24.49 | |
| Daily Pivot | 33,714.84 | 0.13 | Yes! The Daily Pivot is close to the Close. |
| 50% Down from Intraday High | 33,714.91 | 0.07 | Yes! The 50% Down from Intraday High is close to the Daily Pivot. |
| Open | 33,730.79 | 15.88 | Yes! The Open is close to the 50% Down from Intraday High. |
| 38.2% Down from Intraday High | 33,739.59 | 8.80 | Yes! The 38.2% Down from Intraday High is close to the Open. |
| Daily R1 | 33,819.36 | 79.77 | |
| High | 33,819.49 | 0.13 | Yes! The High is close to the Daily R1. |
| Weekly Pivot | 33,855.95 | 36.46 | |
| Daily R2 | 33,924.01 | 68.06 | |
| Weekly R1 | 34,065.42 | 141.41 | |
| Weekly R2 | 34,416.13 | 350.71 | |
| Monthly R1 | 34,673.41 | 257.28 | |
| Monthly R2 | 35,632.10 | 958.70 |
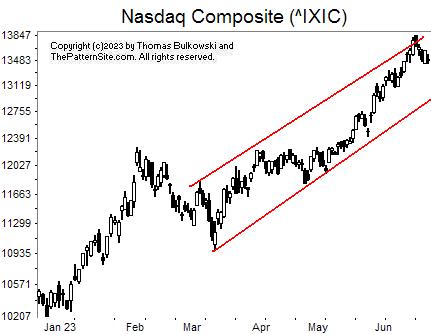
I show the Nasdaq composite on the daily scale. Not much is happening on the chart.
I drew a channel, outlined here in red, that the index has been following for four months now.
What does it mean?
Notice that the index is near the top of the channel. If the index behaves like it has in the past, then it'll bounce off the top line and drop to the lower one. That's why channels are useful (because they can show direction).
Indeed, you can see the index coming down now. I expect that retrace to continue.
However, it might not. In some cases, the index will drop to about midway across the channel and then rise again, perhaps staging an upward breakout.
![]()
The following is a brief review of how the markets performed over time. The numbers refer to the close-to-close move in the Dow industrials.
No options expire this week.
![]()
The following is based on an SFO article in December 2004 by John Seekinger, titled, "Take a two-dimensional approach." He offers these tips.
| Index | S2 | S1 | Pivot | R1 | R2 |
| Dow Industrials (^DJI): Daily | 33,547 | 33,637 | 33,737 | 33,827 | 33,926 |
| Weekly | 33,300 | 33,514 | 33,860 | 34,074 | 34,420 |
| Monthly | 31,632 | 32,680 | 33,634 | 34,682 | 35,636 |
| S&P500 (^GSPC): Daily | 4,327 | 4,338 | 4,352 | 4,363 | 4,377 |
| Weekly | 4,304 | 4,326 | 4,363 | 4,385 | 4,422 |
| Monthly | 3,956 | 4,152 | 4,300 | 4,497 | 4,645 |
| Nasdaq (^IXIC): Daily | 13,373 | 13,433 | 13,502 | 13,562 | 13,632 |
| Weekly | 13,279 | 13,386 | 13,548 | 13,655 | 13,818 |
| Monthly | 11,813 | 12,653 | 13,256 | 14,096 | 14,699 |
Here are the formulas:
![]()
Earnings season is over.
Here's a symbol list of 146 chart and candlestick patterns (13 "investment grade" candle patterns) found in today's securities using my version of Patternz: DDD, AMD, ALB, AEO, AEP, AMGN, AMN, APOG, ASH, ADSK, AVNT, AXS, CLS, CNC, CENX, CDAY, CVX, CHS, CNO, CGNX, CL, COP, CR, CTS, DVN, D, DOV, DRQ, DTE, BOOM, EXP, EOG, EZPW, FDS, FNV, FRD, IT, GE, GILD, GS, GPRO, THG, HLIT, HE, HAYN, HL, HP, HURC, NSP, IPAR, JAZZ, JNJ, KMT, KEYS, LZB, LH, LEG, LEN, MDC, MS, NTNX, OXY, OUT, OMI, OXM, PATK, PDCO, PXD, PLXS, PPG, RL, RGS, RNG, ROP, ROST, SCHW, SMG, SIGI, STR, SKX, SWX, SPLK, SSYS, SUM, TFX, TJX, RIG, UIS, WU, ZBRA, IAI, IYK, IYE, DDM, FXI, BOTZ, IYZ, IEV, IXC, MXI, IGE, IYF, EWA, EWO, EWK, EWC, EEM, EWG, EWH, EIS, EWJ, EWM, EWW, EPP, EWS, EZA, EWY, EWP, EWD, EWT, THD, EWU, PEJ, PXJ, PJP, ROBO, XLP, XLE. Click this link for details (pattern type, start and end dates).
For a list of small patterns (those a few days wide) click this link.
The below industries were the best (rank 1) or worst performing of those I follow.
|
-- Thomas Bulkowski
![]()
$ $ $
Here's a symbol list of 134 chart and candlestick patterns (13 "investment grade" candle patterns) found in today's securities using my version of Patternz: ABM, AXDX, ACN, AYI, ADTN, AMD, AEE, AIG, AMN, AMAT, AWI, ATO, AVA, BCPC, BA, BBW, CBT, CALM, CLS, CNC, CHS, CHD, CIEN, CLF, CNA, CNO, CGNX, CTSH, CMCO, CONN, CR, CTS, FANG, D, DOV, DRQ, BOOM, EOG, EVRG, EXC, EZPW, FFIV, FTV, FWRD, FNV, FDP, GL, GS, GPRO, HIG, HE, HL, HP, IDA, IEX, ITW, INFN, NSP, IPAR, IPG, IRM, LH, LRCX, LANC, MGY, MRO, MRK, META, MS, NFG, NJR, NWL, NUS, NTNX, OGE, OUT, OMI, PKE, PATK, PDCO, PRFT, PFE, PLXS, POR, PPG, RL, RGS, RNG, SAND, SCHW, SMG, SRE, STR, SKX, SWX, SPSC, SXI, TFX, TER, TEVA, RIG, WU, ZBRA, IAI, IHE, FXI, IAT, IYZ, SLV, IGE, IEO, EWA, EWO, EWK, EPP, EZA, THD, XLY, GLD, XAR. Click this link for details (pattern type, start and end dates).
For a list of small patterns (those a few days wide) click this link.
$ $ $
You can find setups based on a Fibonacci retrace by clicking on the link.
The following patterns were found manually, not using Patternz. Mr. Bulkowski has excluded any securities he owns from appearing in the list. However, he may add any of the securities listed to his portfolio at any time, just as you can.
In the table below, the red and green colors are based on the historical breakout direction for the associated chart pattern. If a high and tight flag appears, the start and end dates highlight the flagpole only and not the flag.
For details about the chart patterns, click here.
-- Thomas Bulkowski
![]()
| Symbol | Chart Pattern | Bullish Bearish | Start | End | Industry |
| ADTN | Scallop, descending | 03/31/2023 | 06/16/2023 | Telecom. Equipment | |
| AMD | Double Top, Adam and Adam | 05/30/2023 | 06/13/2023 | Semiconductor | |
| ALGT | Three Rising Valleys | 12/22/2022 | 05/31/2023 | Air Transport | |
| BRC | Triangle, symmetrical | 05/31/2023 | 06/22/2023 | Chemical (Diversified) | |
| CALM | Triple top | 05/05/2023 | 06/16/2023 | Food Processing | |
| CE | Double Top, Adam and Eve | 06/08/2023 | 06/14/2023 | Chemical (Basic) | |
| CAG | Diamond bottom | 05/25/2023 | 06/16/2023 | Food Processing | |
| CXW | Triangle, ascending | 04/14/2023 | 06/22/2023 | Industrial Services | |
| XRAY | Ugly double bottom | 05/31/2023 | 06/15/2023 | Medical Supplies | |
| DOV | Head-and-shoulders top | 04/11/2023 | 04/24/2023 | Machinery | |
| FLS | Roof | 06/08/2023 | 06/22/2023 | Machinery | |
| GOOGL | Head-and-shoulders top | 05/22/2023 | 06/16/2023 | Internet | |
| K | Triangle, symmetrical | 06/05/2023 | 06/22/2023 | Food Processing | |
| LXU | Ugly double bottom | 05/04/2023 | 05/17/2023 | Building Materials | |
| MTSI | Triangle, symmetrical | 05/24/2023 | 06/20/2023 | Semiconductor | |
| PKE | Ugly double bottom | 05/11/2023 | 06/12/2023 | Chemical (Specialty) | |
| RNG | Double Top, Adam and Eve | 06/01/2023 | 06/16/2023 | Computer Software and Svcs | |
| ROL | Pipe bottom | 05/22/2023 | 05/30/2023 | Industrial Services | |
| R | Triangle, symmetrical | 04/27/2023 | 06/22/2023 | Trucking/Transp. Leasing | |
| SRDX | Flag, high and tight | 05/25/2023 | 06/22/2023 | Medical Supplies | |
| UIS | Triangle, symmetrical | 05/23/2023 | 06/22/2023 | Computers and Peripherals | |
| XLF | Broadening bottom | 05/31/2022 | 02/08/2023 | Financial Services |
![]()
Since I post this the night before, check how the futures are trading before market open. Large moves can affect the opening direction.
$ $ $
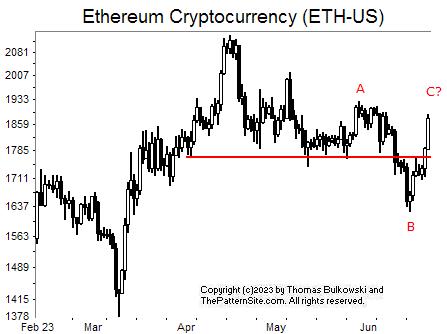
I show a picture of Ethereum on the daily scale.
Ethereum broke through support, which I show as a red line. Ignore the spikes down through the line where it fails to show support, but rather the general tendency of the currency to remain above the line that illustrates support.
Compare the height of A to the red line versus the red line to the low at B. They look nearly the same height. That's called the measure rule for trendlines.
Don't get too excited. It rarely works. Will the move from B to the red line mirror the rise up to C? It's close now. My guess is no, it won't. Why? Because as soon as you recognize a pattern and try to depend on it, the rule fails.
In this case, the crypto could just blow through the target and continue higher...or not. My guess? Yes, it'll continue to rise past the height of A, maybe reaching the height of the peak to the left of A (the May peak).
$ $ $
Here's a symbol list of 155 chart and candlestick patterns (13 "investment grade" candle patterns) found in today's securities using my version of Patternz: MMM, AXDX, ACIW, ADBE, AMD, AJRD, AMED, AEO, AEP, AXP, AFG, AMN, AIZ, AVY, BMI, BSET, BMRN, BA, BMY, BG, CALM, CNC, CNP, CHS, CIEN, CLNE, CNO, CGNX, CMCO, COTY, CR, CW, XRAY, DSGR, ^DJI, EMN, EFX, FDS, FLS, FNV, FDP, GME, GD, GNW, GS, HE, HL, HSIC, HNI, JBHT, HUN, INFN, NSP, IIIN, INTC, TILE, IPI, KALU, KMT, LZB, LH, LDOS, RAMP, LOW, MAN, MA, MTRX, MRK, MOS, NTGR, NWL, NEE, NI, NOC, NOVT, NTNX, OLN, OR, OXM, PATK, PDCO, PTEN, RJF, RTX, REGN, RGS, RNG, RLI, ^GSPC, SAIA, SAND, SAIC, SMG, SRE, SKX, SO, SWX, SPLK, SRDX, TRGP, TDY, TPX, TXT, RIG, UGI, UNH, V, WPM, WDAY, ZBRA, ITA, IAI, DDM, QTEC, FXI, BOTZ, ICF, IYZ, MXI, IXN, SLV, EWO, EWK, EWH, EIS, EWM, EZA, EWY, EWP, EWT, THD, TUR, IBB, PPA, SSO, ROBO, GLD, XRT, SPY, XLK. Click this link for details (pattern type, start and end dates).
For a list of small patterns (those a few days wide) click this link.
$ $ $
The following table shows where Fibonacci retrace values of the day's high-low range are plus pivot points, calculated on the Nasdaq composite, sorted by value. When several are near each other (small differences), the area might act as support or resistance.
-- Thomas Bulkowski
![]()
| © 2023 ThePatternSite.com Metric | Value | Diff | Close (within 10% of the high-low range for the day)? |
| Monthly S2 | 11,540.79 | ||
| Monthly S1 | 12,521.50 | 980.70 | |
| Weekly S2 | 12,998.13 | 476.63 | |
| Monthly Pivot | 13,190.28 | 192.16 | |
| Weekly S1 | 13,250.16 | 59.88 | |
| Daily S2 | 13,356.27 | 106.11 | |
| Daily S1 | 13,429.24 | 72.96 | |
| Low | 13,460.94 | 31.70 | |
| Close | 13,502.20 | 41.26 | |
| 61.8% Down from Intraday High | 13,528.79 | 26.59 | |
| Daily Pivot | 13,533.90 | 5.11 | Yes! The Daily Pivot is close to the 61.8% Down from Intraday High. |
| 50% Down from Intraday High | 13,549.75 | 15.85 | Yes! The 50% Down from Intraday High is close to the Daily Pivot. |
| Weekly Pivot | 13,554.62 | 4.86 | Yes! The Weekly Pivot is close to the 50% Down from Intraday High. |
| 38.2% Down from Intraday High | 13,570.71 | 16.10 | Yes! The 38.2% Down from Intraday High is close to the Weekly Pivot. |
| Daily R1 | 13,606.87 | 36.15 | |
| Open | 13,620.87 | 14.00 | Yes! The Open is close to the Daily R1. |
| High | 13,638.57 | 17.70 | Yes! The High is close to the Open. |
| Daily R2 | 13,711.53 | 72.96 | |
| Weekly R1 | 13,806.65 | 95.12 | |
| Weekly R2 | 14,111.11 | 304.45 | |
| Monthly R1 | 14,170.99 | 59.88 | |
| Monthly R2 | 14,839.77 | 668.79 |
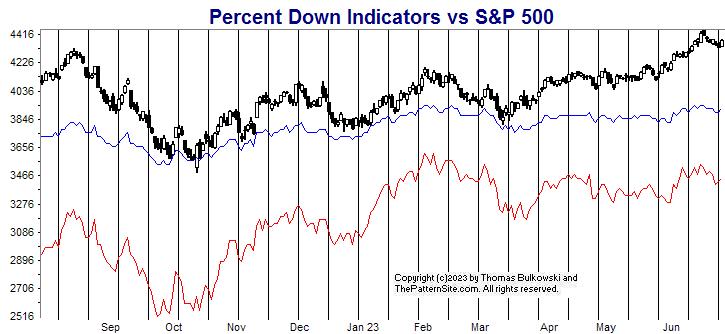
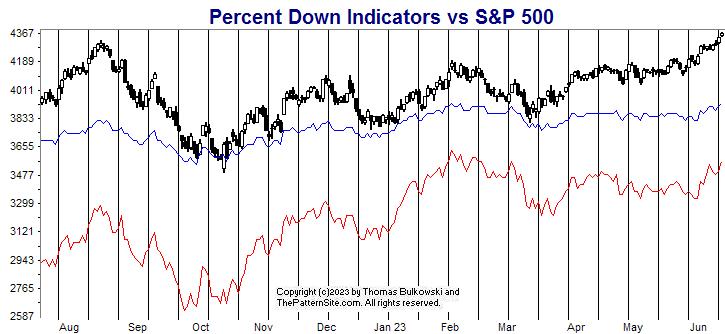
This is a picture of the chart pattern indicator on the daily scale. The indicator is the line chart below a chart of the S&P 500 composite.
The CPI has turned bearish, as the red vertical bar on the far right of the chart shows. After such as swift move up in the last 2 weeks, a retrace is expected.
So this chart is bearish, but only mildly so. In other words, I'm expecting a retrace not a longer-term change in trend.
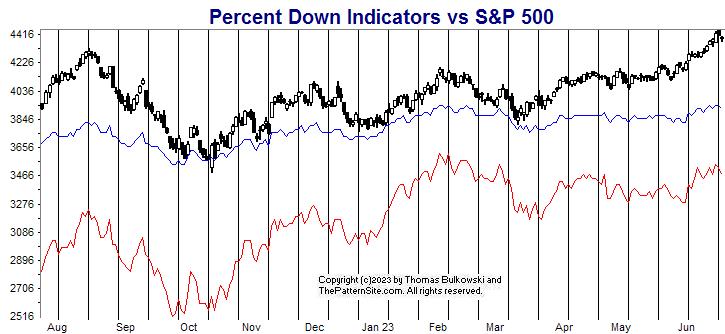
The red line is the percentage of stocks at least 20% below their 1-year high (plotted upside down). The blue line is the average percentage drop of stocks below their 1-year high (plotted upside down).
On Tuesday, 37% of stocks in my database are in bear market territory (down at least 20% from their 1-year high).A week ago, it was 37%.The fewest was 31% on 02/02/2023.And the most was 78% on 09/26/2022.
The 521 stocks in my database are down an average of 18% from their yearly high.A week ago, the average was 17%.The peak was 16% on 02/02/2023.And the bottom was 34% on 09/30/2022.
The blue line is slightly worse this week compared to a week ago. That's the only hint of weakness that I could find on this chart.
With the prior chart suggesting a retrace and this chart only hinting of a downturn, I expect the CPI chart to be the better predictor. So I'm looking for the index to drop more, maybe for a week to 10 days.
$ $ $
Here's a symbol list of 118 chart and candlestick patterns (13 "investment grade" candle patterns) found in today's securities using my version of Patternz: AA, AMED, AMN, ANIK, AGO, AVA, BSET, BECN, BIG, BA, BBW, BG, CBT, CALM, CE, CVX, CHS, CHD, CNO, CGNX, ED, CONN, CSGP, COST, CROX, CTS, FANG, DDS, D, BOOM, EIX, EPAM, EXC, EXPI, XOM, FDS, FLEX, FORM, FNV, GMS, GGG, HBI, HL, HELE, HOLX, HWM, INCY, INFN, INTC, JBLU, KBH, K, KMB, LH, LAMR, LEG, L, MANH, MLM, MTDR, MTRN, MDC, MGEE, MU, MOS, NTGR, NWL, JWN, NWPX, NTNX, OR, OXM, PATK, PCG, PG, RNG, RCKY, CRM, SMG, SHOP, SLGN, SKYW, SWX, TGT, TREX, SLCA, UGI, UNH, VRTX, WMT, WERN, WPM, WSM, WWW, WWD, IYK, FXI, IXC, SOXX, SLV, IGE, EWJ, EWT, THD, GLD, XAR, UNG, SMH. Click this link for details (pattern type, start and end dates).
For a list of small patterns (those a few days wide) click this link.
-- Thomas Bulkowski
![]()
$ $ $
New research! Can we predict the breakout (by knowing the trend start and width)? The short answer is: No.
$ $ $
I show another slider trading quiz featuring Verisign: VRSN stock.
$ $ $
Here's a symbol list of 172 chart and candlestick patterns (13 "investment grade" candle patterns) found in today's securities using my version of Patternz: DDD, ABT, ABM, AA, AEL, AME, AMN, AR, AON, ANET, ADSK, AXS, BSET, BAX, BZH, BIG, BA, BKNG, BOOT, CDNS, CALM, CDAY, CHKP, CVX, CHS, CTAS, CLNE, CNO, CGNX, CL, CMTL, ED, CONN, GLW, COST, COTY, CR, CRH, CROX, CW, XRAY, DDS, DSGR, DOV, BOOM, EPAM, EVH, XOM, FDS, FDX, FORM, FTNT, FDP, GE, GNW, GMS, GFF, HSC, HELE, HD, HURC, INFN, K, KMB, LH, LRCX, LLY, LPLA, MTSI, MANH, MCHX, MTDR, MTRN, MTRX, MU, NBR, ^IXIC, NFLX, NTGR, NWL, NEE, NKE, JWN, NTNX, ORI, ASGN, OTEX, OR, OXM, PATK, PCTY, PCG, PEG, RNG, SCHW, SHW, SHOP, STR, SO, SWX, SWN, SCS, SUM, SNPS, TGT, TPX, TZOO, TG, UIS, UNH, VLO, WMT, WEX, WSM, WSC, WWW, IYK, IYC, DDM, FTEC, QTEC, FXL, FXI, ICF, IEV, IXN, SOXX, IHI, EWA, EWK, EWC, EEM, EWQ, EWH, EWI, EWJ, EWM, EPP, EWS, EZA, EWD, EWL, EWU, IBB, PPA, DBA, PXJ, PJP, ROBO, XRT, XAR, SMH, MGK. Click this link for details (pattern type, start and end dates).
For a list of small patterns (those a few days wide) click this link.
$ $ $
The following table shows where Fibonacci retrace values of the day's high-low range are plus pivot points, calculated on the Dow industrials, sorted by value. When several are near each other (small differences), the area might act as support or resistance.
-- Thomas Bulkowski
![]()
| © 2023 ThePatternSite.com Metric | Value | Diff | Close (within 10% of the high-low range for the day)? |
| Monthly S2 | 31,822.67 | ||
| Monthly S1 | 33,060.89 | 1,238.23 | |
| Weekly S2 | 33,418.65 | 357.76 | |
| Monthly Pivot | 33,824.79 | 406.13 | |
| Weekly S1 | 33,858.89 | 34.10 | |
| Daily S2 | 34,088.17 | 229.29 | |
| Daily S1 | 34,193.65 | 105.48 | |
| Weekly Pivot | 34,223.79 | 30.14 | Yes! The Weekly Pivot is close to the Daily S1. |
| Low | 34,285.69 | 61.91 | |
| Close | 34,299.12 | 13.43 | Yes! The Close is close to the Low. |
| Daily Pivot | 34,391.16 | 92.04 | |
| 61.8% Down from Intraday High | 34,401.43 | 10.27 | Yes! The 61.8% Down from Intraday High is close to the Daily Pivot. |
| 50% Down from Intraday High | 34,437.18 | 35.75 | |
| Open | 34,464.02 | 26.84 | Yes! The Open is close to the 50% Down from Intraday High. |
| 38.2% Down from Intraday High | 34,472.94 | 8.92 | Yes! The 38.2% Down from Intraday High is close to the Open. |
| Daily R1 | 34,496.64 | 23.70 | Yes! The Daily R1 is close to the 38.2% Down from Intraday High. |
| High | 34,588.68 | 92.04 | |
| Weekly R1 | 34,664.02 | 75.34 | |
| Daily R2 | 34,694.15 | 30.14 | Yes! The Daily R2 is close to the Weekly R1. |
| Weekly R2 | 35,028.91 | 334.76 | |
| Monthly R1 | 35,063.01 | 34.10 | |
| Monthly R2 | 35,826.91 | 763.89 |
$ $ $
Here's a symbol list of 170 chart and candlestick patterns (13 "investment grade" candle patterns) found in today's securities using my version of Patternz: MMM, ABM, AFL, A, ALL, AMZN, AMED, AEO, AMWD, AME, AMN, APOG, ATR, AZTA, BAX, BERY, BIO, BMRN, BA, BSX, BRC, BR, BBW, CDNS, CDAY, CRL, CNO, CGNX, CTSH, CMCO, GLW, COTY, CCK, DHR, DSGR, ^DJI, DOV, BOOM, EXP, EMN, EBAY, ECL, EME, EFX, EL, EZPW, FFIV, FDS, FARO, FDX, FIS, FIVN, FTNT, FNV, GFS, GGG, THG, HSC, HQY, HL, HELE, JBHT, HUN, IEX, ITW, ILMN, INCY, IIIN, ITGR, TILE, IPG, INTU, NVTA, KEYS, MCHX, MLM, MTRX, MCO, MS, NBR, NOV, NEWR, NTNX, OMC, OR, OMI, PKG, PATK, PYPL, PRFT, PCG, PINC, PFG, QTWO, RGA, RNG, ROK, RES, R, SEIC, SCCO, SWX, SWN, SR, TGT, TDY, TPX, TXT, TKR, TSCO, TG, UHAL, VLO, MDRX, VRSN, V, VMC, WAT, WERN, WU, WWD, ZBRA, IYC, IHE, DDM, FXI, ICF, IHF, IYZ, MXI, IYF, IHI, EWC, EEM, EIS, EWM, EWS, EZA, EWY, EWU, IBB, PPA, DBA, PEJ, PXJ, PJP, PHO, ROBO, XLY, XLF, XLI, XRT, UNG, VIS. Click this link for details (pattern type, start and end dates).
For a list of small patterns (those a few days wide) click this link.
$ $ $
You can find setups based on a Fibonacci retrace by clicking on the link.
The following patterns were found manually, not using Patternz. Mr. Bulkowski has excluded any securities he owns from appearing in the list. However, he may add any of the securities listed to his portfolio at any time, just as you can.
In the table below, the red and green colors are based on the historical breakout direction for the associated chart pattern. If a high and tight flag appears, the start and end dates highlight the flagpole only and not the flag.
For details about the chart patterns, click here.
-- Thomas Bulkowski
![]()
| Symbol | Chart Pattern | Bullish Bearish | Start | End | Industry |
| ABT | Double Bottom, Adam and Eve | 05/31/2023 | 06/09/2023 | Medical Supplies | |
| BERY | Ugly double bottom | 05/03/2023 | 05/12/2023 | Packaging and Container | |
| BMRN | Pipe bottom | 05/22/2023 | 05/30/2023 | Biotechnology | |
| BR | Pipe bottom | 05/22/2023 | 05/30/2023 | Information Services | |
| CENX | Ugly double bottom | 05/11/2023 | 05/31/2023 | Metals and Mining (Div.) | |
| CMTL | Horn top | 05/15/2023 | 05/30/2023 | Telecom. Equipment | |
| GLW | Double Bottom, Eve and Adam | 05/16/2023 | 05/31/2023 | Telecom. Equipment | |
| DVN | Double Bottom, Adam and Eve | 05/16/2023 | 05/31/2023 | Natural Gas (Diversified) | |
| ECL | Pipe bottom | 05/22/2023 | 05/30/2023 | Chemical (Specialty) | |
| EXPI | Flag, high and tight | 04/26/2023 | 06/12/2023 | E-Commerce | |
| EXPD | Three Rising Valleys | 03/24/2023 | 06/01/2023 | Air Transport | |
| FIS | Triangle, symmetrical | 04/27/2023 | 06/15/2023 | Computer Software and Svcs | |
| GPS | Double Bottom, Adam and Adam | 05/16/2023 | 05/25/2023 | Apparel | |
| GNW | Double Top, Eve and Eve | 05/19/2023 | 06/08/2023 | Insurance (Life) | |
| GMS | Diamond top | 05/19/2023 | 06/05/2023 | Cement and Aggregates | |
| JBHT | Triangle, symmetrical | 03/06/2023 | 06/15/2023 | Trucking/Transp. Leasing | |
| KALU | Triple bottom | 05/04/2023 | 05/31/2023 | Metals and Mining (Div.) | |
| LAMR | Pipe bottom | 05/22/2023 | 05/30/2023 | Advertising | |
| LDOS | Head-and-shoulders bottom | 05/04/2023 | 06/01/2023 | IT Services | |
| LEN | Pipe bottom | 05/22/2023 | 05/30/2023 | Homebuilding | |
| MCHX | Pipe bottom | 05/08/2023 | 05/15/2023 | Advertising | |
| MDT | Double Bottom, Eve and Eve | 05/26/2023 | 06/07/2023 | Medical Supplies | |
| MCO | Rounding bottom | 02/02/2023 | 06/08/2023 | Information Services | |
| OMC | Multi-peaks | 01/25/2023 | 06/15/2023 | Advertising | |
| PDCO | Double Bottom, Eve and Adam | 05/09/2023 | 05/31/2023 | Medical Supplies | |
| PCTY | Ugly double bottom | 05/05/2023 | 06/01/2023 | E-Commerce | |
| PYPL | Ugly double bottom | 05/26/2023 | 06/09/2023 | Financial Services | |
| PRU | Triple bottom | 05/04/2023 | 05/31/2023 | Insurance (Life) | |
| ROG | Rectangle top | 03/01/2023 | 06/15/2023 | Electronics | |
| RES | Broadening bottom | 05/08/2023 | 06/13/2023 | Oilfield Svcs/Equipment | |
| SAIA | Ugly double bottom | 04/26/2023 | 05/24/2023 | Trucking/Transp. Leasing | |
| SHW | Triple bottom | 05/16/2023 | 05/31/2023 | Chemical (Basic) | |
| SCCO | Pipe bottom | 05/22/2023 | 05/30/2023 | Metals and Mining (Div.) | |
| LUV | Head-and-shoulders bottom | 04/27/2023 | 05/24/2023 | Air Transport | |
| SWX | Rounding bottom | 03/30/2023 | 06/15/2023 | Natural Gas (Distributor) | |
| SRDX | Double Bottom, Adam and Adam | 03/20/2023 | 05/25/2023 | Medical Supplies | |
| TGT | Double Bottom, Adam and Adam | 06/01/2023 | 06/12/2023 | Retail Store | |
| TKR | Falling wedge | 05/03/2023 | 06/01/2023 | Metal Fabricating | |
| UPS | Triple bottom | 05/16/2023 | 06/06/2023 | Air Transport | |
| VLO | Double Bottom, Adam and Eve | 05/04/2023 | 06/06/2023 | Petroleum (Integrated) | |
| VRTX | Double Bottom, Eve and Adam | 06/01/2023 | 06/08/2023 | Biotechnology | |
| WAT | Double Bottom, Adam and Eve | 05/31/2023 | 06/09/2023 | Precision Instrument |
![]()
Since I post this the night before, check how the futures are trading before market open. Large moves can affect the opening direction.
$ $ $
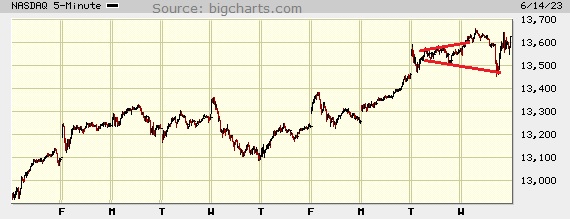
I show a picture of the Nasdaq composite on the 5-minute scale.
I didn't scour the chart looking for patterns, but I did notice a broadening top chart pattern, highlighted in red.
I extended the bottom line because I felt like it. The index has pushed through the top of the pattern, dropped back to snag the bottom line, before rebounding.
If I extend the top trendline, it would come close to or even touch the most recent peak. That suggests the index will retrace (bouncing off overhead resistance). It's like being swatted with a rolled up newspaper.
Maybe not, but with the FED holding steady, there's some justification for the index to push through, upward. Either that, or the good news of the FED keeping rates steady was already factored in and the index will drop. Take your pick.
$ $ $
Here's a symbol list of 204 chart and candlestick patterns (13 "investment grade" candle patterns) found in today's securities using my version of Patternz: ACIW, ATSG, ALRM, ALB, AA, ALL, AMED, AEL, AIG, AMN, AR, APA, ADM, AGO, ADSK, ADP, BMI, BZH, BIO, BA, BMY, BR, BRKR, CF, CLX, CNO, CGNX, CL, CMCO, CAG, CONN, CXW, COST, CRH, CCK, CSGS, XRAY, DDS, DSGR, ^DJT, DTE, BOOM, EBAY, EQT, EL, EVRG, EZPW, FDX, FIS, FISV, FIVN, FLS, FTNT, FRD, GL, GS, GPRO, GFF, GES, THG, HSC, HIG, HAYN, HQY, HL, HSII, HP, HSIC, HSY, HOLX, HWM, INCY, IBP, IIIN, ISRG, NVTA, JNJ, KALU, KELYA, KMT, KLAC, LAMR, LEN, L, LPLA, LXU, MGY, MCHX, MTDR, MDT, MRCY, MU, MLKN, MLI, NTGR, NTAP, NWL, NEE, NKE, NWPX, NOVT, NTNX, OLN, OMC, OR, OMI, PKE, PATK, PTEN, PEN, PFE, PNW, PLXS, PPG, PINC, KWR, RRC, RJF, RNG, ROG, RES, SLB, SMG, LUV, SWX, SWN, SR, SSYS, TPR, TFX, TPX, TXT, TMO, TKR, TRV, TZOO, TREX, VLO, VEEV, MDRX, WRB, WMT, WLK, WEX, WSM, WSC, WWD, IEZ, FTEC, FDN, QTEC, FXI, ICF, IAT, MXI, IXN, ILF, SOXX, IHI, EWK, EEM, EWG, EWI, EWW, EZA, EWP, TUR, EWU, IBB, PPA, DBA, PBE, PEJ, XLP, XLF, GLD, XHB, XLI, XRT, XAR, XLK, USO, SMH, VIS. Click this link for details (pattern type, start and end dates).
For a list of small patterns (those a few days wide) click this link.
$ $ $
The following table shows where Fibonacci retrace values of the day's high-low range are plus pivot points, calculated on the Nasdaq composite, sorted by value. When several are near each other (small differences), the area might act as support or resistance.
-- Thomas Bulkowski
![]()
| © 2023 ThePatternSite.com Metric | Value | Diff | Close (within 10% of the high-low range for the day)? |
| Monthly S2 | 11,705.82 | ||
| Monthly S1 | 12,666.15 | 960.33 | |
| Monthly Pivot | 13,026.05 | 359.90 | |
| Weekly S2 | 13,070.83 | 44.78 | |
| Weekly S1 | 13,348.66 | 277.82 | |
| Weekly Pivot | 13,367.30 | 18.65 | Yes! The Weekly Pivot is close to the Weekly S1. |
| Daily S2 | 13,375.65 | 8.35 | Yes! The Daily S2 is close to the Weekly Pivot. |
| Low | 13,455.99 | 80.34 | |
| Daily S1 | 13,501.07 | 45.08 | |
| 61.8% Down from Intraday High | 13,534.59 | 33.52 | |
| 50% Down from Intraday High | 13,558.87 | 24.28 | |
| Open | 13,570.56 | 11.69 | Yes! The Open is close to the 50% Down from Intraday High. |
| Daily Pivot | 13,581.40 | 10.84 | Yes! The Daily Pivot is close to the Open. |
| 38.2% Down from Intraday High | 13,583.14 | 1.74 | Yes! The 38.2% Down from Intraday High is close to the Daily Pivot. |
| Close | 13,626.48 | 43.34 | |
| Weekly R1 | 13,645.13 | 18.65 | Yes! The Weekly R1 is close to the Close. |
| High | 13,661.74 | 16.61 | Yes! The High is close to the Weekly R1. |
| Weekly R2 | 13,663.77 | 2.03 | Yes! The Weekly R2 is close to the High. |
| Daily R1 | 13,706.82 | 43.04 | |
| Daily R2 | 13,787.15 | 80.34 | |
| Monthly R1 | 13,986.38 | 199.23 | |
| Monthly R2 | 14,346.28 | 359.90 |
This is a picture of the chart pattern indicator on the daily scale. The indicator is the line chart below a chart of the S&P 500 composite.
The CPI shows a bullish signal. The index is moving higher seemingly each day. The FED, tomorrow, could change that, of course. I thought the next meeting was in a month but they report tomorrow.
The red line is the percentage of stocks at least 20% below their 1-year high (plotted upside down). The blue line is the average percentage drop of stocks below their 1-year high (plotted upside down).
On Tuesday, 34% of stocks in my database are in bear market territory (down at least 20% from their 1-year high).A week ago, it was 38%.The fewest was 31% on 02/02/2023.And the most was 80% on 06/17/2022.
The 522 stocks in my database are down an average of 17% from their yearly high.A week ago, the average was 19%.The peak was 16% on 02/02/2023.And the bottom was 34% on 09/30/2022.
Both lines (red and blue) this week are bullish compared to a week ago.
The index is making new highs. The red line is trending higher and has been rising since October 2022 in a stair-step fashion.
Both charts this week are bullish and I believe that this signals the market's confidence that the FED will hold rates steady tomorrow. If not, look for the markets to make a sharp one-day drop, probably several hundreds points.
$ $ $
Here's a symbol list of 217 chart and candlestick patterns (13 "investment grade" candle patterns) found in today's securities using my version of Patternz: AXDX, ACN, ACIW, AYI, ADTN, AMD, AFL, APD, ALB, AYX, AXP, AMN, BMI, BZH, BERY, BBY, BMRN, BA, BOOT, BR, BRKR, BBW, CDNS, CALM, CX, CNC, CENX, CDAY, CF, CHD, CI, CLNE, CLF, CLX, CNA, CNX, CGNX, CMTL, CXW, CSGP, COTY, CR, CROX, CCRN, CCK, DHR, DECK, XRAY, FANG, DSGR, DTE, BOOM, ECL, EMR, EPAM, EQT, RE, EVH, FARO, FAST, FIVN, FLS, FNV, FCX, GME, GE, GIS, GNW, GILD, GFS, GPRO, HSC, HAYN, HQY, HOLX, HURC, IDA, ITW, ILMN, IBP, IIIN, ITGR, ISRG, NVTA, JAZZ, JNJ, KBH, LHX, LH, LAMR, LEN, LMT, LOW, LXU, M, MGY, MRO, MCHX, MTRX, MDT, MRCY, MU, MCO, NBR, NOV, NFLX, NTAP, NTNX, NVDA, OMC, PATK, PDCO, PPG, PPL, PG, PGR, PHM, KWR, QCOM, RRC, RTX, REGN, RNG, ROK, ROL, RES, SAND, SCI, NOW, STR, SKYW, SO, SCCO, SWX, SSYS, SRDX, TPR, TECH, TDOC, TPX, TER, TJX, TRV, TZOO, TREX, UHAL, VLO, WMT, WSO, WSC, WOLF, ZBRA, IYM, IYC, IHE, DDM, FXL, FXI, BOTZ, QQQ, IYZ, IEV, SOXX, SLV, EWO, EWC, ECH, EEM, EWQ, EWG, EWH, EIS, EWI, EWJ, EPP, EWS, EZA, EWY, EWD, EWT, TUR, PPA, DBA, PBE, PEJ, PXJ, PJP, SSO, ROBO, XLF, GLD, XLI, XRT, SPY, XAR, VIS, VAW, MGK. Click this link for details (pattern type, start and end dates).
For a list of small patterns (those a few days wide) click this link.
-- Thomas Bulkowski
![]()
$ $ $
I show another slider trading quiz featuring Verisign 2: VRSN stock.
$ $ $
Here's a symbol list of 147 chart and candlestick patterns (13 "investment grade" candle patterns) found in today's securities using my version of Patternz: AXDX, ACN, AEIS, ATSG, ALGT, DOX, AMN, AON, ATR, ARW, AIZ, BCPC, BIO, BIIB, BMRN, BA, BR, BRKR, BBW, CALM, CX, CNC, CNP, CI, CTAS, CLF, CLX, CNA, CGNX, CMTL, COST, COTY, CR, CROX, CCK, CW, XRAY, DOV, EBAY, ECL, EMR, WIRE, EVH, EXPI, FLS, FCX, FRD, GE, GS, GGG, HAYN, HL, HUN, IDA, IBP, NVTA, JAZZ, KBH, K, KSS, LHX, LAMR, LEN, LOW, M, MAN, MCHX, MTRX, MRCY, MU, MS, NBR, NTAP, NTNX, OLN, ASGN, PDCO, PETS, PNW, PPG, PG, PHM, RMBS, RTX, RGS, RNG, RHI, ROG, ROL, RES, SAND, SEIC, SRE, SHOP, SO, SCCO, LUV, SWX, SR, SPLK, TDOC, TKR, TSCO, RIG, TREX, UHAL, UGI, VRSN, WMT, WAT, WSO, FXI, IYF, EIS, EWJ, EWM, PPA, DBA, XLI, XAR, XLU, UNG, VIS. Click this link for details (pattern type, start and end dates).
For a list of small patterns (those a few days wide) click this link.
$ $ $
The following table shows where Fibonacci retrace values of the day's high-low range are plus pivot points, calculated on the Dow industrials, sorted by value. When several are near each other (small differences), the area might act as support or resistance.
-- Thomas Bulkowski
![]()
| © 2023 ThePatternSite.com Metric | Value | Diff | Close (within 10% of the high-low range for the day)? |
| Monthly S2 | 32,153.98 | ||
| Monthly S1 | 33,110.15 | 956.18 | |
| Weekly S2 | 33,238.15 | 128.00 | |
| Monthly Pivot | 33,542.74 | 304.59 | |
| Weekly S1 | 33,652.24 | 109.50 | |
| Daily S2 | 33,808.16 | 155.93 | |
| Weekly Pivot | 33,813.78 | 5.62 | Yes! The Weekly Pivot is close to the Daily S2. |
| Low | 33,878.46 | 64.68 | |
| Open | 33,906.80 | 28.34 | |
| Daily S1 | 33,937.25 | 30.45 | |
| 61.8% Down from Intraday High | 33,954.63 | 17.38 | Yes! The 61.8% Down from Intraday High is close to the Daily S1. |
| 50% Down from Intraday High | 33,978.15 | 23.52 | |
| 38.2% Down from Intraday High | 34,001.68 | 23.53 | |
| Daily Pivot | 34,007.54 | 5.87 | Yes! The Daily Pivot is close to the 38.2% Down from Intraday High. |
| Close | 34,066.33 | 58.79 | |
| High | 34,077.84 | 11.51 | Yes! The High is close to the Close. |
| Daily R1 | 34,136.63 | 58.79 | |
| Daily R2 | 34,206.92 | 70.30 | |
| Weekly R1 | 34,227.87 | 20.95 | |
| Weekly R2 | 34,389.41 | 161.54 | |
| Monthly R1 | 34,498.91 | 109.50 | |
| Monthly R2 | 34,931.50 | 432.58 |
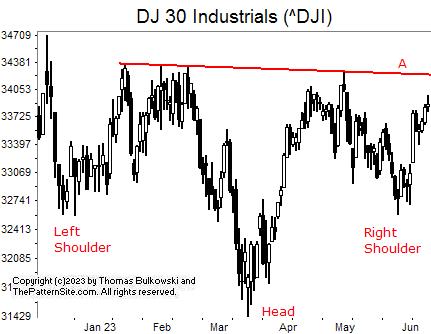
The chart shows the Dow industrials on the daily scale.
I highlight a potential head-and-shoulders bottom chart pattern.
I write "potential" because the index has to close above the red neckline, A. Until that happens, you're just looking at squiggles on the price chart.
If it confirms as a valid pattern, then it suggests we'll see a big move upward. I think that'll happen, perhaps when the Federal Reserve reports on their meeting.
Perhaps the move up will begin next week.
![]()
The following is a brief review of how the markets performed over time. The numbers refer to the close-to-close move in the Dow industrials.
Many options expire this week, so traders will be looking to close out their positions, and that suggests increased volatility (large daily price swings).
![]()
The following is based on an SFO article in December 2004 by John Seekinger, titled, "Take a two-dimensional approach." He offers these tips.
| Index | S2 | S1 | Pivot | R1 | R2 |
| Dow Industrials (^DJI): Daily | 33,692 | 33,784 | 33,880 | 33,972 | 34,068 |
| Weekly | 33,175 | 33,526 | 33,751 | 34,102 | 34,326 |
| Monthly | 32,091 | 32,984 | 33,480 | 34,373 | 34,868 |
| S&P500 (^GSPC): Daily | 4,273 | 4,286 | 4,304 | 4,317 | 4,335 |
| Weekly | 4,233 | 4,266 | 4,294 | 4,327 | 4,356 |
| Monthly | 3,998 | 4,148 | 4,235 | 4,386 | 4,473 |
| Nasdaq (^IXIC): Daily | 13,135 | 13,197 | 13,291 | 13,354 | 13,448 |
| Weekly | 12,948 | 13,104 | 13,245 | 13,400 | 13,541 |
| Monthly | 11,583 | 12,421 | 12,904 | 13,741 | 14,224 |
Here are the formulas:
![]()
Earnings season is over.
Here's a symbol list of 166 chart and candlestick patterns (13 "investment grade" candle patterns) found in today's securities using my version of Patternz: ADBE, AMD, A, ATSG, ALB, AEE, AMGN, AMN, ASH, AGO, ATO, AVNT, BMRN, BKNG, BOOT, BAH, BFH, BR, BBW, CACI, CDNS, CE, CX, CNC, CDAY, CI, CLF, CNA, CMTL, GLW, COTY, CR, CROX, CCK, XRAY, BOOM, EBAY, ECL, ELV, EMR, WIRE, EOG, EVRG, EVH, EXPI, FFIV, FARO, FLS, FORM, FCX, GD, GL, GES, HLIT, HWM, HUM, HUN, HURC, IEX, IBP, IIIN, INTC, IPG, NVTA, JKHY, JBLU, KBH, KEYS, KLIC, LHX, LRCX, LAMR, LEN, RAMP, LXU, M, MCHX, MTRX, MRK, MU, NBR, NFLX, NWL, NEU, NI, NWPX, NTNX, OLN, ON, PDCO, PAYX, PEN, PFE, PNW, PPG, PHM, KWR, QCOM, DGX, RMBS, RTX, RNG, ROK, RCKY, ROL, R, CRM, SMG, SRE, SCI, SCCO, SWX, TDOC, TKR, TJX, RIG, TREX, UHAL, UGI, VECO, WMT, WSO, WLK, ZBRA, IYC, FXI, IYH, IYZ, IXN, EWZ, EEM, EIS, EWJ, EWW, EZA, EWY, EWP, EWL, EWT, PBE, PXJ, XLY, XLF, XRT, XAR, XLK, XLU, USO. Click this link for details (pattern type, start and end dates).
For a list of small patterns (those a few days wide) click this link.
The below industries were the best (rank 1) or worst performing of those I follow.
|
-- Thomas Bulkowski
![]()
$ $ $
Here's a symbol list of 169 chart and candlestick patterns (13 "investment grade" candle patterns) found in today's securities using my version of Patternz: ACN, ACIW, ATSG, AKAM, ALB, ALGT, AMGN, AMN, ADM, ARW, ASH, ATO, AVNT, BMI, BSET, BIIB, BMRN, BCO, BR, BBW, CE, CX, CNC, CDAY, CHKP, CHS, CI, CSCO, CLF, CNA, CMTL, COP, COTY, CROX, CCK, CSGS, XRAY, DDS, BOOM, EMN, ECL, EMR, EQT, EVRG, EVH, EXPI, FDS, FARO, FISV, FIVN, FLS, FORM, FCX, FRD, GME, IT, GILD, GFF, HE, HAYN, HP, HWM, HUN, ITW, INFN, NSP, IBP, IIIN, IPI, JBLU, KBH, KMT, LHX, LAMR, LEN, LLY, LOW, M, MGY, MANH, MRO, MTRX, MRCY, MU, MCO, NBR, NWL, NEU, NOVT, NTNX, OLN, OMCL, OTEX, PKG, PDCO, PCG, PNW, PPG, PHM, KWR, RTX, REGN, RGA, RNG, ROL, RES, SEE, SCI, SHOP, SMAR, SCCO, SPSC, TDOC, TKR, TG, TREX, TWLO, SLCA, VECO, VEEV, MDRX, VRTX, WMT, WSO, WU, WLK, FXI, IYZ, IEV, IGE, EWQ, EWM, EWS, EWL, PPA, DBA, PXJ, SSO, ROBO, GLD, XLI, XAR, XLU, USO, VHT, VIS. Click this link for details (pattern type, start and end dates).
For a list of small patterns (those a few days wide) click this link.
$ $ $
You can find setups based on a Fibonacci retrace by clicking on the link.
The following patterns were found manually, not using Patternz. Mr. Bulkowski has excluded any securities he owns from appearing in the list. However, he may add any of the securities listed to his portfolio at any time, just as you can.
In the table below, the red and green colors are based on the historical breakout direction for the associated chart pattern. If a high and tight flag appears, the start and end dates highlight the flagpole only and not the flag.
For details about the chart patterns, click here.
-- Thomas Bulkowski
![]()
| Symbol | Chart Pattern | Bullish Bearish | Start | End | Industry |
| DDD | Big W | 05/09/2023 | 05/26/2023 | Electronics | |
| ADTN | Ugly double bottom | 05/09/2023 | 05/25/2023 | Telecom. Equipment | |
| APD | Broadening bottom | 05/11/2023 | 06/08/2023 | Chemical (Diversified) | |
| ALRM | Ugly double bottom | 05/04/2023 | 06/01/2023 | Computer Software and Svcs | |
| ANIK | Broadening top | 05/22/2023 | 06/06/2023 | Biotechnology | |
| BOOT | Double Bottom, Eve and Adam | 05/19/2023 | 06/01/2023 | Shoe | |
| BAH | Head-and-shoulders complex bottom | 01/20/2023 | 05/25/2023 | IT Services | |
| BCO | Ugly double bottom | 05/04/2023 | 05/31/2023 | Industrial Services | |
| BRKR | Double Bottom, Adam and Adam | 05/24/2023 | 05/31/2023 | Precision Instrument | |
| BBW | Pipe bottom | 05/22/2023 | 05/30/2023 | Retail (Special Lines) | |
| CX | Pipe bottom | 05/22/2023 | 05/30/2023 | Cement and Aggregates | |
| CNC | Pipe bottom | 05/22/2023 | 05/30/2023 | Medical Services | |
| CENX | Pipe bottom | 05/08/2023 | 05/15/2023 | Metals and Mining (Div.) | |
| CI | Pipe bottom | 05/22/2023 | 05/30/2023 | Medical Services | |
| CLF | Pipe bottom | 05/22/2023 | 05/30/2023 | Metals and Mining (Div.) | |
| CNA | Pipe bottom | 05/22/2023 | 05/30/2023 | Insurance (Prop/Casualty) | |
| CNX | Pipe bottom | 04/24/2023 | 05/01/2023 | Natural Gas (Diversified) | |
| COP | Triangle, symmetrical | 02/10/2023 | 06/08/2023 | Petroleum (Integrated) | |
| COTY | Pipe bottom | 05/22/2023 | 05/30/2023 | Toiletries/Cosmetics | |
| CR | Ugly double bottom | 05/04/2023 | 05/17/2023 | Diversified Co. | |
| CROX | Pipe bottom | 05/22/2023 | 05/30/2023 | Shoe | |
| CCK | Pipe bottom | 05/22/2023 | 05/30/2023 | Packaging and Container | |
| CW | Double Bottom, Adam and Eve | 05/04/2023 | 05/31/2023 | Machinery | |
| DHR | Three Rising Valleys | 05/17/2023 | 05/31/2023 | Medical Services | |
| DECK | Pipe bottom | 05/15/2023 | 05/22/2023 | Shoe | |
| DDS | Triple bottom | 05/11/2023 | 06/01/2023 | Retail Store | |
| ^DJT | Triple bottom | 05/16/2023 | 06/01/2023 | None | |
| ^DJI | Double Bottom, Adam and Adam | 05/25/2023 | 06/01/2023 | None | |
| EMR | Pipe bottom | 05/22/2023 | 05/30/2023 | Computers and Peripherals | |
| WIRE | Double Bottom, Eve and Eve | 05/23/2023 | 06/01/2023 | Metals and Mining (Div.) | |
| EPAM | Dead-cat bounce | 06/05/2023 | 06/05/2023 | IT Services | |
| FLS | Pipe bottom | 05/22/2023 | 05/30/2023 | Machinery | |
| FWRD | Double Bottom, Eve and Adam | 05/16/2023 | 05/25/2023 | Trucking/Transp. Leasing | |
| FCX | Pipe bottom | 05/22/2023 | 05/30/2023 | Metals and Mining (Div.) | |
| GME | Dead-cat bounce | 06/08/2023 | 06/08/2023 | Retail (Special Lines) | |
| GPRO | Head-and-shoulders bottom | 05/02/2023 | 05/25/2023 | Electronics | |
| HBI | Double Bottom, Adam and Eve | 05/16/2023 | 06/01/2023 | Apparel | |
| HQY | Ugly double bottom | 05/04/2023 | 05/31/2023 | Healthcare Information | |
| HSII | Triple bottom | 04/26/2023 | 05/31/2023 | Human Resources | |
| HD | Double Bottom, Adam and Adam | 05/16/2023 | 06/01/2023 | Retail Building Supply | |
| NSP | Double Bottom, Adam and Adam | 05/16/2023 | 05/31/2023 | Human Resources | |
| IBP | Pipe bottom | 05/22/2023 | 05/30/2023 | Retail Building Supply | |
| TILE | Pipe bottom | 05/08/2023 | 05/15/2023 | Furn/Home Furnishings | |
| KFRC | Ugly double bottom | 05/09/2023 | 06/01/2023 | Human Resources | |
| LHX | Pipe bottom | 05/22/2023 | 05/30/2023 | Aerospace/Defense | |
| M | Pipe bottom | 05/22/2023 | 05/30/2023 | Retail Store | |
| MAN | Double Bottom, Eve and Adam | 05/09/2023 | 05/31/2023 | Human Resources | |
| MTRN | Double Bottom, Eve and Eve | 05/11/2023 | 05/31/2023 | Metals and Mining (Div.) | |
| MDC | Broadening top | 05/03/2023 | 06/07/2023 | Homebuilding | |
| MUR | Ugly double bottom | 05/12/2023 | 05/31/2023 | Petroleum (Integrated) | |
| NBR | Horn bottom | 05/15/2023 | 05/30/2023 | Oilfield Svcs/Equipment | |
| NFG | Double Bottom, Eve and Eve | 05/16/2023 | 05/26/2023 | Natural Gas (Diversified) | |
| OUT | Triple bottom | 05/16/2023 | 06/01/2023 | Advertising | |
| PNW | Double Bottom, Adam and Adam | 05/25/2023 | 06/02/2023 | Electric Utility (West) | |
| PHM | Pipe bottom | 05/22/2023 | 05/30/2023 | Homebuilding | |
| RTX | Pipe bottom | 05/22/2023 | 05/30/2023 | Aerospace/Defense | |
| RCKY | Double Bottom, Adam and Adam | 05/12/2023 | 05/25/2023 | Shoe | |
| ROG | Multiple tops | 03/01/2023 | 06/08/2023 | Electronics | |
| ^GSPC | Double Bottom, Adam and Adam | 04/26/2023 | 05/04/2023 | None | |
| SLB | Double Bottom, Adam and Adam | 05/16/2023 | 05/31/2023 | Oilfield Svcs/Equipment | |
| SMG | Triangle, descending | 05/04/2023 | 06/08/2023 | Chemical (Basic) | |
| SKX | Double Bottom, Adam and Adam | 05/24/2023 | 06/01/2023 | Shoe | |
| SMAR | Dead-cat bounce | 06/08/2023 | 06/08/2023 | E-Commerce | |
| TRGP | Broadening bottom | 05/15/2023 | 06/08/2023 | Natural Gas (Diversified) | |
| TECH | Head-and-shoulders top | 04/17/2023 | 05/22/2023 | Biotechnology | |
| TDG | Double Bottom, Adam and Adam | 05/24/2023 | 05/31/2023 | Aerospace/Defense | |
| TREX | Pipe bottom | 05/22/2023 | 05/30/2023 | Building Materials | |
| UGI | Head-and-shoulders bottom | 05/16/2023 | 06/05/2023 | Natural Gas (Distributor) | |
| WSO | Pipe bottom | 05/22/2023 | 05/30/2023 | Retail Building Supply | |
| WMB | Double Bottom, Eve and Eve | 05/16/2023 | 05/31/2023 | Natural Gas (Distributor) |
![]()
Since I post this the night before, check how the futures are trading before market open. Large moves can affect the opening direction.
$ $ $
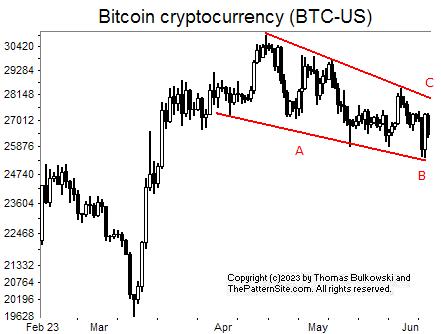
I show a picture of the Bitcoin (BTC-USD) on the daily scale.
Bitcoin shows a falling wedge chart pattern, shown here outlined in red at A. The breakout from those patterns is upward 68% of the time, but that's in stocks.
Notice that the cryptocurrency touched the bottom of the wedge at B. Because the bottom red trendline is a support area, it suggests a rise to C. Maybe, just maybe, we'll see an upward breakout immediately thereafter.
I'd say the wedge is a bullish pattern, and it is, but in this case, it could be a trap. Why? It could be a bearish top trap. If you erase the red lines, we see a horizontal top, forming a bullish chart pattern. Price may rise but it won't go far before reversing and tumbling. In other words, be cautious.
$ $ $
Here's a symbol list of 249 chart and candlestick patterns (13 "investment grade" candle patterns) found in today's securities using my version of Patternz: DDD, ACIW, ADBE, ADTN, AEIS, APD, ATSG, ALKS, AMZN, AMED, AEE, AMN, APA, APOG, ATR, ATO, BALL, BIG, BIIB, BMRN, BKNG, BOOT, BFH, BMY, BR, BBW, BG, CALM, CAL, CX, CNC, CDAY, CF, CHKP, CVX, CHD, CI, CTAS, CLNE, CLF, CLX, CNA, CNX, CL, CMCO, CMTL, CONN, COP, COTY, CR, CROX, CCK, XRAY, DVN, FANG, DDS, DFS, DSGR, ECL, EMR, WIRE, EOG, EQT, EVH, EXPI, XOM, EZPW, FAST, FLS, FNV, FCX, FDP, FRD, GPN, GES, HBI, HSC, HIG, HE, HAYN, HSII, HELE, HD, HURC, ILMN, INCY, IBP, IBKR, TILE, IPI, JBLU, KALU, KBH, K, KMT, KFRC, LHX, LZB, LAMR, LEG, LEN, LXU, MHO, M, MGY, MRO, MLM, MAS, MTDR, MTRX, MDT, MRK, MRCY, META, MU, MLKN, MCO, MUR, NBR, ^IXIC, NI, NOVT, NUS, NTNX, OXY, ORI, OMC, ASGN, OTEX, OR, OUT, PDCO, PTEN, PYPL, PETS, PFE, PNW, PXD, PPG, PEG, PHM, PSTG, RRC, RTX, RGA, RNG, RHI, RCKY, ROL, ROST, RGLD, RES, ^GSPC, CRM, SLB, SCI, SHOP, STR, SKX, SMAR, SCCO, SWN, SPLK, SCS, TPR, TRGP, TDOC, TDC, TSCO, TZOO, TG, TREX, TWLO, VEEV, VRTX, WSO, WU, WPM, WMB, WSM, WSC, WWW, ITB, IEZ, IDU, FTEC, FDN, QTEC, FXI, QQQ, IYH, IHF, IYZ, IEV, IGV, MXI, SLV, IGE, IHI, EWQ, EWG, EWI, EWM, EWS, EWL, THD, EWU, QLD, PPA, DBA, PXJ, SSO, XLE, XLF, XLV, XLI, SPY, XAR, VHT, VIS, MGK. Click this link for details (pattern type, start and end dates).
For a list of small patterns (those a few days wide) click this link.
$ $ $
The following table shows where Fibonacci retrace values of the day's high-low range are plus pivot points, calculated on the Nasdaq composite, sorted by value. When several are near each other (small differences), the area might act as support or resistance.
-- Thomas Bulkowski
![]()
| © 2023 ThePatternSite.com Metric | Value | Diff | Close (within 10% of the high-low range for the day)? |
| Monthly S2 | 11,431.32 | ||
| Monthly S1 | 12,268.11 | 836.79 | |
| Weekly S2 | 12,716.65 | 448.54 | |
| Monthly Pivot | 12,762.16 | 45.51 | |
| Weekly S1 | 12,910.78 | 148.62 | |
| Daily S2 | 12,913.01 | 2.23 | Yes! The Daily S2 is close to the Weekly S1. |
| Daily S1 | 13,008.95 | 95.95 | |
| Weekly Pivot | 13,083.49 | 74.54 | |
| Low | 13,089.48 | 5.99 | Yes! The Low is close to the Weekly Pivot. |
| Close | 13,104.90 | 15.42 | Yes! The Close is close to the Low. |
| Daily Pivot | 13,185.43 | 80.53 | |
| 61.8% Down from Intraday High | 13,193.54 | 8.12 | Yes! The 61.8% Down from Intraday High is close to the Daily Pivot. |
| 50% Down from Intraday High | 13,225.69 | 32.15 | |
| 38.2% Down from Intraday High | 13,257.84 | 32.15 | |
| Weekly R1 | 13,277.62 | 19.78 | Yes! The Weekly R1 is close to the 38.2% Down from Intraday High. |
| Daily R1 | 13,281.37 | 3.76 | Yes! The Daily R1 is close to the Weekly R1. |
| Open | 13,295.26 | 13.89 | Yes! The Open is close to the Daily R1. |
| High | 13,361.90 | 66.64 | |
| Weekly R2 | 13,450.33 | 88.43 | |
| Daily R2 | 13,457.85 | 7.51 | Yes! The Daily R2 is close to the Weekly R2. |
| Monthly R1 | 13,598.95 | 141.10 | |
| Monthly R2 | 14,093.00 | 494.05 |
This is a picture of the chart pattern indicator on the daily scale. The indicator is the line chart below a chart of the S&P 500 composite.
The CPI chart shows a bullish signal and it's a strong one. The index has pushed above nearby overhead resistance. Although the index might retrace, with the debt ceiling suspended until 2025, there's room for growth. Tempering that is the coming Federal Reserve meeting coming next month. Worries about that meeting's outcome will continue.
The red line is the percentage of stocks at least 20% below their 1-year high (plotted upside down). The blue line is the average percentage drop of stocks below their 1-year high (plotted upside down).
On Tuesday, 38% of stocks in my database are in bear market territory (down at least 20% from their 1-year high).A week ago, it was 44%.The fewest was 31% on 02/02/2023.And the most was 80% on 06/17/2022.
The 522 stocks in my database are down an average of 19% from their yearly high.A week ago, the average was 21%.The peak was 16% on 02/02/2023.And the bottom was 34% on 09/30/2022.
Both the red and blue lines are bullish compared to a week ago. That's the good news.
This chart shows a peak last August and the index is reaching the level of that peak. So despite what I wrote above about minimal resistance above, there IS overhead resistance shown on this chart.
So there's concern about the index moving higher or perhaps suffering a retrace. The prior chart is bullish and so is this one. While I expect a retrace, I think it'll be short lived and we'll see a resumption of a move higher.
$ $ $
Here's a symbol list of 263 chart and candlestick patterns (13 "investment grade" candle patterns) found in today's securities using my version of Patternz: ANF, ACN, ACIW, AEIS, ATSG, ALB, ALGT, AMN, APOG, ATR, ARCB, ADM, ARW, AVY, AVNT, AXS, BCPC, BECN, BERY, BBY, BMRN, BKNG, BSX, BFH, BMY, BR, BBW, BG, CALM, CE, CX, CNC, CENX, CDAY, CHS, CHD, CI, CLNE, CLF, CLX, CNA, CL, CMCO, CMTL, CONN, CXW, COTY, CR, CROX, CCK, CW, XRAY, DDS, DSGR, DUK, ECL, EIX, EMR, WIRE, EPAM, EQT, EVH, EXPI, XOM, FARO, FIVN, FLEX, FLS, FMC, FORM, FWRD, FCX, GME, GPS, IT, GIS, GPN, GMS, GPRO, GGG, GES, THG, HQY, HTLD, HSII, HELE, HD, HUBG, HURC, ITW, ILMN, INCY, IBP, IIIN, IPAR, IBKR, TILE, IPG, INTU, JBLU, KALU, KBH, K, KMT, KFRC, KSS, KLIC, LHX, LZB, LAMR, LEG, LEN, LNC, M, MRTN, MTDR, MTRN, MTRX, MRK, MRCY, MU, MLKN, MS, MOS, NBR, NCR, NFLX, JWN, NWPX, NTNX, ORI, OLN, OMC, ASGN, ON, OTEX, OMI, PKG, PFE, PLXS, PPG, PFG, PRU, PHM, QTWO, KWR, QCOM, RRC, RJF, RTX, RGS, RNG, ROK, RCKY, ROL, SAIA, CRM, SBH, SEE, SEIC, SIGI, SCI, SHOP, SCCO, LUV, SWN, SPLK, SUM, SRDX, TPR, TDOC, TER, TSCO, RIG, TREX, UHAL, SLCA, UIS, UNH, UNM, VMI, VECO, VRTX, V, VC, WAT, WSO, WLK, WEX, WSM, WSC, WOLF, WWW, IYM, IAI, IYC, ITB, QTEC, FXL, FXI, IYH, IHF, MXI, SOXX, IYF, IHI, EWA, EWC, ECH, EEM, EWQ, EWJ, EWM, EPP, EWS, EWP, EWD, EWU, DBA, PBE, PHO, ROBO, XLF, XLV, XLB, XRT, XAR, USO, SMH, VHT, VIS, VAW, MGK. Click this link for details (pattern type, start and end dates).
For a list of small patterns (those a few days wide) click this link.
-- Thomas Bulkowski
![]()
$ $ $
I show another slider trading quiz featuring VF Corp: VFC stock.
$ $ $
Here's a symbol list of 127 chart and candlestick patterns (13 "investment grade" candle patterns) found in today's securities using my version of Patternz: AXDX, AEIS, AJRD, AES, AFL, ALL, AMZN, AMED, AEE, AEP, AIG, AME, APH, AR, ADM, ADSK, BSET, BERY, BA, BKNG, BSX, BG, CDNS, CPB, CX, CVX, CLNE, CNX, CL, CXW, GLW, COTY, CCK, CSGS, DHR, DECK, DVN, FANG, D, DTE, EPAM, XOM, EZPW, FE, FISV, FLS, FDP, GE, GPN, GFS, GL, HSC, HUM, JBHT, IEX, ITW, IPI, JBLU, K, KELYA, KMB, MGY, MRO, MRK, MU, MUR, NFLX, NEWR, NKE, NTNX, OXY, OGE, OMI, PANW, PRFT, PNW, PXD, PPL, PEG, RMBS, RRC, RGA, RNG, SLB, SCHW, SAIC, SIGI, SHOP, STR, SWN, SXI, TXN, RIG, TZOO, UPS, VLO, VRTX, WMT, WAT, WSO, WPM, WMB, ITA, IEZ, IDU, IYH, IGE, EWZ, EWH, TUR, PPA, PXJ, XLY, XLE, XLI, XLU, USO. Click this link for details (pattern type, start and end dates).
For a list of small patterns (those a few days wide) click this link.
$ $ $
The following table shows where Fibonacci retrace values of the day's high-low range are plus pivot points, calculated on the Dow industrials, sorted by value. When several are near each other (small differences), the area might act as support or resistance.
-- Thomas Bulkowski
![]()
| © 2023 ThePatternSite.com Metric | Value | Diff | Close (within 10% of the high-low range for the day)? |
| Monthly S2 | 31,797.81 | ||
| Weekly S2 | 32,256.97 | 459.15 | |
| Monthly S1 | 32,680.34 | 423.37 | |
| Weekly S1 | 32,909.91 | 229.58 | |
| Weekly Pivot | 33,357.46 | 447.54 | |
| Daily S2 | 33,388.53 | 31.07 | |
| Monthly Pivot | 33,469.08 | 80.55 | |
| Daily S1 | 33,475.70 | 6.61 | Yes! The Daily S1 is close to the Monthly Pivot. |
| Low | 33,552.79 | 77.09 | |
| Close | 33,562.86 | 10.07 | Yes! The Close is close to the Low. |
| Daily Pivot | 33,639.96 | 77.10 | |
| 61.8% Down from Intraday High | 33,648.84 | 8.88 | Yes! The 61.8% Down from Intraday High is close to the Daily Pivot. |
| 50% Down from Intraday High | 33,678.50 | 29.67 | |
| 38.2% Down from Intraday High | 33,708.17 | 29.67 | |
| Daily R1 | 33,727.13 | 18.95 | Yes! The Daily R1 is close to the 38.2% Down from Intraday High. |
| Open | 33,771.13 | 44.00 | |
| High | 33,804.22 | 33.09 | |
| Daily R2 | 33,891.39 | 87.17 | |
| Weekly R1 | 34,010.40 | 119.02 | |
| Monthly R1 | 34,351.61 | 341.20 | |
| Weekly R2 | 34,457.95 | 106.34 | |
| Monthly R2 | 35,140.35 | 682.41 |
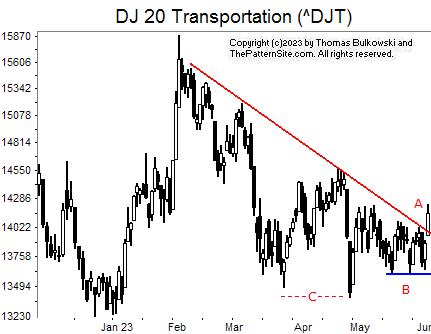
I show the Dow transports on the daily scale.
At A, the index breaks through a down-sloping trendline suggesting there's a good rise in store. I think that assessment is correct.
At B, we have support in the form of a triple bottom chart pattern. With the close at A above the top of the chart pattern, it confirmed the triple bottom as a valid chart pattern.
At C, we see a potential double bottom. The index has to close above the highest peak between the two bottoms to confirm it as valid. If it confirms, it'll suggest another rise.
![]()
The following is a brief review of how the markets performed over time. The numbers refer to the close-to-close move in the Dow industrials.
No options expire this week.
![]()
The following is based on an SFO article in December 2004 by John Seekinger, titled, "Take a two-dimensional approach." He offers these tips.
| Index | S2 | S1 | Pivot | R1 | R2 |
| Dow Industrials (^DJI): Daily | 32,968 | 33,365 | 33,585 | 33,983 | 34,203 |
| Weekly | 32,324 | 33,043 | 33,424 | 34,144 | 34,525 |
| Monthly | 31,864 | 32,814 | 33,536 | 34,485 | 35,207 |
| S&P500 (^GSPC): Daily | 4,222 | 4,252 | 4,271 | 4,302 | 4,321 |
| Weekly | 4,122 | 4,202 | 4,246 | 4,327 | 4,371 |
| Monthly | 3,965 | 4,124 | 4,207 | 4,366 | 4,449 |
| Nasdaq (^IXIC): Daily | 13,077 | 13,159 | 13,208 | 13,289 | 13,338 |
| Weekly | 12,762 | 13,001 | 13,129 | 13,368 | 13,496 |
| Monthly | 11,477 | 12,359 | 12,807 | 13,690 | 14,138 |
Here are the formulas:
![]()
Earnings season is over.
Here's a symbol list of 153 chart and candlestick patterns (13 "investment grade" candle patterns) found in today's securities using my version of Patternz: AEIS, ATSG, ALRM, AMZN, AXP, AR, ANET, AGO, ATO, AVY, AVA, AXS, BCPC, BSET, BIIB, BKH, BKNG, BBW, BG, CBT, CF, CLX, CMCO, CMTL, ED, CSGP, COTY, CR, CRH, CW, DECK, DDS, DFS, DSGR, BOOM, EME, WIRE, EVH, XOM, FISV, FMC, FCX, GIS, GGG, HAYN, HQY, HELE, HP, HSY, IDXX, NSP, IBKR, TILE, KELYA, LRCX, LAMR, LEG, LEN, MHO, MA, MCO, MYGN, NBR, NEWR, NWL, NEU, NI, NWPX, NTNX, OGE, ORI, OMI, OXM, PATK, PTEN, PXD, PINC, PEG, RMBS, RJF, REGN, RGS, RNG, RLI, RCKY, RES, R, ^GSPC, SAIA, SHW, SHOP, SLGN, SKX, SKYW, SO, SCCO, SWX, SWN, SSYS, TTD, TOL, TREX, MDRX, VRSN, V, WEX, WPM, WMB, WSC, WWD, XEL, IYK, ITB, IHE, BOTZ, IYH, IYZ, MXI, IXN, EWA, EWK, EWQ, EWG, EWH, EWI, EWJ, EWM, EPP, EZA, EWY, EWP, EWT, THD, TUR, EWU, PEJ, SSO, ROBO, XLY, SPY, XLK, VHT. Click this link for details (pattern type, start and end dates).
For a list of small patterns (those a few days wide) click this link.
The below industries were the best (rank 1) or worst performing of those I follow.
|
-- Thomas Bulkowski
![]()
New research. How does crypto performance compare to stocks and ETFs?
$ $ $
Here's a symbol list of 139 chart and candlestick patterns (13 "investment grade" candle patterns) found in today's securities using my version of Patternz: AYI, AEIS, AFL, AYX, ABC, AR, ARCB, AVY, BIIB, BMRN, BKNG, BOOT, BSX, BBW, CDNS, CALM, CNC, CDAY, CNX, CL, ED, CAG, CONN, DECK, ^DJU, DOV, DRQ, DUK, EMN, ELV, EVH, XOM, FFIV, FICO, FAST, FIS, FTNT, FWRD, FRD, GILD, GS, HBI, THG, HSC, HE, HP, HSIC, HWM, ILMN, PODD, KBH, KELYA, KMB, LZB, LRCX, LEG, LEN, MGY, MAN, MRK, MRCY, META, MGEE, MSFT, NEWR, NEU, NKE, JWN, NTNX, OGE, OUT, OMI, OXM, PTEN, PNW, PPG, PEG, PSTG, RRC, RGA, RNG, RHI, RCKY, SBH, SEE, SEIC, SHOP, SKX, SKYW, SO, SWX, SWN, SPSC, SSYS, SUM, SRDX, TPR, TECH, TDOC, RIG, TZOO, TREX, UHAL, UIS, UNM, VLO, WMT, XEL, IYC, IEZ, IHE, FTEC, QQQ, IYH, IHF, IXN, ILF, IYF, EWQ, EIS, EWI, EWM, TUR, QLD, IBB, PXJ, XLY, XLV, SPY, XLK, UNG, VHT, MGK. Click this link for details (pattern type, start and end dates).
For a list of small patterns (those a few days wide) click this link.
$ $ $
You can find setups based on a Fibonacci retrace by clicking on the link.
The following patterns were found manually, not using Patternz. Mr. Bulkowski has excluded any securities he owns from appearing in the list. However, he may add any of the securities listed to his portfolio at any time, just as you can.
In the table below, the red and green colors are based on the historical breakout direction for the associated chart pattern. If a high and tight flag appears, the start and end dates highlight the flagpole only and not the flag.
For details about the chart patterns, click here.
-- Thomas Bulkowski
![]()
| Symbol | Chart Pattern | Bullish Bearish | Start | End | Industry |
| AYX | Triple bottom | 05/03/2023 | 05/26/2023 | Computer Software and Svcs | |
| DOX | Broadening top, right-angled and descending | 02/01/2023 | 05/26/2023 | IT Services | |
| AXP | Head-and-shoulders bottom | 05/04/2023 | 05/25/2023 | Financial Services | |
| APH | Double Bottom, Adam and Adam | 04/26/2023 | 05/24/2023 | Electronics | |
| AR | Pipe top | 05/15/2023 | 05/15/2023 | Natural Gas (Diversified) | |
| ANET | Horn bottom | 05/01/2023 | 05/15/2023 | E-Commerce | |
| BIG | Dead-cat bounce | 05/26/2023 | 05/26/2023 | Retail Store | |
| BA | Head-and-shoulders bottom | 04/14/2023 | 05/25/2023 | Aerospace/Defense | |
| BKNG | Pipe top | 05/15/2023 | 05/22/2023 | Internet | |
| BG | Double Bottom, Adam and Adam | 05/09/2023 | 05/18/2023 | Food Processing | |
| CDNS | Three Rising Valleys | 04/25/2023 | 05/24/2023 | Computer Software and Svcs | |
| CNC | Head-and-shoulders top | 04/14/2023 | 04/28/2023 | Medical Services | |
| CSCO | Triple bottom | 04/27/2023 | 05/18/2023 | Computers and Peripherals | |
| CL | Double Top, Adam and Adam | 05/04/2023 | 05/12/2023 | Household Products | |
| EZPW | Pipe top | 05/01/2023 | 05/08/2023 | Financial Services | |
| GFS | Pipe bottom | 05/08/2023 | 05/15/2023 | Semiconductor | |
| HTLD | Pipe bottom | 04/24/2023 | 05/01/2023 | Trucking/Transp. Leasing | |
| HON | Head-and-shoulders top | 04/18/2023 | 05/19/2023 | Aerospace/Defense | |
| HWM | Triple top | 05/02/2023 | 05/19/2023 | Aerospace/Defense | |
| ITW | Triple top | 02/02/2023 | 05/01/2023 | Metal Fabricating | |
| PODD | Head-and-shoulders top | 04/20/2023 | 05/15/2023 | Medical Supplies | |
| JKHY | Double Bottom, Eve and Eve | 05/18/2023 | 05/25/2023 | IT Services | |
| KELYA | Pipe top | 05/15/2023 | 05/22/2023 | Human Resources | |
| MAS | Three Falling Peaks | 04/26/2023 | 05/10/2023 | Building Materials | |
| NEWR | Pipe top | 05/15/2023 | 05/22/2023 | E-Commerce | |
| ORI | Double Top, Eve and Eve | 05/01/2023 | 05/19/2023 | Insurance (Prop/Casualty) | |
| ROL | Double Top, Adam and Adam | 04/28/2023 | 05/12/2023 | Industrial Services | |
| SAIA | Double Bottom, Adam and Adam | 05/16/2023 | 05/24/2023 | Trucking/Transp. Leasing | |
| SBH | Roof | 05/10/2023 | 06/01/2023 | Toiletries/Cosmetics | |
| SKX | Double Top, Eve and Eve | 05/01/2023 | 05/15/2023 | Shoe | |
| SXI | Head-and-shoulders top | 05/12/2023 | 05/30/2023 | Diversified Co. | |
| TTD | Three Rising Valleys | 04/06/2023 | 05/11/2023 | Advertising | |
| TSCO | Head-and-shoulders complex top | 04/03/2023 | 05/11/2023 | Retail Building Supply | |
| SLCA | Triple top | 04/28/2023 | 05/23/2023 | Metals and Mining (Div.) | |
| WMT | Double Top, Adam and Eve | 04/25/2023 | 05/10/2023 | Retail Store | |
| WU | Double Top, Eve and Eve | 05/08/2023 | 05/18/2023 | Financial Services | |
| WSM | Diamond bottom | 05/11/2023 | 06/01/2023 | Retail (Special Lines) | |
| IAI | Triple top | 07/23/2019 | 11/15/2019 | Securities Brokerage | |
| IYC | Triple top | 02/21/2017 | 03/17/2017 | Retail Store | |
| IYE | Triple bottom | 08/15/2019 | 10/03/2019 | Petroleum (Integrated) | |
| ITB | Triple top | 04/24/2019 | 05/16/2019 | Homebuilding | |
| IEZ | Double Bottom, Adam and Eve | 07/14/2022 | 09/26/2022 | Oilfield Svcs/Equipment | |
| IDU | Triple bottom | 09/04/2012 | 09/28/2012 | Electric Utility (Central) | |
| DOG | Triple bottom | 09/30/2016 | 10/24/2016 | Short ETFs | |
| DXD | Triple bottom | 01/13/2023 | 02/14/2023 | Short ETFs | |
| DDM | Triple bottom | 05/07/2014 | 08/07/2014 | Long ETFs | |
| FTEC | Triple top | 09/22/2016 | 10/24/2016 | IT Services | |
| QTEC | Triple top | 10/27/2011 | 11/16/2011 | Electronics | |
| FXL | Triple top | 08/01/2013 | 08/22/2013 | IT Services | |
| BOTZ | Triple top | 08/29/2018 | 10/01/2018 | Electronics | |
| ICF | Triple top | 09/12/2017 | 12/18/2017 | Long ETFs | |
| IAT | Triple bottom | 04/17/2017 | 05/31/2017 | Long ETFs | |
| IYZ | Triple bottom | 10/24/2019 | 12/03/2019 | Telecom. Equipment | |
| IEV | Triple top | 11/04/2019 | 11/27/2019 | Investment Co. (Foreign) | |
| IXC | Triple top | 09/16/2019 | 12/13/2019 | Investment Co. (Foreign) | |
| MXI | Triple bottom | 05/20/2014 | 06/17/2014 | Investment Co. (Foreign) | |
| IXN | Triple bottom | 04/15/2014 | 05/07/2014 | IT Services | |
| ILF | Triple bottom | 06/19/2018 | 09/05/2018 | Investment Co. (Foreign) | |
| SLV | Triple top | 05/18/2021 | 06/11/2021 | Metals and Mining (Div.) | |
| IGE | Triple top | 01/30/2013 | 03/15/2013 | Petroleum (Integrated) | |
| IYF | Triple bottom | 10/13/2017 | 02/09/2018 | Financial Services | |
| IHI | Triple top | 02/06/2012 | 02/28/2012 | Medical Supplies | |
| EWA | Triple top | 10/28/2019 | 11/19/2019 | Investment Co. (Foreign) | |
| EWO | Triple top | 11/05/2019 | 01/13/2020 | Investment Co. (Foreign) | |
| EWK | Triple bottom | 11/11/2019 | 12/03/2019 | Investment Co. (Foreign) | |
| EWZ | Double Top, Adam and Adam | 10/21/2022 | 11/04/2022 | Investment Co. (Foreign) | |
| EWC | Triple top | 05/22/2018 | 08/28/2018 | Investment Co. (Foreign) | |
| ECH | Triple top | 05/14/2014 | 06/09/2014 | Investment Co. (Foreign) | |
| EEM | Triple top | 09/06/2016 | 10/10/2016 | Investment Co. (Foreign) | |
| EWQ | Triple bottom | 01/30/2017 | 02/24/2017 | Investment Co. (Foreign) | |
| EWG | Triple top | 09/14/2012 | 10/18/2012 | Investment Co. (Foreign) | |
| EWH | Triple bottom | 04/22/2021 | 05/13/2021 | Investment Co. (Foreign) | |
| EWI | Triple top | 02/01/2023 | 03/06/2023 | Investment Co. (Foreign) | |
| EWJ | Triple bottom | 07/02/2018 | 09/07/2018 | Investment Co. (Foreign) | |
| EWM | Triple top | 02/06/2015 | 02/27/2015 | Investment Co. (Foreign) | |
| EWW | Triple bottom | 07/14/2022 | 09/26/2022 | Investment Co. (Foreign) | |
| EPP | Triple bottom | 05/20/2014 | 07/10/2014 | Investment Co. (Foreign) | |
| EWS | Triple top | 11/07/2019 | 12/13/2019 | Investment Co. (Foreign) | |
| EZA | Triple top | 10/28/2019 | 11/20/2019 | Investment Co. (Foreign) | |
| EWY | Double Bottom, Eve and Eve | 06/04/2012 | 07/23/2012 | Investment Co. (Foreign) | |
| EWP | Triple bottom | 01/11/2017 | 02/22/2017 | Investment Co. (Foreign) | |
| EWD | Triple top | 04/01/2014 | 06/06/2014 | Investment Co. (Foreign) | |
| EWL | Triple top | 05/23/2014 | 06/19/2014 | Investment Co. (Foreign) | |
| EWT | Triple top | 12/13/2012 | 02/20/2013 | Investment Co. (Foreign) | |
| EWU | Triple bottom | 05/20/2014 | 06/17/2014 | Investment Co. (Foreign) | |
| QLD | Triple top | 08/05/2013 | 08/26/2013 | Long ETFs | |
| PSQ | Triple bottom | 09/22/2016 | 10/25/2016 | Short ETFs | |
| QID | Double Top, Adam and Adam | 12/03/2021 | 12/20/2021 | Short ETFs | |
| PPA | Triple top | 08/15/2016 | 09/06/2016 | Aerospace/Defense | |
| DBA | Triple bottom | 07/05/2022 | 07/22/2022 | Investment Co. (Domestic) | |
| PEJ | Triple top | 06/20/2018 | 07/27/2018 | Long ETFs | |
| PXJ | Triple top | 03/05/2021 | 06/16/2021 | Oilfield Svcs/Equipment | |
| PJP | Triple top | 12/02/2022 | 01/06/2023 | Drug | |
| PHO | Triple top | 03/06/2014 | 06/09/2014 | Investment Co. (Domestic) | |
| SSO | Triple bottom | 03/03/2014 | 03/27/2014 | Long ETFs | |
| SH | Triple bottom | 08/15/2016 | 09/07/2016 | Short ETFs | |
| SDS | Double Bottom, Adam and Adam | 12/01/2022 | 12/13/2022 | Short ETFs | |
| ROBO | Triple bottom | 05/03/2018 | 08/15/2018 | Electronics | |
| XLY | Triple bottom | 10/25/2019 | 12/03/2019 | Investment Co. (Domestic) | |
| XLP | Triple top | 05/10/2021 | 06/04/2021 | Household Products | |
| XLE | Triple bottom | 12/09/2022 | 01/04/2023 | Petroleum (Integrated) | |
| XLV | Double Top, Eve and Eve | 10/01/2018 | 12/04/2018 | Drug | |
| XHB | Triple bottom | 12/04/2013 | 02/03/2014 | Homebuilding | |
| XLI | Triple bottom | 06/29/2017 | 08/29/2017 | Investment Co. (Domestic) | |
| XLB | Triple top | 11/03/2015 | 12/09/2015 | Building Materials | |
| XRT | Triple bottom | 07/12/2012 | 08/02/2012 | Retail Store | |
| SPY | Triple bottom | 03/19/2013 | 04/18/2013 | Long ETFs | |
| XAR | Triple bottom | 01/16/2013 | 02/26/2013 | Aerospace/Defense | |
| XLK | Triple bottom | 07/19/2013 | 10/09/2013 | IT Services | |
| XLU | Triple bottom | 09/23/2015 | 12/11/2015 | Electric Utility (Central) | |
| SMN | Triple bottom | 11/03/2015 | 12/09/2015 | Short ETFs | |
| SKF | Double Bottom, Adam and Adam | 09/14/2012 | 10/18/2012 | Short ETFs | |
| DUG | Double Bottom, Eve and Eve | 11/14/2022 | 01/26/2023 | Short ETFs | |
| SRS | Triple bottom | 11/05/2021 | 11/24/2021 | Short ETFs | |
| UNG | Triple bottom | 01/22/2021 | 04/06/2021 | Natural Gas (Diversified) | |
| VHT | Double Bottom, Adam and Eve | 02/09/2018 | 04/02/2018 | Healthcare Information | |
| VAW | Double Top, Eve and Eve | 01/05/2022 | 04/21/2022 | Chemical (Specialty) | |
| MGK | Triple top | 07/03/2014 | 07/24/2014 | None |
![]()
Here's the updated 2023 forecast, presented in slider format.
I don't show the usual panel from Fidelity because they changed their format and no longer offer the kind of information I need.
$ $ $
Here's a symbol list of 185 chart and candlestick patterns (13 "investment grade" candle patterns) found in today's securities using my version of Patternz: ACIW, AYI, AEIS, AFL, A, ATSG, ALKS, ALGT, AR, ACGL, AVY, BECN, BERY, BIIB, BKH, BKNG, BOOT, BSX, BRKR, CX, CENX, CDAY, CHKP, CHS, CI, CNX, CL, CONN, GLW, CSGP, COTY, CRH, DECK, DVN, FANG, ^DJT, DOV, DRQ, EMN, EBAY, EPAM, XOM, FE, FIVN, GNW, HLIT, HAYN, HTLD, HELE, HUN, INTC, IRM, KALU, KELYA, LEG, L, LXU, MANH, MAN, MRTN, MA, MDC, MRCY, MLKN, MCO, MOS, MLI, NBR, NOV, NEWR, NEE, NXGN, NKE, NI, NTNX, OLN, ASGN, OMI, OXM, PATK, PTEN, PRFT, PXD, PG, RL, RGS, RNG, RCKY, ROL, RES, SBH, SMG, SEE, SEIC, SIGI, SHOP, SWX, SWN, SPSC, SCS, SSYS, TPR, TRGP, TPX, TJX, TREX, UGI, UIS, VLO, VMI, MDRX, V, WAT, WSO, WERN, WLK, WSC, IYM, IAI, ITB, IEZ, IHE, FDN, ICF, IEV, IXC, MXI, ILF, IGE, IEO, EWA, EWO, EWK, EWZ, EWC, EWQ, EWG, EWH, EIS, EWI, EWJ, EWM, EWW, EPP, EWS, EWP, EWL, TUR, EWU, IBB, DBA, PEJ, PXJ, XHB, XLB, XRT, UNG, USO, VIS. Click this link for details (pattern type, start and end dates).
For a list of small patterns (those a few days wide) click this link.
$ $ $
The following table shows where Fibonacci retrace values of the day's high-low range are plus pivot points, calculated on the Nasdaq composite, sorted by value. When several are near each other (small differences), the area might act as support or resistance.
-- Thomas Bulkowski
![]()
| © 2023 ThePatternSite.com Metric | Value | Diff | Close (within 10% of the high-low range for the day)? |
| Monthly S2 | 11,375.52 | ||
| Monthly S1 | 12,155.40 | 779.89 | |
| Weekly S2 | 12,198.29 | 42.89 | |
| Weekly S1 | 12,566.79 | 368.50 | |
| Monthly Pivot | 12,578.66 | 11.87 | Yes! The Monthly Pivot is close to the Weekly S1. |
| Weekly Pivot | 12,784.35 | 205.69 | |
| Daily S2 | 12,811.54 | 27.19 | |
| Daily S1 | 12,873.41 | 61.88 | |
| Low | 12,889.37 | 15.96 | |
| Close | 12,935.29 | 45.92 | |
| 61.8% Down from Intraday High | 12,942.74 | 7.45 | Yes! The 61.8% Down from Intraday High is close to the Close. |
| Daily Pivot | 12,951.25 | 8.51 | Yes! The Daily Pivot is close to the 61.8% Down from Intraday High. |
| 50% Down from Intraday High | 12,959.22 | 7.98 | Yes! The 50% Down from Intraday High is close to the Daily Pivot. |
| Open | 12,968.38 | 9.16 | Yes! The Open is close to the 50% Down from Intraday High. |
| 38.2% Down from Intraday High | 12,975.71 | 7.33 | Yes! The 38.2% Down from Intraday High is close to the Open. |
| Daily R1 | 13,013.12 | 37.41 | |
| High | 13,029.08 | 15.96 | |
| Daily R2 | 13,090.96 | 61.88 | |
| Weekly R1 | 13,152.85 | 61.89 | |
| Monthly R1 | 13,358.54 | 205.69 | |
| Weekly R2 | 13,370.41 | 11.87 | Yes! The Weekly R2 is close to the Monthly R1. |
| Monthly R2 | 13,781.80 | 411.39 |
![]()
Support this site! Clicking any of the books (below) takes you to
Amazon.com If you buy ANYTHING while there, they pay for the referral.
Legal notice for paid links: "As an Amazon Associate I earn from qualifying purchases."
|
My Stock Market Books
|
My Novels
Orb Foresight Rewrite Coming!
|