
As of 05/04/2026
Indus: 48,942 -557.37 -1.1%
Trans: 19,606 -992.51 -4.8%
Utils: 1,153 -4.13 -0.4%
Nasdaq: 25,068 -46.64 -0.2%
S&P 500: 7,201 -29.37 -0.4%
|
YTD
+1.8%
+13.0%
+7.9%
+7.9%
+5.2%
|
|
As of 05/04/2026
Indus: 48,942 -557.37 -1.1%
Trans: 19,606 -992.51 -4.8%
Utils: 1,153 -4.13 -0.4%
Nasdaq: 25,068 -46.64 -0.2%
S&P 500: 7,201 -29.37 -0.4%
|
YTD
+1.8%
+13.0%
+7.9%
+7.9%
+5.2%
| |
|
| ||
$ $ $
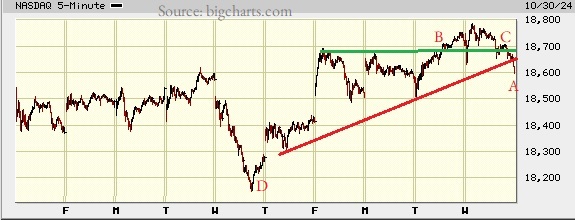
I show a picture of the Nasdaq composite on the 5-minute scale.
Victor Sperandeo said that the correct way to draw a trendline was to start from the lowest point on the chart (see point D). Since I know the rule, I'm allowed to break it to make the line fit better. I like my trendlines to touch as many points as possible. (Yes, it's a flimsy excuse).
That's why I drew the red trendline where I did. At A, the index has dropped below the trendline. I'll discuss more about that in a moment. Stay tuned.
I drew another trendline, green, to show how the index bumped up against overhead resistance at B. On the way down, it found support at (near) the same price, C. The pause in both cases wasn't long, but it was there.
Returning to A, the index has dropped through the red line. It could pull back to the line before dropping farther. To me, that seems likely because of the horizontal move (support) shown at the 18,600 level during most of Monday's trading.
However, the index will often gap open, and it goes wherever it wants to go, so who knows? If this were a daily chart, I'd say the index would go horizontal for a while and then down to 18,500, perhaps as far as 18,400.
$ $ $
Here's a symbol list of 144 chart and candlestick patterns (13 "investment grade" candle patterns) found in today's securities using my version of Patternz: ANF, ACN, AES, AFL, AKAM, ALL, AMZN, AEO, ATR, ARCB, AZTA, BALL, BSET, BAX, BECN, BKH, BOOT, BBW, CENX, CF, CHKP, CLNE, CNA, CNX, ED, CRH, CROX, CTS, DSGR, ^DJU, DTE, DUK, EBAY, EIX, EQT, EVH, FDS, FLEX, FMC, FTNT, FTV, FWRD, FNV, FCX, GPN, GOOGL, HBI, THG, HOV, HUN, HURC, IDA, TILE, JBLU, KBH, K, KMT, KSS, LRCX, LMT, MHO, MLKN, MCO, ^IXIC, NTGR, NEU, NEE, NKE, NI, JWN, NWPX, NTNX, OGE, OMC, OMI, OXM, PANW, POR, PPL, PINC, PEG, PHM, RGLD, RES, SAIA, SBH, SIGI, SRE, SLGN, SO, SPSC, TPR, TECH, TOL, VEEV, MDRX, V, VMC, WRB, WERN, WU, WWD, IDU, FXL, BOTZ, IYH, IAT, IEV, IGV, ILF, IYF, EWO, EWK, EEM, EIS, EWM, EPP, EWS, EWL, THD, TUR, EWU, PBE, XLP, XLV, XLU, VHT, VONG. Click this link for details (pattern type, start and end dates).
For a list of small patterns (those a few days wide) click this link.
$ $ $
The following table shows where Fibonacci retrace values of the day's high-low range are plus pivot points, calculated on the Nasdaq composite, sorted by value. When several are near each other (small differences), the area might act as support or resistance.
-- Thomas Bulkowski
![]()
| © 2024 ThePatternSite.com Metric | Value | Diff | Close (within 10% of the high-low range for the day)? |
| Monthly S2 | 17,433.02 | ||
| Weekly S2 | 17,938.12 | 505.09 | |
| Monthly S1 | 18,020.48 | 82.36 | |
| Weekly S1 | 18,273.02 | 252.55 | |
| Monthly Pivot | 18,355.24 | 82.22 | |
| Daily S2 | 18,476.64 | 121.39 | |
| Weekly Pivot | 18,481.52 | 4.88 | Yes! The Weekly Pivot is close to the Daily S2. |
| Daily S1 | 18,542.28 | 60.77 | |
| Low | 18,598.24 | 55.96 | |
| Close | 18,607.93 | 9.69 | Yes! The Close is close to the Low. |
| Daily Pivot | 18,663.89 | 55.96 | |
| 61.8% Down from Intraday High | 18,669.77 | 5.88 | Yes! The 61.8% Down from Intraday High is close to the Daily Pivot. |
| 50% Down from Intraday High | 18,691.87 | 22.10 | |
| 38.2% Down from Intraday High | 18,713.96 | 22.10 | |
| Daily R1 | 18,729.53 | 15.57 | Yes! The Daily R1 is close to the 38.2% Down from Intraday High. |
| Open | 18,731.69 | 2.16 | Yes! The Open is close to the Daily R1. |
| High | 18,785.49 | 53.80 | |
| Weekly R1 | 18,816.42 | 30.93 | |
| Daily R2 | 18,851.14 | 34.71 | |
| Monthly R1 | 18,942.70 | 91.56 | |
| Weekly R2 | 19,024.92 | 82.22 | |
| Monthly R2 | 19,277.46 | 252.55 |
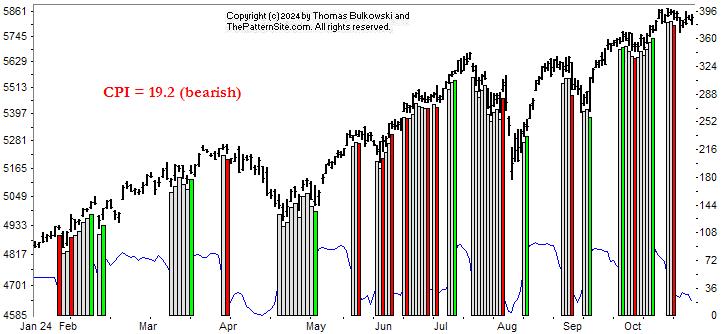
This is a picture of the chart pattern indicator on the daily scale. The indicator is the line chart below a chart of the S&P 500 composite.
I only show one chart today because you can see the indicator. It's the thin blue line near the bottom of the chart.
The CPI is bearish and it has been bearish for about a week now. That means it won't change (signals can change for up to a calendar week). The signal changed from neutral to bearish at about the time the index peaked.
Because the indicator is near the bottom of the scale, it can't go much lower (0 is the lowest). Usually the CPI reaches a low and bounces upward. You can see the dip in April and between the bars in August.
So we might see some weakness in the next few days but perhaps a recovery next week. That's my guess.
$ $ $
Here's a symbol list of 161 chart and candlestick patterns (13 "investment grade" candle patterns) found in today's securities using my version of Patternz: ANF, ALRM, AA, AMED, AMWD, APA, ACGL, AVNT, BALL, BZH, BERY, BBY, BKNG, BOOT, CDNS, CE, CX, CNC, CNP, CENX, CF, CINF, CLNE, CNA, CNX, CMCO, CSGP, COST, CRH, CROX, CTS, CW, DUK, EXP, EMN, EBAY, EIX, ELV, EPAM, EVH, FFIV, FTNT, FTV, FWRD, GE, GPN, GPRO, GFF, HBI, HLIT, HQY, HTLD, HL, HNI, HD, DHI, HWM, HUN, HURC, IDA, INFN, ITGR, TILE, ISRG, KBH, K, LZB, LRCX, LDOS, LEN, LMT, LOW, MHO, MTRX, MLKN, MCO, MUR, ^IXIC, NEE, NKE, JWN, NWPX, NUS, OMI, OXM, PANW, PEN, PETS, PFE, PINC, PFG, PEG, PHM, QTWO, KWR, RGS, RNG, ROST, SIGI, SMTC, SLGN, SKYW, SO, SCCO, SR, SCS, SNPS, TOL, RIG, VEEV, VRSN, VRTX, V, WRB, WU, WPM, WSM, ITA, IYK, IYE, FDN, FXL, BOTZ, QQQ, IYZ, IGV, IXC, ILF, SLV, ITB, ECH, EWJ, EPP, EWS, EWP, EWL, TUR, PHO, XLP, GLD, XHB, UNG, USO, MGK, VONG. Click this link for details (pattern type, start and end dates).
For a list of small patterns (those a few days wide) click this link.
-- Thomas Bulkowski
![]()
$ $ $
I show another slider trading quiz featuring Wolverine World Wide: WWW stock.
$ $ $
Here's a symbol list of 156 chart and candlestick patterns (13 "investment grade" candle patterns) found in today's securities using my version of Patternz: DDD, ABM, AYI, ADBE, AKAM, ALK, ALKS, AME, AMN, APH, ANIK, APA, AMAT, ADM, ASH, BALL, BZH, BBY, BFH, BRKR, BLDR, CDNS, CX, CNP, CF, CRL, CMCO, CMTL, COP, CXW, GLW, CSGP, COST, CR, CRH, DVN, FANG, DFS, DOV, EMN, EBAY, ECL, ELV, EPAM, XOM, FDS, FORM, FNV, FDP, GPRO, HLIT, HIG, HE, HQY, HSII, HP, HSIC, HD, IEX, ITW, IBKR, IPI, KALU, K, KMT, MHO, MGY, MCHX, MSFT, MOS, MUR, NFLX, NEU, NWPX, NVDA, OXY, PANW, PYPL, PFE, QCOM, REGN, RGA, ROL, RGLD, RES, SBH, SHOP, STR, SCCO, SWX, SNPS, TRGP, TDY, RIG, TZOO, UIS, VLO, VRTX, WMB, WOLF, IYM, IYC, IYE, IHE, DDM, FTEC, FXI, BOTZ, IEV, IXC, MXI, IGE, IEO, ECH, EEM, EWQ, EWG, EIS, EWI, EWM, EWS, EWY, EWP, THD, QLD, PBE, PEJ, PXJ, PJP, PHO, SSO, XLE, SPY, XLK, USO, VIS, VONG. Click this link for details (pattern type, start and end dates).
For a list of small patterns (those a few days wide) click this link.
$ $ $
The following table shows where Fibonacci retrace values of the day's high-low range are plus pivot points, calculated on the Dow industrials, sorted by value. When several are near each other (small differences), the area might act as support or resistance.
-- Thomas Bulkowski
![]()
| © 2024 ThePatternSite.com Metric | Value | Diff | Close (within 10% of the high-low range for the day)? |
| Monthly S2 | 41,021.45 | ||
| Weekly S2 | 41,323.80 | 302.35 | |
| Monthly S1 | 41,704.51 | 380.71 | |
| Weekly S1 | 41,855.68 | 151.17 | |
| Daily S2 | 42,164.27 | 308.59 | |
| Low | 42,264.54 | 100.27 | |
| Open | 42,264.54 | 0.00 | Yes! The Open is close to the Low. |
| Daily S1 | 42,275.92 | 11.38 | Yes! The Daily S1 is close to the Open. |
| 61.8% Down from Intraday High | 42,345.49 | 69.57 | |
| 50% Down from Intraday High | 42,370.50 | 25.01 | |
| Daily Pivot | 42,376.19 | 5.69 | Yes! The Daily Pivot is close to the 50% Down from Intraday High. |
| Close | 42,387.57 | 11.38 | Yes! The Close is close to the Daily Pivot. |
| 38.2% Down from Intraday High | 42,395.51 | 7.94 | Yes! The 38.2% Down from Intraday High is close to the Close. |
| High | 42,476.46 | 80.95 | |
| Daily R1 | 42,487.84 | 11.38 | Yes! The Daily R1 is close to the High. |
| Monthly Pivot | 42,514.80 | 26.96 | |
| Weekly Pivot | 42,583.28 | 68.48 | |
| Daily R2 | 42,588.11 | 4.83 | Yes! The Daily R2 is close to the Weekly Pivot. |
| Weekly R1 | 43,115.16 | 527.05 | |
| Monthly R1 | 43,197.86 | 82.70 | |
| Weekly R2 | 43,842.76 | 644.90 | |
| Monthly R2 | 44,008.15 | 165.39 |
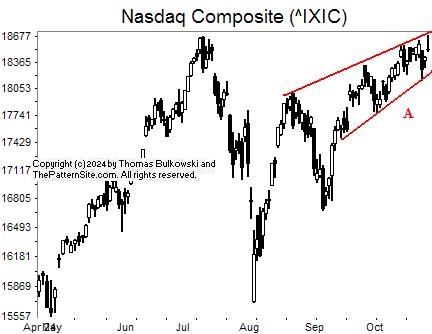
I show the Nasdaq composite on the daily scale.
Outlined in red is a chart pattern called a rising wedge. That's when the price movement follows two up-sloping and converging trendlines.
The breakout from rising wedges is downward 60% of the time (in stocks) according to my book, Encyclopedia of Chart Patterns, 3rd Edition #AD.
Given that the index is approaching overhead resistance setup by the July peak, I'd look for the index to drop soon.
![]()
The following is a brief review of how the markets performed over time. The numbers refer to the close-to-close move in the Dow industrials.
No options expire this week.
![]()
The following is based on an SFO article in December 2004 by John Seekinger, titled, "Take a two-dimensional approach." He offers these tips.
| Index | S2 | S1 | Pivot | R1 | R2 |
| Dow Industrials (^DJI): Daily | 41,710 | 41,912 | 42,253 | 42,456 | 42,797 |
| Weekly | 41,233 | 41,674 | 42,492 | 42,933 | 43,752 |
| Monthly | 40,930 | 41,522 | 42,424 | 43,016 | 43,917 |
| S&P500 (^GSPC): Daily | 5,761 | 5,784 | 5,824 | 5,847 | 5,886 |
| Weekly | 5,708 | 5,758 | 5,812 | 5,863 | 5,917 |
| Monthly | 5,582 | 5,695 | 5,787 | 5,900 | 5,991 |
| Nasdaq (^IXIC): Daily | 18,362 | 18,440 | 18,565 | 18,643 | 18,768 |
| Weekly | 17,908 | 18,213 | 18,452 | 18,757 | 18,995 |
| Monthly | 17,403 | 17,961 | 18,325 | 18,883 | 19,248 |
Here are the formulas:
![]()
Earnings season is either underway or should be starting soon. The sessions could be more volatile.
Here's a symbol list of 184 chart and candlestick patterns (13 "investment grade" candle patterns) found in today's securities using my version of Patternz: AXDX, ACIW, AEIS, AKAM, ALK, ALKS, ALGT, AMZN, DOX, AMWD, APH, AON, ARW, AGO, ATO, ADP, BCPC, BAX, BZH, BERY, BBY, BMRN, BAH, BR, CBT, CNC, CDAY, CSCO, CLF, CL, CMCO, ED, COST, CROX, CCRN, CSGS, CMI, DECK, XRAY, DFS, DOV, DUK, EMN, EBAY, EIX, EL, EVRG, FIS, FISV, FIVN, FTV, FCX, FDP, GIS, GL, GS, GOOGL, GPRO, GFF, GES, THG, HIG, HSII, HSY, HNI, HD, HON, DHI, JBHT, HUN, IDA, NSP, IBKR, TILE, JKHY, KBH, KELYA, LZB, LAMR, LEN, MHO, MCHX, MKTX, MAS, MGEE, MSFT, MCO, MS, MOS, ^IXIC, NFG, NJR, NWL, NKE, ORI, OLN, ASGN, ON, OUT, OXM, PKG, PANW, PATK, PDCO, PTEN, PYPL, PCG, PNW, PPG, PFG, PHM, RMBS, RRC, RLI, RHI, ROL, SCHW, SMG, SEE, SHW, SLGN, STR, SWX, SPSC, SNPS, TRGP, TDOC, TDY, TEVA, TSCO, TWLO, UHAL, VLO, VMI, MDRX, V, WMT, WU, WEX, WPM, WMB, WSC, XEL, IAI, IYC, IDU, FTEC, FDN, QQQ, ILF, IYF, ITB, EWS, EWT, XLF, GLD, XHB, USO, MGK, VONG. Click this link for details (pattern type, start and end dates).
For a list of small patterns (those a few days wide) click this link.
The below industries were the best (rank 1) or worst performing of those I follow.
|
-- Thomas Bulkowski
![]()
Here's a symbol list of 142 chart and candlestick patterns (13 "investment grade" candle patterns) found in today's securities using my version of Patternz: ANF, ABM, ALK, ALL, DOX, AMED, AEE, AEO, AEP, ARCB, ADP, AVNT, BCPC, BMRN, BKH, BOOT, BSX, CE, CLS, CNC, CF, CINF, CTAS, CSCO, CNO, CTSH, CAG, COST, CRH, ^DJU, DOV, DTE, DUK, EIX, EVRG, FISV, FTV, FCX, FRD, GL, GOOGL, GPRO, GFF, HTLD, HL, HSIC, HON, HOV, HUM, HUN, HURC, IDA, IDXX, ILMN, NSP, IBP, IPI, KALU, L, MRO, MCHX, MRTN, MCO, MOS, MUR, NBR, NOV, NJR, NWL, NKE, NTNX, OGE, ORI, OMCL, OMC, ASGN, PANW, PTEN, PYPL, PCG, PNW, PLXS, POR, RRC, RJF, ROG, ROL, ROST, RES, R, CRM, SBH, SEIC, SCI, SKYW, SNPS, TRGP, TFX, TER, TEVA, TXT, TSCO, TDG, UHAL, WU, WEX, WPM, WSC, IYK, IEZ, IDU, FXL, BOTZ, IGV, MXI, ILF, EWO, ECH, EIS, EWM, EWT, THD, PBE, PXJ, PHO, XLY, USO, VAW. Click this link for details (pattern type, start and end dates).
For a list of small patterns (those a few days wide) click this link.
$ $ $
You can find setups based on a Fibonacci retrace by clicking on the link.
The following patterns were found manually, not using Patternz. Mr. Bulkowski has excluded any securities he owns from appearing in the list. However, he may add any of the securities listed to his portfolio at any time, just as you can.
In the table below, the red and green colors are based on the historical breakout direction for the associated chart pattern. If a high and tight flag appears, the start and end dates highlight the flagpole only and not the flag.
For details about the chart patterns, click here.
-- Thomas Bulkowski, author: Invest for Two-Comma Wealth and the novel (fiction), Foresight (#Ad)
![]()
| Symbol | Chart Pattern | Bullish Bearish | Start | End | Industry |
| MMM | Double Top, Adam and Adam | 09/26/2024 | 10/22/2024 | Diversified Co. | |
| AYI | Double Top, Eve and Eve | 10/07/2024 | 10/15/2024 | Furn/Home Furnishings | |
| AFG | Triple top | 10/04/2024 | 10/18/2024 | Insurance (Prop/Casualty) | |
| AVNT | Double Top, Adam and Eve | 09/27/2024 | 10/17/2024 | Chemical (Specialty) | |
| BBY | Double Top, Adam and Adam | 08/29/2024 | 09/30/2024 | Retail (Special Lines) | |
| BIO | Broadening top | 10/02/2024 | 10/24/2024 | Medical Supplies | |
| BRC | Triangle, ascending | 09/06/2024 | 10/18/2024 | Chemical (Diversified) | |
| BLDR | Triple top | 09/19/2024 | 10/16/2024 | Retail Building Supply | |
| CDNS | Triple top | 09/19/2024 | 10/14/2024 | Computer Software and Svcs | |
| CAL | Double Top, Eve and Eve | 09/27/2024 | 10/16/2024 | Shoe | |
| CMCO | Double Top, Eve and Adam | 09/30/2024 | 10/16/2024 | Machinery | |
| CSGP | Double Top, Eve and Adam | 09/16/2024 | 10/18/2024 | Information Services | |
| COST | Multi-peaks | 08/15/2024 | 10/24/2024 | Retail Store | |
| CR | Triangle, ascending | 09/19/2024 | 10/07/2024 | Diversified Co. | |
| DHR | Triple top | 08/01/2024 | 10/17/2024 | Medical Services | |
| BOOM | Dead-cat bounce | 10/22/2024 | 10/22/2024 | Metal Fabricating | |
| EMR | Double Top, Adam and Eve | 10/07/2024 | 10/14/2024 | Computers and Peripherals | |
| FFIV | Double Top, Adam and Adam | 09/24/2024 | 10/11/2024 | Internet | |
| FTV | Double Top, Adam and Adam | 09/27/2024 | 10/15/2024 | Industrial Services | |
| FNV | Double Bottom, Eve and Adam | 09/06/2024 | 10/08/2024 | Metals and Mining (Div.) | |
| GME | Triangle, symmetrical | 09/09/2024 | 10/24/2024 | Retail (Special Lines) | |
| GPN | Triple bottom | 09/25/2024 | 10/07/2024 | Computer Software and Svcs | |
| GFS | Broadening bottom | 09/18/2024 | 10/23/2024 | Semiconductor | |
| GGG | Double Top, Adam and Adam | 09/27/2024 | 10/15/2024 | Machinery | |
| GFF | Double Top, Eve and Eve | 09/20/2024 | 10/16/2024 | Building Materials | |
| HOLX | Triple bottom | 09/25/2024 | 10/09/2024 | Medical Supplies | |
| DHI | Head-and-shoulders top | 08/26/2024 | 10/18/2024 | Homebuilding | |
| IEX | Double Top, Adam and Adam | 09/27/2024 | 10/15/2024 | Machinery | |
| IBP | Double Top, Adam and Eve | 09/27/2024 | 10/16/2024 | Retail Building Supply | |
| KALU | Double Top, Adam and Eve | 09/27/2024 | 10/18/2024 | Metals and Mining (Div.) | |
| LH | Double Bottom, Adam and Eve | 10/08/2024 | 10/22/2024 | Medical Services | |
| LANC | Double Top, Eve and Eve | 09/18/2024 | 10/15/2024 | Food Processing | |
| NEU | Double Bottom, Eve and Eve | 10/08/2024 | 10/22/2024 | Chemical (Specialty) | |
| NOVT | Triangle, symmetrical | 08/26/2024 | 10/23/2024 | Precision Instrument | |
| NTNX | Double Bottom, Adam and Adam | 09/18/2024 | 10/01/2024 | E-Commerce | |
| OMC | Double Bottom, Adam and Eve | 09/25/2024 | 10/07/2024 | Advertising | |
| ON | Head-and-shoulders top | 09/19/2024 | 10/15/2024 | Semiconductor | |
| PATK | Triple top | 09/20/2024 | 10/16/2024 | Retail Building Supply | |
| PPG | Pipe top | 09/23/2024 | 09/30/2024 | Chemical (Diversified) | |
| DGX | Triple bottom | 10/07/2024 | 10/21/2024 | Medical Services | |
| RL | Double Top, Adam and Adam | 10/14/2024 | 10/18/2024 | Apparel | |
| RJF | Flag | 10/18/2024 | 10/23/2024 | Securities Brokerage | |
| ROG | Head-and-shoulders top | 09/18/2024 | 10/18/2024 | Electronics | |
| ROL | Head-and-shoulders complex top | 09/03/2024 | 10/01/2024 | Industrial Services | |
| ROP | Broadening top | 08/29/2024 | 10/23/2024 | Industrial Services | |
| SAIA | Triple top | 09/19/2024 | 10/16/2024 | Trucking/Transp. Leasing | |
| SCCO | Triangle, symmetrical | 09/26/2024 | 10/24/2024 | Metals and Mining (Div.) | |
| TER | Head-and-shoulders top | 09/19/2024 | 10/15/2024 | Semiconductor Cap Equip. | |
| TZOO | Pipe bottom | 09/30/2024 | 10/07/2024 | Internet | |
| VFC | Pipe top | 09/30/2024 | 10/07/2024 | Apparel | |
| WAT | Triple top | 09/27/2024 | 10/15/2024 | Precision Instrument | |
| WSO | Double Top, Adam and Eve | 09/26/2024 | 10/18/2024 | Retail Building Supply | |
| WEX | Dead-cat bounce | 10/24/2024 | 10/24/2024 | Information Services |
![]()
$ $ $
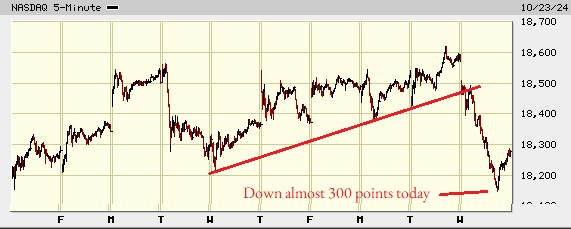
I show a picture of the Nasdaq composite on the 5-minute scale.
As the chart shows, the Nasdaq punched through the up-sloping trendline formed over the past week, and sank almost 300 points.
A check of the headlines says it was because of earnings reports and worries about rising treasury yields.
If we consider today's sharp decline as a dead-cat bounce, we should see the index bounce (which it has already started) followed by another decline that ends just below today's (Wednesday) low (below 18,146).
According to the tally's listed at the top of this post, tomorrow should end higher 51% of the time. That means it's about random. Take your pick.
$ $ $
Here's a symbol list of 147 chart and candlestick patterns (13 "investment grade" candle patterns) found in today's securities using my version of Patternz: DDD, A, AEE, AEO, AMWD, APH, ANIK, ARCB, AVY, AVNT, BZH, BRKR, BLDR, BG, CBT, CAL, CLS, CNC, CDAY, CNA, ED, CSGP, COST, CR, DHR, DTE, EXP, EMN, EIX, EVH, EXC, FFIV, FTV, FDP, IT, GIS, GMS, GPRO, GGG, GFF, GES, THG, HSY, HNI, HUM, HUN, IDA, IBP, IPAR, TILE, JKHY, KBH, KSS, KLIC, LEN, RAMP, LMT, M, MANH, MCHX, MAS, MCO, MUR, NOV, NKE, OMCL, OMI, PKG, PANW, PATK, PYPL, PPG, PEG, PSTG, RL, RJF, RNG, ROP, SPSC, SNPS, TPR, TDOC, TDY, TPX, TEVA, TMO, TOL, TZOO, UHAL, UNH, VMI, VECO, VC, WMT, WSO, WU, WEX, WSC, WDAY, IAI, IYK, BOTZ, ICF, IHF, IEV, MXI, EWA, EWO, EWK, EWG, EWJ, EWM, EPP, EWD, EWL, THD, EWU, DBA, PBE, PXJ, ROBO, XHB, XRT, VIS. Click this link for details (pattern type, start and end dates).
For a list of small patterns (those a few days wide) click this link.
$ $ $
The following table shows where Fibonacci retrace values of the day's high-low range are plus pivot points, calculated on the Nasdaq composite, sorted by value. When several are near each other (small differences), the area might act as support or resistance.
-- Thomas Bulkowski
![]()
| © 2024 ThePatternSite.com Metric | Value | Diff | Close (within 10% of the high-low range for the day)? |
| Monthly S2 | 17,023.60 | ||
| Monthly S1 | 17,650.12 | 626.53 | |
| Daily S2 | 17,948.24 | 298.11 | |
| Weekly S2 | 18,002.66 | 54.43 | |
| Monthly Pivot | 18,107.19 | 104.52 | |
| Daily S1 | 18,112.44 | 5.26 | Yes! The Daily S1 is close to the Monthly Pivot. |
| Weekly S1 | 18,139.66 | 27.21 | Yes! The Weekly S1 is close to the Daily S1. |
| Low | 18,146.61 | 6.95 | Yes! The Low is close to the Weekly S1. |
| Close | 18,276.65 | 130.04 | |
| 61.8% Down from Intraday High | 18,285.12 | 8.46 | Yes! The 61.8% Down from Intraday High is close to the Close. |
| Daily Pivot | 18,310.82 | 25.70 | Yes! The Daily Pivot is close to the 61.8% Down from Intraday High. |
| 50% Down from Intraday High | 18,327.90 | 17.08 | Yes! The 50% Down from Intraday High is close to the Daily Pivot. |
| Weekly Pivot | 18,351.95 | 24.05 | Yes! The Weekly Pivot is close to the 50% Down from Intraday High. |
| 38.2% Down from Intraday High | 18,370.68 | 18.73 | Yes! The 38.2% Down from Intraday High is close to the Weekly Pivot. |
| Daily R1 | 18,475.02 | 104.34 | |
| Weekly R1 | 18,488.95 | 13.92 | Yes! The Weekly R1 is close to the Daily R1. |
| Open | 18,502.06 | 13.11 | Yes! The Open is close to the Weekly R1. |
| High | 18,509.19 | 7.13 | Yes! The High is close to the Open. |
| Daily R2 | 18,673.40 | 164.21 | |
| Weekly R2 | 18,701.24 | 27.85 | Yes! The Weekly R2 is close to the Daily R2. |
| Monthly R1 | 18,733.71 | 32.47 | Yes! The Monthly R1 is close to the Weekly R2. |
| Monthly R2 | 19,190.78 | 457.06 |
This is a picture of the chart pattern indicator on the daily scale. The indicator is the line chart below a chart of the S&P 500 composite.
The indicator turned red (bearish) but signals can change for up to a week, so don't be alarmed. A strong recovery in the index could flip the CPI to bullish.
Given that we're breaking out to new highs, there should be some hesitation, though, in buying new positions or adding to existing ones.
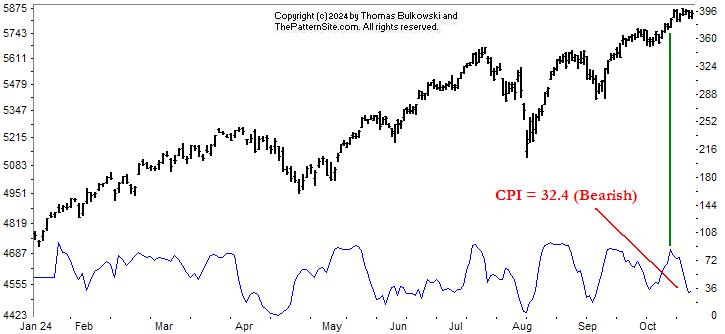
Here's the CPI without the signal changes showing.
I drew a green line from the CPI peak to where it lands on the index. The CPI has been signaling weakness for more than a week now.
Again, this is a time for caution.
$ $ $
Here's a symbol list of 158 chart and candlestick patterns (13 "investment grade" candle patterns) found in today's securities using my version of Patternz: ANF, A, ALRM, AEO, AMWD, APOG, AWI, ARW, AVY, AVNT, AXS, BZH, BRKR, BBW, BLDR, CBT, CDNS, CLS, CI, CINF, CLF, CLX, CAG, CR, CCRN, DHR, ^DJU, DUK, BOOM, EMN, EBAY, ECL, EL, EVH, FDS, FDP, FRD, IT, GILD, GMS, GOOGL, GPRO, GGG, GES, THG, HLIT, HAYN, HNI, HOLX, HD, HON, HOV, HUN, HURC, IDA, PODD, TILE, IPG, K, KMB, KSS, KLIC, LRCX, LEG, M, MCHX, MKTX, MAS, MTRN, MRCY, MCO, MOS, ^IXIC, NTAP, NWL, NOC, OMI, PANW, PATK, PCTY, PETS, PCG, PNW, PPG, KWR, DGX, RL, ROL, SAND, SLB, SAIC, NOW, STR, SXI, SNPS, TPR, TDY, TPX, TDC, TXN, TMO, RIG, TZOO, TG, TREX, UHAL, VC, WRB, WMT, WERN, WU, WSC, ITA, IYZ, IEV, MXI, SLV, EWO, EWK, EWG, EWJ, EPP, EWY, EWD, EWL, THD, PPA, DBA, PBE, PJP, ROBO, XRT, XAR, MGK, VONG. Click this link for details (pattern type, start and end dates).
For a list of small patterns (those a few days wide) click this link.
-- Thomas Bulkowski
![]()
$ $ $
I show another slider trading quiz featuring WPS Resources: WPS (actual trade).
$ $ $
Here's a symbol list of 165 chart and candlestick patterns (13 "investment grade" candle patterns) found in today's securities using my version of Patternz: ANF, ACIW, AES, ATSG, ALKS, AEE, AEO, AXP, AFG, AMWD, APH, ANIK, AAPL, AWI, ARW, AVA, AXS, BCPC, BIIB, BA, BKNG, BSX, BRC, BBW, BG, CDNS, CAL, CENX, CF, CI, CINF, CLF, CNA, CNO, CMCO, ED, CAG, CXW, CRH, CCRN, DVN, FANG, DDS, ^DJU, DOV, DTE, DUK, BOOM, ECL, EIX, EME, EVH, FTNT, FNV, FDP, FRD, GIS, GPRO, GES, THG, HL, HSII, HSIC, HOV, HUM, JBHT, HURC, IDA, NSP, IPAR, TILE, KALU, K, KELYA, KMB, KSS, LZB, LRCX, LLY, LXU, MTSI, MGY, MAS, MOS, NFLX, NTGR, NWL, NVDA, OMCL, ASGN, OR, PANW, PATK, PTEN, PETS, PCG, PLXS, PPL, PINC, QTWO, KWR, RL, RGS, ROP, SAIA, SAND, SAIC, SRE, SMTC, STR, SCS, SUM, TRGP, TGT, TPX, TDC, TXN, TZOO, TG, UHAL, VFC, VLO, VC, WRB, WSO, WU, WPM, WSM, IYK, IHE, FTEC, FXI, IAT, MXI, EWO, EWK, ECH, EWH, EWJ, EWY, EWD, TUR, PBE, PJP, XLK, VAW, MGK. Click this link for details (pattern type, start and end dates).
For a list of small patterns (those a few days wide) click this link.
$ $ $
The following table shows where Fibonacci retrace values of the day's high-low range are plus pivot points, calculated on the Dow industrials, sorted by value. When several are near each other (small differences), the area might act as support or resistance.
-- Thomas Bulkowski
![]()
| © 2024 ThePatternSite.com Metric | Value | Diff | Close (within 10% of the high-low range for the day)? |
| Monthly S2 | 40,674.04 | ||
| Monthly S1 | 41,802.82 | 1,128.78 | |
| Weekly S2 | 42,350.30 | 547.48 | |
| Monthly Pivot | 42,563.95 | 213.65 | |
| Daily S2 | 42,606.71 | 42.76 | Yes! The Daily S2 is close to the Monthly Pivot. |
| Weekly S1 | 42,640.95 | 34.23 | Yes! The Weekly S1 is close to the Daily S2. |
| Daily S1 | 42,769.16 | 128.21 | |
| Low | 42,877.57 | 108.41 | |
| Close | 42,931.60 | 54.03 | |
| Weekly Pivot | 42,983.02 | 51.42 | |
| Daily Pivot | 43,040.01 | 56.99 | |
| 61.8% Down from Intraday High | 43,043.09 | 3.08 | Yes! The 61.8% Down from Intraday High is close to the Daily Pivot. |
| 50% Down from Intraday High | 43,094.22 | 51.13 | |
| 38.2% Down from Intraday High | 43,145.35 | 51.13 | |
| Daily R1 | 43,202.46 | 57.11 | |
| Open | 43,222.21 | 19.75 | Yes! The Open is close to the Daily R1. |
| Weekly R1 | 43,273.67 | 51.46 | |
| High | 43,310.87 | 37.20 | Yes! The High is close to the Weekly R1. |
| Daily R2 | 43,473.31 | 162.44 | |
| Weekly R2 | 43,615.74 | 142.43 | |
| Monthly R1 | 43,692.74 | 77.00 | |
| Monthly R2 | 44,453.88 | 761.14 |
$ $ $
I show another slider trading quiz featuring WPS Resources: WPS (actual trade).
$ $ $
Here's a symbol list of 165 chart and candlestick patterns (13 "investment grade" candle patterns) found in today's securities using my version of Patternz: ANF, ACIW, AES, ATSG, ALKS, AEE, AEO, AXP, AFG, AMWD, APH, ANIK, AAPL, AWI, ARW, AVA, AXS, BCPC, BIIB, BA, BKNG, BSX, BRC, BBW, BG, CDNS, CAL, CENX, CF, CI, CINF, CLF, CNA, CNO, CMCO, ED, CAG, CXW, CRH, CCRN, DVN, FANG, DDS, ^DJU, DOV, DTE, DUK, BOOM, ECL, EIX, EME, EVH, FTNT, FNV, FDP, FRD, GIS, GPRO, GES, THG, HL, HSII, HSIC, HOV, HUM, JBHT, HURC, IDA, NSP, IPAR, TILE, KALU, K, KELYA, KMB, KSS, LZB, LRCX, LLY, LXU, MTSI, MGY, MAS, MOS, NFLX, NTGR, NWL, NVDA, OMCL, ASGN, OR, PANW, PATK, PTEN, PETS, PCG, PLXS, PPL, PINC, QTWO, KWR, RL, RGS, ROP, SAIA, SAND, SAIC, SRE, SMTC, STR, SCS, SUM, TRGP, TGT, TPX, TDC, TXN, TZOO, TG, UHAL, VFC, VLO, VC, WRB, WSO, WU, WPM, WSM, IYK, IHE, FTEC, FXI, IAT, MXI, EWO, EWK, ECH, EWH, EWJ, EWY, EWD, TUR, PBE, PJP, XLK, VAW, MGK. Click this link for details (pattern type, start and end dates).
For a list of small patterns (those a few days wide) click this link.
$ $ $
The following table shows where Fibonacci retrace values of the day's high-low range are plus pivot points, calculated on the Dow industrials, sorted by value. When several are near each other (small differences), the area might act as support or resistance.
-- Thomas Bulkowski
![]()
| © 2024 ThePatternSite.com Metric | Value | Diff | Close (within 10% of the high-low range for the day)? |
| Monthly S2 | 40,674.04 | ||
| Monthly S1 | 41,802.82 | 1,128.78 | |
| Weekly S2 | 42,350.30 | 547.48 | |
| Monthly Pivot | 42,563.95 | 213.65 | |
| Daily S2 | 42,606.71 | 42.76 | Yes! The Daily S2 is close to the Monthly Pivot. |
| Weekly S1 | 42,640.95 | 34.23 | Yes! The Weekly S1 is close to the Daily S2. |
| Daily S1 | 42,769.16 | 128.21 | |
| Low | 42,877.57 | 108.41 | |
| Close | 42,931.60 | 54.03 | |
| Weekly Pivot | 42,983.02 | 51.42 | |
| Daily Pivot | 43,040.01 | 56.99 | |
| 61.8% Down from Intraday High | 43,043.09 | 3.08 | Yes! The 61.8% Down from Intraday High is close to the Daily Pivot. |
| 50% Down from Intraday High | 43,094.22 | 51.13 | |
| 38.2% Down from Intraday High | 43,145.35 | 51.13 | |
| Daily R1 | 43,202.46 | 57.11 | |
| Open | 43,222.21 | 19.75 | Yes! The Open is close to the Daily R1. |
| Weekly R1 | 43,273.67 | 51.46 | |
| High | 43,310.87 | 37.20 | Yes! The High is close to the Weekly R1. |
| Daily R2 | 43,473.31 | 162.44 | |
| Weekly R2 | 43,615.74 | 142.43 | |
| Monthly R1 | 43,692.74 | 77.00 | |
| Monthly R2 | 44,453.88 | 761.14 |
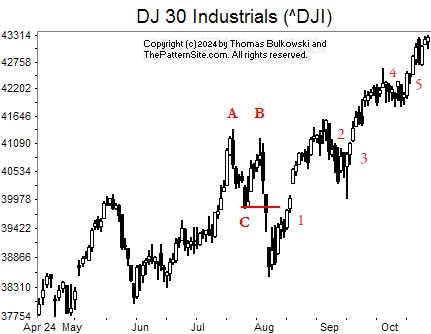
This is a picture of the Dow industrials on the daily scale. There's not much I can say about this.
A double top appears at AB, confirmed when the index closes below the low at C.
If you're an Elliott wave counter (and I'm not), but it looks like this is wave 5 (numbered on the chart). After that should come an ABC correction unless we get an extension.
Other than that, there's not much to say except the altitude is getting thin up here. Bring bottled oxygen.
![]()
The following is a brief review of how the markets performed over time. The numbers refer to the close-to-close move in the Dow industrials.
No options expire this week.
![]()
The following is based on an SFO article in December 2004 by John Seekinger, titled, "Take a two-dimensional approach." He offers these tips.
| Index | S2 | S1 | Pivot | R1 | R2 |
| Dow Industrials (^DJI): Daily | 42,924 | 43,100 | 43,212 | 43,389 | 43,501 |
| Weekly | 42,465 | 42,870 | 43,098 | 43,503 | 43,731 |
| Monthly | 40,789 | 42,032 | 42,679 | 43,922 | 44,569 |
| S&P500 (^GSPC): Daily | 5,835 | 5,850 | 5,861 | 5,876 | 5,887 |
| Weekly | 5,775 | 5,820 | 5,849 | 5,894 | 5,923 |
| Monthly | 5,509 | 5,687 | 5,783 | 5,961 | 6,056 |
| Nasdaq (^IXIC): Daily | 18,417 | 18,453 | 18,489 | 18,525 | 18,561 |
| Weekly | 18,074 | 18,282 | 18,423 | 18,631 | 18,772 |
| Monthly | 17,095 | 17,792 | 18,178 | 18,876 | 19,262 |
Here are the formulas:
![]()
Earnings season is either underway or should be starting soon. The sessions could be more volatile.
Here's a symbol list of 169 chart and candlestick patterns (13 "investment grade" candle patterns) found in today's securities using my version of Patternz: ANF, ACIW, ATSG, ALK, ALKS, AMZN, DOX, AEE, AEO, APH, AR, AAPL, ARCB, ARW, BCPC, BALL, BBY, BA, BKNG, BOOT, BSX, BRC, BFH, BCO, BG, CAL, CF, CI, CLF, CNA, CNO, CL, CMCO, ED, CXW, CRH, CROX, CCK, CTS, DDS, DOV, BOOM, EMN, EBAY, EQT, EVH, EXPI, FICO, FIVN, FNV, GIS, GNW, GPRO, GES, HBI, HLIT, HSII, HSIC, HNI, HWM, HUM, JBHT, HUN, IDA, NSP, IIIN, IPG, ISRG, KELYA, KSS, KLIC, LXU, MGY, MAN, MCHX, MLI, NOV, NFLX, NTGR, NWL, NEU, NI, OGE, OLN, OMCL, ASGN, PKG, PATK, PYPL, PLXS, PPL, PGR, RGS, RGA, RNG, ROK, ROG, ROP, RES, R, SBH, SLB, SMG, SMTC, SWX, SXI, SCS, SUM, TGT, TXN, TTD, TOL, TSCO, TZOO, TWLO, UHAL, UGI, VFC, VMI, VEEV, V, WMT, WSO, WPM, DDM, FXI, BOTZ, QQQ, ICF, IAT, SLV, ITB, IHI, EWH, EWI, EWM, EZA, EWY, EWP, QLD, PXJ, PJP, GLD, XLV, UNG. Click this link for details (pattern type, start and end dates).
For a list of small patterns (those a few days wide) click this link.
The below industries were the best (rank 1) or worst performing of those I follow.
|
-- Thomas Bulkowski
![]()
Here's a symbol list of 194 chart and candlestick patterns (13 "investment grade" candle patterns) found in today's securities using my version of Patternz: DDD, ANF, AXDX, AES, A, ALK, ALKS, DOX, AMED, AXP, AIG, AMWD, APH, ANET, AWI, AGO, ATO, AVY, BMI, BCPC, BBY, BMRN, BKNG, BSX, BFH, BCO, CBT, CALM, CNC, CENX, CF, CINF, CNA, CL, CMTL, ED, CRH, CROX, CTS, CMI, XRAY, DDS, DSGR, ^DJT, ^DJI, EBAY, EIX, ELV, EPAM, EVH, EXC, EXPI, FICO, FRD, GIS, GOOGL, HBI, THG, HLIT, HIG, HSY, HWM, JBHT, HURC, INCY, IIIN, IPG, JBLU, KMB, LH, LAMR, LANC, LXU, MTSI, M, MCHX, MDT, MGEE, MU, MUR, NOV, NTGR, NVDA, OGE, ORCL, PKG, PDCO, PTEN, PEN, PCG, PNW, PLXS, POR, PPL, PFG, PGR, PHM, PSTG, QCOM, RGS, RGA, RES, ^GSPC, SEE, SMTC, SCI, LUV, SWX, SXI, SUM, TPR, TRGP, TGT, TECH, TDOC, TXN, TSCO, TRV, TZOO, UHAL, VFC, VRSN, V, WRB, WSO, WSM, IYK, IYC, IDU, DDM, FTEC, FDN, FXL, FXI, BOTZ, IHF, IYZ, MXI, IXN, IYF, EWC, EWH, EWI, EWJ, EPP, EWS, EWY, EWD, EWT, THD, TUR, IBB, PPA, PBE, PXJ, SSO, XLP, XLF, XHB, SPY, XLK, UNG, MGK, VONG. Click this link for details (pattern type, start and end dates).
For a list of small patterns (those a few days wide) click this link.
$ $ $
You can find setups based on a Fibonacci retrace by clicking on the link.
The following patterns were found manually, not using Patternz. Mr. Bulkowski has excluded any securities he owns from appearing in the list. However, he may add any of the securities listed to his portfolio at any time, just as you can.
In the table below, the red and green colors are based on the historical breakout direction for the associated chart pattern. If a high and tight flag appears, the start and end dates highlight the flagpole only and not the flag.
For details about the chart patterns, click here.
-- Thomas Bulkowski, author: Invest for Two-Comma Wealth and the novel (fiction), Foresight (#Ad)
![]()
| Symbol | Chart Pattern | Bullish Bearish | Start | End | Industry |
| APH | Pipe bottom | 09/03/2024 | 09/09/2024 | Electronics | |
| ANIK | Triangle, descending | 08/30/2024 | 10/08/2024 | Biotechnology | |
| AAPL | Triangle, ascending | 08/05/2024 | 10/07/2024 | Computers and Peripherals | |
| AMAT | Double Top, Adam and Adam | 09/26/2024 | 10/15/2024 | Semiconductor Cap Equip. | |
| ADM | Double Top, Adam and Eve | 09/05/2024 | 09/19/2024 | Food Processing | |
| ASH | Triangle, descending | 08/29/2024 | 10/17/2024 | Chemical (Basic) | |
| BERY | Double Bottom, Adam and Adam | 10/03/2024 | 10/08/2024 | Packaging and Container | |
| BCO | Triple bottom | 10/02/2024 | 10/11/2024 | Industrial Services | |
| BG | Triangle, descending | 08/29/2024 | 10/17/2024 | Food Processing | |
| CAL | Pipe bottom | 09/30/2024 | 10/07/2024 | Shoe | |
| CF | Pipe top | 09/30/2024 | 10/07/2024 | Chemical (Basic) | |
| CMTL | Dead-cat bounce | 10/17/2024 | 10/17/2024 | Telecom. Equipment | |
| CXW | Triple bottom | 09/11/2024 | 10/03/2024 | Industrial Services | |
| CRH | Pipe bottom | 09/30/2024 | 10/07/2024 | Cement and Aggregates | |
| CCK | Double Top, Eve and Eve | 09/25/2024 | 10/01/2024 | Packaging and Container | |
| DVN | Double Top, Adam and Adam | 10/07/2024 | 10/11/2024 | Natural Gas (Diversified) | |
| ^DJU | Triple top | 09/16/2024 | 10/01/2024 | None | |
| EXPI | Double Top, Eve and Eve | 09/18/2024 | 09/30/2024 | E-Commerce | |
| FDS | Triple bottom | 10/01/2024 | 10/11/2024 | Information Services | |
| GAP | Head-and-shoulders bottom | 08/05/2024 | 10/09/2024 | Apparel | |
| GD | Double Bottom, Adam and Eve | 10/01/2024 | 10/11/2024 | Aerospace/Defense | |
| GES | Diamond bottom | 09/16/2024 | 10/14/2024 | Apparel | |
| HBI | Rising wedge | 09/30/2024 | 10/17/2024 | Apparel | |
| HSII | Pipe bottom | 09/03/2024 | 09/09/2024 | Human Resources | |
| HSY | Double Top, Eve and Adam | 08/02/2024 | 09/10/2024 | Food Processing | |
| HNI | Ugly double bottom | 09/11/2024 | 09/25/2024 | Furn/Home Furnishings | |
| JBHT | Pipe bottom | 09/30/2024 | 10/07/2024 | Trucking/Transp. Leasing | |
| IDA | Double Bottom, Adam and Eve | 10/04/2024 | 10/10/2024 | Electric Utility (West) | |
| IBP | Double Bottom, Adam and Adam | 10/04/2024 | 10/10/2024 | Retail Building Supply | |
| IPAR | Pipe top | 09/23/2024 | 09/30/2024 | Toiletries/Cosmetics | |
| IPG | Broadening top | 09/16/2024 | 10/07/2024 | Advertising | |
| IPI | Head-and-shoulders bottom | 09/23/2024 | 10/15/2024 | Chemical (Diversified) | |
| ISRG | Multi-peaks | 08/15/2024 | 10/17/2024 | Medical Supplies | |
| JAZZ | Double Bottom, Eve and Eve | 09/11/2024 | 10/10/2024 | Biotechnology | |
| JNJ | Double Bottom, Eve and Adam | 10/04/2024 | 10/15/2024 | Medical Supplies | |
| KMB | Double Bottom, Eve and Adam | 09/20/2024 | 10/04/2024 | Household Products | |
| KLAC | Double Top, Adam and Adam | 09/26/2024 | 10/14/2024 | Semiconductor Cap Equip. | |
| KLIC | Ugly double bottom | 09/06/2024 | 10/10/2024 | Semiconductor Cap Equip. | |
| LRCX | Double Top, Adam and Adam | 09/26/2024 | 10/15/2024 | Semiconductor Cap Equip. | |
| L | Double Bottom, Adam and Adam | 09/11/2024 | 10/07/2024 | Insurance (Prop/Casualty) | |
| M | Pipe bottom | 09/03/2024 | 09/09/2024 | Retail Store | |
| MAN | Double Top, Eve and Adam | 09/19/2024 | 10/16/2024 | Human Resources | |
| MCHX | Triangle, ascending | 09/23/2024 | 10/17/2024 | Advertising | |
| MLM | Ugly double bottom | 09/11/2024 | 10/07/2024 | Cement and Aggregates | |
| MTDR | Double Top, Adam and Adam | 10/07/2024 | 10/11/2024 | Petroleum (Producing) | |
| MLKN | Double Bottom, Adam and Adam | 09/20/2024 | 10/10/2024 | Furn/Home Furnishings | |
| MLI | Pipe bottom | 09/03/2024 | 09/09/2024 | Metal Fabricating | |
| NTGR | Pipe bottom | 09/30/2024 | 10/07/2024 | Telecom. Equipment | |
| NWPX | Roof | 09/17/2024 | 10/10/2024 | Building Materials | |
| OTEX | Rising wedge | 09/26/2024 | 10/17/2024 | E-Commerce | |
| PCTY | Broadening top, right-angled and ascending | 09/24/2024 | 10/16/2024 | E-Commerce | |
| PCG | Triple bottom | 09/10/2024 | 10/04/2024 | Electric Utility (West) | |
| RRC | Head-and-shoulders top | 09/23/2024 | 10/11/2024 | Petroleum (Producing) | |
| RTX | Broadening top | 10/02/2024 | 10/17/2024 | Aerospace/Defense | |
| RCKY | Triangle, descending | 09/11/2024 | 10/17/2024 | Shoe | |
| SCHW | Triple bottom | 07/17/2024 | 09/12/2024 | Securities Brokerage | |
| STR | Pipe bottom | 09/23/2024 | 09/30/2024 | Natural Gas (Diversified) | |
| SUM | Pipe bottom | 09/03/2024 | 09/09/2024 | Cement and Aggregates | |
| TGT | Pipe bottom | 09/30/2024 | 10/07/2024 | Retail Store | |
| TMO | Multi-peaks | 07/26/2024 | 10/17/2024 | Precision Instrument | |
| RIG | Double Top, Eve and Adam | 09/18/2024 | 10/07/2024 | Oilfield Svcs/Equipment | |
| UGI | Double Bottom, Eve and Eve | 09/12/2024 | 10/07/2024 | Natural Gas (Distributor) | |
| UNH | Triple top | 09/04/2024 | 10/14/2024 | Medical Services | |
| VECO | Double Top, Adam and Adam | 09/27/2024 | 10/14/2024 | Precision Instrument | |
| WPM | Double Top, Adam and Eve | 09/18/2024 | 09/26/2024 | Metals and Mining (Div.) | |
| WOLF | Flag, high and tight | 09/10/2024 | 10/17/2024 | Semiconductor |
![]()
$ $ $
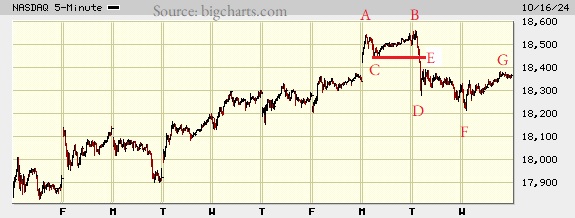
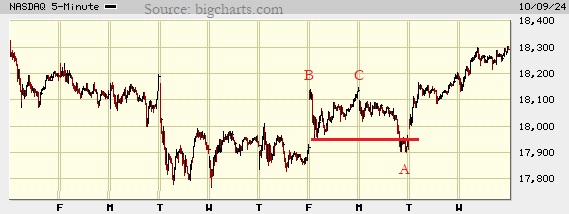
I show a picture of the Nasdaq composite on the 5-minute scale.
At AB, we see the index form a chart pattern called a double top. It confirms as a valid chart pattern when the index closes below line C.
The remainder of the letters describe the components of what is called a dead-cat bounce except it applies not to a stock, but to a market index. By that I mean I'm not looking for a 15% or larger drop in the event decline.
Let me explain. The event decline is the big drop from B to D. It's a swift drop that in stocks often shows a gap but price drops dramatically in one day or just a handful of days. Price bounces up to E before sinking lower to F. Notice that F is below the bottom of the event decline at D. Then we get a recovery, to G and beyond. This is textbook.
What does this mean going forward? My guess is a continued rise.
$ $ $
Here's a symbol list of 139 chart and candlestick patterns (13 "investment grade" candle patterns) found in today's securities using my version of Patternz: MMM, ANF, AMD, AFL, ATSG, ALKS, AEE, APH, AR, APA, AMAT, ATR, AWI, ATO, AVY, BIO, CNC, CF, CSCO, CLNE, COP, CXW, CSGP, COTY, CRH, CROX, CTS, DVN, DDS, DFS, ^DJU, ELV, EOG, XOM, FISV, FIVN, FLEX, FTV, FCX, FDP, FRD, GME, GAP, GD, GMS, GPRO, HLIT, HL, HD, HON, JBHT, IDXX, IPAR, IPG, IPI, JBLU, K, LRCX, LAMR, LANC, LMT, LOW, MHO, MGY, MAN, MRO, MRCY, MCO, MS, MUR, NFG, NOV, NTGR, NKE, NUS, OXY, OLN, PKG, PKE, PLXS, RMBS, RRC, RTX, RGS, SLB, SEE, SMTC, SWX, SXI, SUM, SNPS, TGT, TDOC, TER, TMO, TOL, TSCO, TDG, TZOO, VFC, VLO, VRSN, VRTX, V, WSO, WOLF, WDAY, IEZ, DDM, FXI, IYH, IHF, IAT, IEV, IXC, SLV, IEO, IYF, EWO, EWK, EEM, EWG, EWH, EWM, EWY, EWD, PJP, XLE, XLV, UNG. Click this link for details (pattern type, start and end dates).
For a list of small patterns (those a few days wide) click this link.
$ $ $
The following table shows where Fibonacci retrace values of the day's high-low range are plus pivot points, calculated on the Nasdaq composite, sorted by value. When several are near each other (small differences), the area might act as support or resistance.
-- Thomas Bulkowski
![]()
| © 2024 ThePatternSite.com Metric | Value | Diff | Close (within 10% of the high-low range for the day)? |
| Monthly S2 | 16,182.45 | ||
| Monthly S1 | 17,274.76 | 1,092.32 | |
| Weekly S2 | 17,739.13 | 464.36 | |
| Monthly Pivot | 17,825.15 | 86.02 | |
| Weekly S1 | 18,053.10 | 227.96 | |
| Daily S2 | 18,153.57 | 100.46 | |
| Weekly Pivot | 18,214.32 | 60.75 | |
| Low | 18,214.96 | 0.64 | Yes! The Low is close to the Weekly Pivot. |
| Daily S1 | 18,260.32 | 45.36 | |
| 61.8% Down from Intraday High | 18,279.19 | 18.87 | |
| 50% Down from Intraday High | 18,299.04 | 19.84 | |
| 38.2% Down from Intraday High | 18,318.88 | 19.84 | |
| Daily Pivot | 18,321.72 | 2.84 | Yes! The Daily Pivot is close to the 38.2% Down from Intraday High. |
| Open | 18,333.29 | 11.57 | Yes! The Open is close to the Daily Pivot. |
| Close | 18,367.08 | 33.79 | |
| High | 18,383.11 | 16.03 | Yes! The High is close to the Close. |
| Daily R1 | 18,428.47 | 45.36 | |
| Daily R2 | 18,489.87 | 61.39 | |
| Weekly R1 | 18,528.29 | 38.43 | |
| Weekly R2 | 18,689.51 | 161.21 | |
| Monthly R1 | 18,917.46 | 227.96 | |
| Monthly R2 | 19,467.85 | 550.38 |
This is a picture of the chart pattern indicator on the daily scale. The indicator is the line chart below a chart of the S&P 500 composite.
The CPI is neutral as the vertical white bar on the far right of the chart indicates. For the last week, the markets soared and it pulled the indicator upward in a surprise move. Then, today, the tech market tumbled (Nasdaq down 1% or almost 200 points).
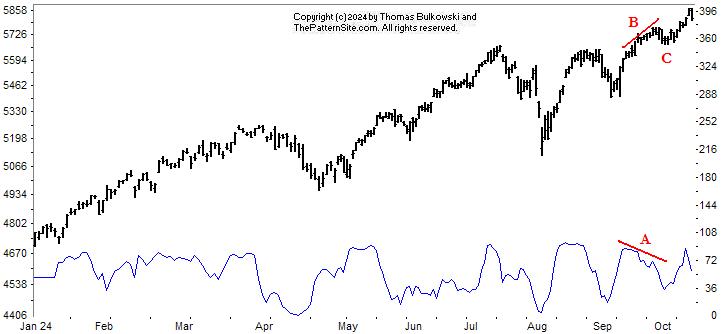
Here's the same chart without the vertical bars. Last week I discussed bearish divergence. I show that on the chart at A versus B and suggested the market would decline, following the indicator lower.
The decline, which had already happened when I wrote that, was at C. The markets have climbed since then.
As I mentioned, today's drop pulled the bullish CPI into the neutral zone. I suspect that this is a temporary decline and that we'll see a quick rebound. In fact, I bought an ETF today on that basis. But, of course, I can be wrong as I was a week ago (when I suggested a decline that wasn't C and didn't happen).
Trade well...
$ $ $
Here's a symbol list of 210 chart and candlestick patterns (13 "investment grade" candle patterns) found in today's securities using my version of Patternz: ANF, AXDX, AEIS, AMD, ALK, ALKS, AMZN, DOX, AEE, AEO, AEP, AXP, AME, APH, AAPL, ACGL, ADM, AWI, AGO, ATO, AVY, AVA, BALL, BMRN, BCO, BBW, CBT, CAL, CX, CNC, CF, CHKP, CHD, CLX, CNO, COP, CXW, GLW, CR, CRH, CROX, CTS, FANG, DDS, ^DJI, DUK, ECL, EME, FFIV, FLEX, FTV, GAP, GE, GL, GS, HLIT, HL, HUBG, JBHT, IDA, IBP, IIIN, IPAR, IPG, ISRG, IRM, JBLU, KBH, K, KFRC, KSS, LHX, LZB, LRCX, LDOS, LMT, LPLA, MHO, MAN, MRO, MLM, MTRX, MCO, ^IXIC, NOV, NTGR, NTAP, NJR, JWN, NOC, OMC, OTEX, PKG, PCG, PLXS, POR, PINC, PHM, PSTG, QTWO, QCOM, RMBS, RRC, RJF, RGS, RGA, RNG, ^GSPC, SAIA, CRM, SLB, SCHW, SAIC, SEIC, SMTC, SKX, SWX, SUM, SNPS, TGT, TDOC, TFX, TDC, TXN, TMO, TJX, TOL, TDG, RIG, TRV, TZOO, UIS, UPS, VFC, VEEV, MDRX, VMC, WSO, WOLF, ITA, IAI, IHE, IDU, FTEC, FXL, FXI, QQQ, IAT, IEV, IXN, IYF, ITB, IHI, EWO, EWQ, EWG, EWH, EWJ, EWY, EWD, EWT, QLD, DBA, PBE, PEJ, SSO, XLP, GLD, XLI, SPY, XAR, XLK, UNG, USO, VIS, MGK, VONG. Click this link for details (pattern type, start and end dates).
For a list of small patterns (those a few days wide) click this link.
-- Thomas Bulkowski
![]()
$ $ $
I show another slider trading quiz featuring WM Wrigley: WWY stock.
$ $ $
Here's a symbol list of 139 chart and candlestick patterns (13 "investment grade" candle patterns) found in today's securities using my version of Patternz: DDD, MMM, ANF, AXDX, AXP, AMWD, AMN, APH, ATR, AWI, ATO, AVY, AVA, BERY, BCO, BMY, BRKR, BBW, CBT, CNP, CHKP, CI, CTAS, CXW, CR, DDS, DFS, DSGR, ^DJI, EBAY, EXC, FICO, FORM, GD, GIS, GFS, GS, HBI, HLIT, HE, HTLD, HOV, IDA, IBP, IPAR, JBLU, KLAC, LRCX, M, MAN, MCHX, MLKN, MYGN, ^IXIC, NFLX, NTAP, NEU, NVDA, ORI, OTEX, OXM, PKE, PTEN, PEN, PCG, PPG, PINC, QCOM, RMBS, ^GSPC, SLGN, STR, SO, SWX, SSYS, SUM, SNPS, TPX, TDC, TOL, TG, UHAL, VEEV, MDRX, VMC, WU, WSM, WSC, WWD, IAI, IYK, IHE, IDU, DDM, FTEC, QTEC, FXL, BOTZ, QQQ, IAT, IGV, IXN, SOXX, EWO, EWK, EWI, EWW, EWS, EWD, TUR, QLD, PHO, SSO, XHB, SPY, XLK, XLU, UNG, SMH, MGK, VONG. Click this link for details (pattern type, start and end dates).
For a list of small patterns (those a few days wide) click this link.
$ $ $
The following table shows where Fibonacci retrace values of the day's high-low range are plus pivot points, calculated on the Dow industrials, sorted by value. When several are near each other (small differences), the area might act as support or resistance.
-- Thomas Bulkowski
![]()
| © 2024 ThePatternSite.com Metric | Value | Diff | Close (within 10% of the high-low range for the day)? |
| Monthly S2 | 39,079.33 | ||
| Monthly S1 | 41,072.28 | 1,992.95 | |
| Weekly S2 | 41,530.89 | 458.62 | |
| Monthly Pivot | 41,986.01 | 455.12 | |
| Weekly S1 | 42,298.05 | 312.04 | |
| Daily S2 | 42,538.59 | 240.54 | |
| Weekly Pivot | 42,598.90 | 60.31 | |
| Low | 42,707.14 | 108.24 | |
| Open | 42,800.89 | 93.75 | |
| Daily S1 | 42,801.91 | 1.02 | Yes! The Daily S1 is close to the Open. |
| 61.8% Down from Intraday High | 42,872.11 | 70.20 | |
| 50% Down from Intraday High | 42,923.07 | 50.96 | |
| Daily Pivot | 42,970.45 | 47.38 | |
| 38.2% Down from Intraday High | 42,974.03 | 3.58 | Yes! The 38.2% Down from Intraday High is close to the Daily Pivot. |
| Close | 43,065.22 | 91.19 | |
| High | 43,139.00 | 73.78 | |
| Daily R1 | 43,233.77 | 94.77 | |
| Weekly R1 | 43,366.07 | 132.30 | |
| Daily R2 | 43,402.31 | 36.25 | Yes! The Daily R2 is close to the Weekly R1. |
| Weekly R2 | 43,666.91 | 264.60 | |
| Monthly R1 | 43,978.96 | 312.04 | |
| Monthly R2 | 44,892.69 | 913.73 |
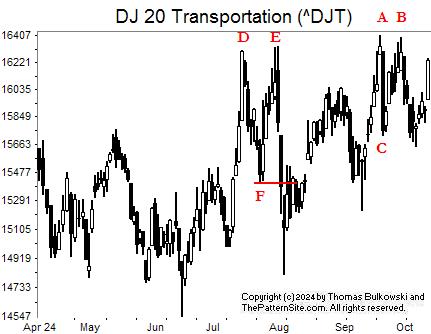
I show the Dow transports on the daily scale. At DE, there's a chart pattern called a double top It confirms as a valid chart pattern when the index closes below F (which it does).
Compare that to the twin peak pattern at AB. To confirm, the index has to close below the lowest valley between the two peaks. In this case, though, confirmation doesn't happen.
However, if the index were to close above the top of AB (the taller of the two, which is A), it would suggest a strong move higher. No guarantee of that, of course, so we'll have to wait and see if the index climbs that far and then wait to see how far it rises.
![]()
The following is a brief review of how the markets performed over time. The numbers refer to the close-to-close move in the Dow industrials.
Many options expire this week, so traders will be looking to close out their positions, and that suggests increased volatility (large daily price swings).
![]()
The following is based on an SFO article in December 2004 by John Seekinger, titled, "Take a two-dimensional approach." He offers these tips.
| Index | S2 | S1 | Pivot | R1 | R2 |
| Dow Industrials (^DJI): Daily | 42,365 | 42,614 | 42,757 | 43,007 | 43,149 |
| Weekly | 41,464 | 42,164 | 42,532 | 43,232 | 43,600 |
| Monthly | 39,012 | 40,938 | 41,919 | 43,845 | 44,826 |
| S&P500 (^GSPC): Daily | 5,757 | 5,786 | 5,804 | 5,833 | 5,851 |
| Weekly | 5,639 | 5,727 | 5,775 | 5,862 | 5,910 |
| Monthly | 5,266 | 5,541 | 5,681 | 5,956 | 6,097 |
| Nasdaq (^IXIC): Daily | 18,142 | 18,242 | 18,309 | 18,410 | 18,476 |
| Weekly | 17,731 | 18,037 | 18,206 | 18,512 | 18,681 |
| Monthly | 16,174 | 17,259 | 17,817 | 18,901 | 19,460 |
Here are the formulas:
![]()
Earnings season will be starting in about 2 days.
Here's a symbol list of 176 chart and candlestick patterns (13 "investment grade" candle patterns) found in today's securities using my version of Patternz: ANF, ABM, AXDX, ACIW, ADTN, ATSG, ALK, ALKS, ALGT, AMZN, AEO, AXP, AAPL, ATR, AWI, ARW, AVY, AVNT, BCPC, BA, BCO, CBT, CACI, CPB, CLS, CENX, CRL, CVX, CSCO, CLF, CLX, CMCO, COTY, CR, CCK, CSGS, DHR, FANG, DDS, DSGR, ^DJI, ECL, EME, EQT, XOM, FARO, FAST, FORM, FNV, FRD, GFS, GS, GPRO, GFF, HLIT, HSY, HNI, HOLX, HON, DHI, IDA, IEX, ITW, NSP, IIIN, IPAR, TILE, IPI, JAZZ, JBLU, KLIC, LZB, LANC, LPLA, M, MGY, MANH, MAN, MKTX, MRTN, MAS, MA, MU, MLKN, MLI, ^IXIC, NFLX, NWPX, NOVT, NVDA, ASGN, OR, PKG, PATK, PDCO, PTEN, PLXS, PPG, PINC, PEG, QTWO, RJF, RCKY, ROG, RGLD, ^GSPC, SAND, SEE, SIGI, SMTC, STR, SKX, SWX, SR, SCS, TPR, TGT, TPX, TDC, TER, TXN, TXT, TKR, TDG, TZOO, TWLO, UIS, VMI, VEEV, WU, WEX, WSC, WOLF, ITA, IYM, IYC, IHE, DDM, FXL, BOTZ, ICF, IHF, IAT, IEV, IGV, IYF, EWG, EWI, EPP, EWL, DBA, PBE, PHO, SSO, XLF, XLI, SPY, XAR, VIS, VAW, MGK, VONG. Click this link for details (pattern type, start and end dates).
For a list of small patterns (those a few days wide) click this link.
The below industries were the best (rank 1) or worst performing of those I follow.
|
-- Thomas Bulkowski
![]()
Here's a symbol list of 141 chart and candlestick patterns (13 "investment grade" candle patterns) found in today's securities using my version of Patternz: ANF, AYI, AMD, ALK, ALB, ALL, AEE, AEO, AEP, AIG, AMN, AVNT, AXS, BSET, BZH, BKH, BA, CAL, CE, CNC, CENX, CF, CVX, CHD, CGNX, CTSH, CL, ED, COST, COTY, CR, CCK, CTS, DVN, DDS, EIX, EVRG, EVH, EXC, EXPI, FARO, FMC, GIS, GFS, GS, GPRO, GFF, HSII, IDA, IEX, IPAR, IPI, JAZZ, JBLU, KALU, KELYA, KMB, KLIC, LZB, LEG, LLY, MAN, MCHX, MRTN, MA, MRCY, MLI, ^IXIC, NFG, NFLX, NJR, NTNX, NVDA, OGE, PATK, PDCO, PTEN, PEN, PLXS, PPG, PPL, RNG, RCKY, SBH, SEE, STR, SR, SCS, SSYS, SRDX, TPX, TDC, TXT, TG, TREX, UGI, VFC, VMI, VMC, WERN, WSM, WSC, IYM, IHE, QQQ, IHF, IGV, MXI, EWJ, EWS, EWP, EWD, PBE, XHB, MGK, VONG. Click this link for details (pattern type, start and end dates).
For a list of small patterns (those a few days wide) click this link.
$ $ $
You can find setups based on a Fibonacci retrace by clicking on the link.
The following patterns were found manually, not using Patternz. Mr. Bulkowski has excluded any securities he owns from appearing in the list. However, he may add any of the securities listed to his portfolio at any time, just as you can.
In the table below, the red and green colors are based on the historical breakout direction for the associated chart pattern. If a high and tight flag appears, the start and end dates highlight the flagpole only and not the flag.
For details about the chart patterns, click here.
-- Thomas Bulkowski, author: Invest for Two-Comma Wealth and the novel (fiction), Foresight (#Ad)
![]()
| Symbol | Chart Pattern | Bullish Bearish | Start | End | Industry |
| ABT | Double Bottom, Eve and Eve | 09/25/2024 | 10/04/2024 | Medical Supplies | |
| ANF | Rectangle bottom | 09/04/2024 | 10/10/2024 | Apparel | |
| ABM | Triangle, ascending | 09/11/2024 | 10/10/2024 | Industrial Services | |
| AMD | Ugly double bottom | 08/05/2024 | 09/06/2024 | Semiconductor | |
| AMED | Double Bottom, Adam and Adam | 10/02/2024 | 10/07/2024 | Medical Services | |
| AIG | Double Bottom, Eve and Adam | 09/10/2024 | 10/03/2024 | Insurance (Prop/Casualty) | |
| APA | Horn bottom | 09/09/2024 | 09/23/2024 | Petroleum (Producing) | |
| ADSK | Broadening top, right-angled and ascending | 09/19/2024 | 10/10/2024 | Computer Software and Svcs | |
| AVY | Broadening top | 08/30/2024 | 09/27/2024 | Packaging and Container | |
| BALL | Double Top, Eve and Eve | 09/17/2024 | 10/01/2024 | Packaging and Container | |
| BECN | Double Bottom, Adam and Adam | 08/05/2024 | 09/11/2024 | Retail Building Supply | |
| CLS | Double Bottom, Adam and Eve | 08/05/2024 | 09/06/2024 | Electronics | |
| CAG | Three Falling Peaks | 09/10/2024 | 10/01/2024 | Food Processing | |
| CR | Pipe bottom | 09/03/2024 | 09/09/2024 | Diversified Co. | |
| CSGS | Triangle, ascending | 09/18/2024 | 10/10/2024 | IT Services | |
| FANG | Double Bottom, Eve and Eve | 09/11/2024 | 09/26/2024 | Petroleum (Producing) | |
| DFS | Double Bottom, Eve and Eve | 09/24/2024 | 10/03/2024 | Financial Services | |
| ^DJT | Double Top, Adam and Adam | 09/19/2024 | 09/30/2024 | None | |
| D | Double Top, Adam and Adam | 09/16/2024 | 10/02/2024 | Electric Utility (East) | |
| BOOM | Ugly double bottom | 09/11/2024 | 09/26/2024 | Metal Fabricating | |
| EFX | Double Top, Eve and Eve | 09/03/2024 | 09/16/2024 | Information Services | |
| EG | Ugly double bottom | 08/05/2024 | 09/11/2024 | Insurance (Prop/Casualty) | |
| HQY | Broadening top | 09/17/2024 | 10/03/2024 | Healthcare Information | |
| HL | Head-and-shoulders top | 09/18/2024 | 10/04/2024 | Metals and Mining (Div.) | |
| HP | Double Bottom, Eve and Eve | 09/11/2024 | 09/26/2024 | Petroleum (Producing) | |
| HOLX | Triangle, descending | 09/11/2024 | 10/10/2024 | Medical Supplies | |
| HUBG | Double Top, Eve and Eve | 08/30/2024 | 09/19/2024 | Trucking/Transp. Leasing | |
| INTU | Double Top, Adam and Adam | 09/13/2024 | 09/19/2024 | Computer Software and Svcs | |
| KBH | Pipe top | 09/16/2024 | 09/23/2024 | Homebuilding | |
| MGY | Double Bottom, Adam and Eve | 08/05/2024 | 09/11/2024 | Petroleum (Producing) | |
| MRTN | Broadening bottom | 08/12/2024 | 10/10/2024 | Trucking/Transp. Leasing | |
| MYGN | Double Top, Eve and Eve | 08/29/2024 | 09/18/2024 | Biotechnology | |
| NTAP | Ugly double bottom | 09/11/2024 | 10/01/2024 | Computers and Peripherals | |
| NEE | Double Top, Adam and Eve | 09/16/2024 | 10/03/2024 | Electric Utility (East) | |
| OGE | Triple top | 09/16/2024 | 10/02/2024 | Electric Utility (Central) | |
| OMI | Triple top | 08/26/2024 | 09/30/2024 | Medical Supplies | |
| PANW | Double Bottom, Adam and Eve | 09/18/2024 | 10/01/2024 | Computer Software and Svcs | |
| PKE | Double Top, Eve and Eve | 08/28/2024 | 09/12/2024 | Chemical (Specialty) | |
| PATK | Double Top, Eve and Eve | 09/20/2024 | 10/04/2024 | Retail Building Supply | |
| PEN | Triangle, symmetrical | 09/19/2024 | 10/10/2024 | Medical Supplies | |
| PNW | Triple top | 09/16/2024 | 10/01/2024 | Electric Utility (West) | |
| PRU | Ugly double bottom | 08/05/2024 | 09/11/2024 | Insurance (Life) | |
| PSTG | Pipe bottom | 09/03/2024 | 09/09/2024 | Computers and Peripherals | |
| QCOM | Triangle, descending | 09/20/2024 | 10/10/2024 | Telecom. Equipment | |
| RGA | Triangle, ascending | 09/03/2024 | 10/09/2024 | Insurance (Life) | |
| RES | Ugly double bottom | 09/12/2024 | 09/26/2024 | Oilfield Svcs/Equipment | |
| SRE | Triple top | 09/16/2024 | 10/01/2024 | Electric Utility (West) | |
| SNPS | Ugly double bottom | 09/09/2024 | 10/07/2024 | Computer Software and Svcs | |
| TRV | Double Top, Adam and Eve | 09/09/2024 | 09/17/2024 | Insurance (Prop/Casualty) | |
| UIS | Pipe bottom | 09/03/2024 | 09/09/2024 | Computers and Peripherals |
![]()
$ $ $
I show a picture of the Nasdaq composite on the 5-minute scale.
At BC, we see a twin peak pattern called a double top. It confirms as a valid chart pattern when the index closes below the horizontal red line. In this case, the index dropped only to A, far less than it should have.
At A, we see a small double bottom but this one accompanies a huge rise (compared to the size of chart pattern A).
My guess is the failure of the BC pattern to see price drop far suggested a big increase to come. I don't know if the markets work like that, but I've used the notion to my advantage in the past (think busted chart patterns).
$ $ $
Here's a symbol list of 105 chart and candlestick patterns (13 "investment grade" candle patterns) found in today's securities using my version of Patternz: ANF, AXDX, ACN, AMD, AES, ALK, AA, ALGT, AEP, AFG, AMWD, ADM, AWI, BA, BR, CAL, CTAS, CTSH, CL, CSGP, CW, DDS, EMN, EME, EG, EVRG, EXPI, FICO, FARO, FLEX, FMC, GAP, GE, GIS, HE, HELE, HP, INFN, INTC, IPAR, IPG, JBLU, LZB, MANH, MTRN, MGEE, MS, MYGN, NBR, NFLX, NJR, JWN, NOVT, NTNX, NVDA, ORI, PKE, PTEN, PPG, PPL, RRC, RJF, RGS, ROG, ROP, R, ^GSPC, SCI, NOW, STR, SO, SCS, SRDX, TPX, RIG, UPS, VECO, MDRX, WU, WSM, WSC, IYM, FXL, QQQ, IGV, EWZ, EWG, EWJ, EWU, PPA, PBE, SSO, ROBO, XLF, SPY, VONG. Click this link for details (pattern type, start and end dates).
For a list of small patterns (those a few days wide) click this link.
$ $ $
The following table shows where Fibonacci retrace values of the day's high-low range are plus pivot points, calculated on the Nasdaq composite, sorted by value. When several are near each other (small differences), the area might act as support or resistance.
-- Thomas Bulkowski
![]()
| © 2024 ThePatternSite.com Metric | Value | Diff | Close (within 10% of the high-low range for the day)? |
| Monthly S2 | 16,103.74 | ||
| Monthly S1 | 17,197.68 | 1,093.94 | |
| Weekly S2 | 17,655.49 | 457.81 | |
| Monthly Pivot | 17,762.51 | 107.02 | |
| Weekly S1 | 17,973.55 | 211.04 | |
| Daily S2 | 18,073.20 | 99.65 | |
| Weekly Pivot | 18,085.86 | 12.66 | Yes! The Weekly Pivot is close to the Daily S2. |
| Low | 18,133.02 | 47.16 | |
| Open | 18,179.22 | 46.20 | |
| Daily S1 | 18,182.41 | 3.19 | Yes! The Daily S1 is close to the Open. |
| 61.8% Down from Intraday High | 18,197.59 | 15.18 | Yes! The 61.8% Down from Intraday High is close to the Daily S1. |
| 50% Down from Intraday High | 18,217.54 | 19.95 | |
| 38.2% Down from Intraday High | 18,237.48 | 19.95 | |
| Daily Pivot | 18,242.23 | 4.75 | Yes! The Daily Pivot is close to the 38.2% Down from Intraday High. |
| Close | 18,291.62 | 49.39 | |
| High | 18,302.05 | 10.43 | Yes! The High is close to the Close. |
| Daily R1 | 18,351.44 | 49.39 | |
| Weekly R1 | 18,403.92 | 52.48 | |
| Daily R2 | 18,411.26 | 7.34 | Yes! The Daily R2 is close to the Weekly R1. |
| Weekly R2 | 18,516.23 | 104.97 | |
| Monthly R1 | 18,856.45 | 340.22 | |
| Monthly R2 | 19,421.28 | 564.83 |
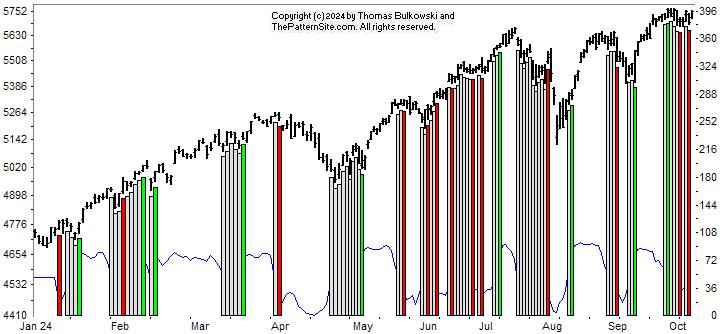
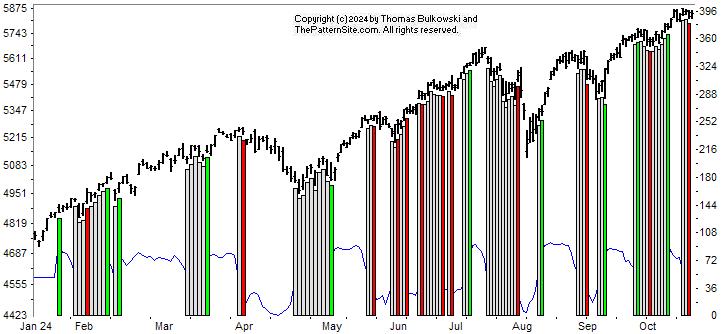
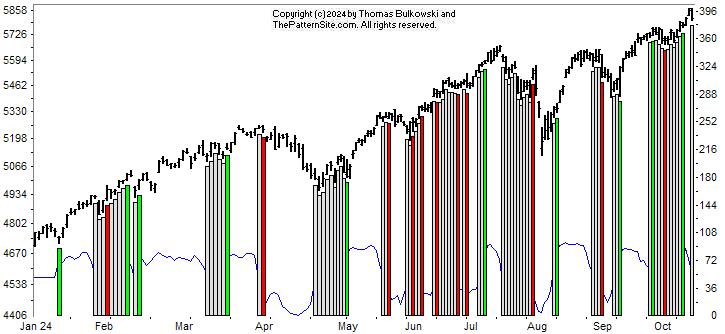
This is a picture of the chart pattern indicator on the daily scale. The indicator is the line chart below a chart of the S&P 500 composite.
As the chart shows, the indicator has been vacillating between neutral (gray bars) and bearish (red bars) on the far right of the chart.
That's not as alarming as what the next chart shows.
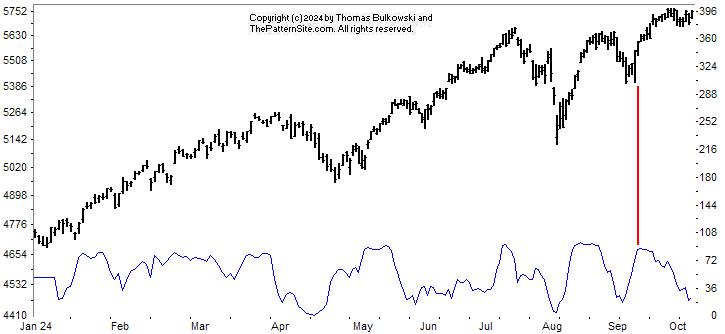
From the vertical red line on the chart, in September, notice that the CPI peaked even as the index made a minor low.
From that point, the CPI dropped and the index climbed. That's bearish divergence. Bearish divergence suggests, but does not guarantee, that the index will follow the indicator lower. It's a bearish signal.
It doesn't always work. Plus, you don't know when the index will drop. The indicator has been signaling a downturn for almost a month now but the index doesn't care. It continues to rise. However, I think the party is about over. I'll buy more when we see a dip, probably before month's end.
$ $ $
Here's a symbol list of 110 chart and candlestick patterns (13 "investment grade" candle patterns) found in today's securities using my version of Patternz: ABM, AES, AKAM, ALK, ALKS, ALGT, AMZN, AMWD, APH, AON, AAPL, ADM, BCPC, BSET, BA, CDNS, CALM, CF, CHD, CNO, GLW, CR, DDS, DFS, DUK, EMN, EVH, EXC, FARO, FIVN, FMC, GIS, GNW, GGG, HELE, HSY, HNI, INFN, IPAR, ISRG, JBLU, K, KELYA, MGEE, MLKN, MYGN, NOVT, NTNX, NVDA, OGE, OTEX, OMI, PKE, PDCO, PTEN, PPG, PG, RTX, RGS, ROG, ROL, R, SAND, SEIC, SCI, STR, SCS, SNPS, TDOC, TDC, TTD, TSCO, TDG, RIG, TZOO, TG, UPS, MDRX, VRTX, WAT, WPM, WSC, IYM, IYC, FXL, BOTZ, IHF, IGV, MXI, ILF, IHI, EWO, EWK, EWZ, EWG, EWU, XLY, XLP, XAR, UNG, MGK. Click this link for details (pattern type, start and end dates).
For a list of small patterns (those a few days wide) click this link.
-- Thomas Bulkowski
![]()
$ $ $
I show another slider trading quiz featuring Wyeth: WYE stock.
$ $ $
Here's a symbol list of 130 chart and candlestick patterns (13 "investment grade" candle patterns) found in today's securities using my version of Patternz: AFL, ALKS, DOX, AEO, AEP, AME, AMGN, AMN, ANIK, APA, ARCB, ACGL, AXS, BCPC, BZH, BBY, BIO, BOOT, BLDR, CDNS, CX, CF, CRL, CHKP, CHD, CINF, CNA, CL, CMCO, CAG, DUK, BOOM, EIX, EMR, EVH, EXC, EXPI, FDS, FIVN, FTNT, FCX, GPRO, HL, HSY, HUM, NSP, PODD, JBLU, KBH, KELYA, LHX, LH, LNC, L, MRTN, MS, MOS, NTNX, NVDA, OGE, OMI, OXM, PDCO, PEN, PFE, PNW, PPL, PFG, PG, RGS, RGA, RNG, RLI, RCKY, ROG, ROP, RGLD, SAND, SAIC, SEIC, SMTC, SCI, SMAR, SRDX, SNPS, TDOC, TPX, TMO, RIG, TWLO, VFC, VMI, WERN, WU, WPM, WWW, IYK, IHE, FXI, ICF, IYH, IHF, IHI, EWO, EEM, IBB, DBA, PBE, PJP, XLP, XLF, XLV, UNG. Click this link for details (pattern type, start and end dates).
For a list of small patterns (those a few days wide) click this link.
$ $ $
The following table shows where Fibonacci retrace values of the day's high-low range are plus pivot points, calculated on the Dow industrials, sorted by value. When several are near each other (small differences), the area might act as support or resistance.
-- Thomas Bulkowski
![]()
| © 2024 ThePatternSite.com Metric | Value | Diff | Close (within 10% of the high-low range for the day)? |
| Monthly S2 | 38,889.96 | ||
| Monthly S1 | 40,422.10 | 1,532.14 | |
| Monthly Pivot | 41,525.21 | 1,103.11 | |
| Weekly S2 | 41,540.71 | 15.50 | Yes! The Weekly S2 is close to the Monthly Pivot. |
| Daily S2 | 41,564.64 | 23.93 | Yes! The Daily S2 is close to the Weekly S2. |
| Weekly S1 | 41,747.47 | 182.83 | |
| Daily S1 | 41,759.44 | 11.97 | Yes! The Daily S1 is close to the Weekly S1. |
| Low | 41,831.74 | 72.30 | |
| Close | 41,954.24 | 122.50 | |
| 61.8% Down from Intraday High | 42,008.19 | 53.95 | |
| Daily Pivot | 42,026.54 | 18.35 | Yes! The Daily Pivot is close to the 61.8% Down from Intraday High. |
| Weekly Pivot | 42,054.58 | 28.04 | Yes! The Weekly Pivot is close to the Daily Pivot. |
| 50% Down from Intraday High | 42,062.69 | 8.11 | Yes! The 50% Down from Intraday High is close to the Weekly Pivot. |
| 38.2% Down from Intraday High | 42,117.20 | 54.50 | |
| Daily R1 | 42,221.34 | 104.14 | |
| Weekly R1 | 42,261.34 | 40.00 | Yes! The Weekly R1 is close to the Daily R1. |
| Open | 42,289.51 | 28.17 | Yes! The Open is close to the Weekly R1. |
| High | 42,293.64 | 4.13 | Yes! The High is close to the Open. |
| Daily R2 | 42,488.44 | 194.80 | |
| Weekly R2 | 42,568.45 | 80.00 | |
| Monthly R1 | 43,057.35 | 488.91 | |
| Monthly R2 | 44,160.46 | 1,103.11 |
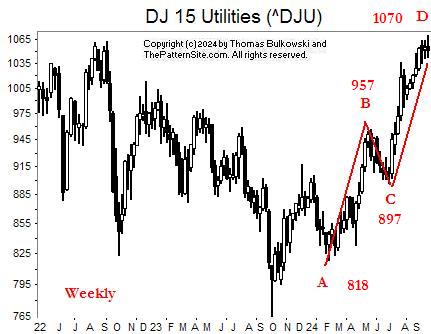
I show the Dow utilities on the weekly scale so I'll have something to write about.
The ABCD pattern is called a measured move up. AB is the first leg, CD is the second leg, and BC is the corrective phase.
The theory behind the pattern is that CD will approximate the length and duration of AB. That's rarely true, but let's see how it works in this case.
AB is 139 points tall (957-818). Add that to the bottom, C (897), gives a target of 1036. The index hit a high of 1070 at D. In this case, the measure rule worked. I didn't calculate the date differences, so I don't know how close it came to the duration. However, they both appear to be about 3 months long.
What I like most about the MMU is not the prediction of how far CD will rise, but what happens after the pattern ends. You'll often see a retrace from D back to somewhere in BC (corrective phase).
![]()
The following is a brief review of how the markets performed over time. The numbers refer to the close-to-close move in the Dow industrials.
No options expire this week.
![]()
The following is based on an SFO article in December 2004 by John Seekinger, titled, "Take a two-dimensional approach." He offers these tips.
| Index | S2 | S1 | Pivot | R1 | R2 |
| Dow Industrials (^DJI): Daily | 41,839 | 42,096 | 42,229 | 42,486 | 42,618 |
| Weekly | 41,674 | 42,013 | 42,187 | 42,527 | 42,701 |
| Monthly | 39,023 | 40,688 | 41,658 | 43,323 | 44,293 |
| S&P500 (^GSPC): Daily | 5,685 | 5,718 | 5,736 | 5,769 | 5,786 |
| Weekly | 5,639 | 5,695 | 5,730 | 5,786 | 5,821 |
| Monthly | 5,276 | 5,513 | 5,640 | 5,878 | 6,005 |
| Nasdaq (^IXIC): Daily | 17,925 | 18,032 | 18,088 | 18,195 | 18,251 |
| Weekly | 17,604 | 17,871 | 18,035 | 18,301 | 18,465 |
| Monthly | 16,052 | 17,095 | 17,711 | 18,754 | 19,370 |
Here are the formulas:
![]()
Earnings season will be starting in about 9 days.
Here's a symbol list of 166 chart and candlestick patterns (13 "investment grade" candle patterns) found in today's securities using my version of Patternz: ANF, AXDX, ACIW, AYI, ALB, ALKS, DOX, AEP, AXP, AME, AMN, ANIK, APA, APOG, ARCB, ACGL, AWI, AGO, ATO, AVNT, AXS, BCPC, BZH, BIO, BOOT, BBW, BLDR, BG, CAL, CLS, CX, CHD, CINF, CNA, CL, ED, CCRN, DECK, DVN, FANG, ^DJU, DUK, BOOM, EMN, EBAY, EIX, EQT, EG, EXPI, FDX, FLEX, FNV, GAP, GE, GNW, GS, HBI, THG, HIG, HTLD, HSII, DHI, HOV, HUBG, JBHT, IDA, IDXX, NSP, PODD, IBKR, JBLU, KBH, KFRC, KMB, LZB, LH, LEN, L, LPLA, LXU, MHO, MTSI, M, MGY, MAS, MTDR, MS, NOV, NFLX, NUS, NTNX, OGE, OMCL, OR, OXM, PATK, PTEN, PETS, PCG, POR, PPL, KWR, RJF, RGA, RNG, RLI, RCKY, ROST, CRM, SBH, SIGI, SCI, NOW, SMAR, LUV, SPSC, TDC, TOL, RIG, TRV, UNM, VC, WAT, WERN, WMB, WSM, WWW, WDAY, XEL, IEZ, FDN, FXL, FXI, ICF, IYH, MXI, IGE, ITB, IHI, EWA, EWC, EWM, EWW, EWL, PBE, PXJ, ROBO, XLP, XLF, XLV, XHB. Click this link for details (pattern type, start and end dates).
For a list of small patterns (those a few days wide) click this link.
The below industries were the best (rank 1) or worst performing of those I follow.
|
-- Thomas Bulkowski
![]()
Here's a symbol list of 148 chart and candlestick patterns (13 "investment grade" candle patterns) found in today's securities using my version of Patternz: ACN, AEIS, ALRM, ALKS, ALL, AMZN, AEE, AEP, AMN, AON, APA, ARCB, AIZ, AVNT, BBY, BIO, BA, BMY, CAL, CPB, CX, CNC, CHD, CNA, CL, ED, CAG, COTY, CRH, CCRN, XRAY, ^DJU, EMN, EIX, EVH, EXPI, EZPW, FDS, FDX, FNV, IT, GE, HIG, HTLD, HELE, HP, HON, HWM, HUBG, JBHT, IDXX, INFN, NSP, IIIN, PODD, IBKR, IPG, JAZZ, KALU, KBH, KMT, KFRC, LZB, LEG, L, M, MGY, MKTX, MRTN, MTRN, META, MU, MUR, NOV, NUS, NTNX, NVDA, OGE, OR, OXM, PATK, PDCO, PCG, POR, PPL, PEG, KWR, DGX, RLI, SBH, SEE, SRE, SCI, NOW, LUV, SPSC, SCS, TOL, TDG, TRV, TREX, VC, WWW, XEL, IYK, IYC, IEZ, IYH, IHF, IEV, MXI, SLV, IGE, EWO, EWK, EWZ, ECH, EWQ, EWG, EWI, EWM, EWS, EWD, EWL, THD, TUR, EWU, PJP, XLP, XLV, XLB, XAR, USO, VAW. Click this link for details (pattern type, start and end dates).
For a list of small patterns (those a few days wide) click this link.
$ $ $
You can find setups based on a Fibonacci retrace by clicking on the link.
The following patterns were found manually, not using Patternz. Mr. Bulkowski has excluded any securities he owns from appearing in the list. However, he may add any of the securities listed to his portfolio at any time, just as you can.
In the table below, the red and green colors are based on the historical breakout direction for the associated chart pattern. If a high and tight flag appears, the start and end dates highlight the flagpole only and not the flag.
For details about the chart patterns, click here.
-- Thomas Bulkowski, author: Invest for Two-Comma Wealth and the novel (fiction), Foresight (#Ad)
![]()
| Symbol | Chart Pattern | Bullish Bearish | Start | End | Industry |
| AXDX | Double Bottom, Adam and Adam | 09/12/2024 | 09/20/2024 | Medical Services | |
| ATSG | Double Top, Eve and Adam | 09/20/2024 | 09/30/2024 | Air Transport | |
| ALB | Pipe bottom | 09/03/2024 | 09/09/2024 | Chemical (Diversified) | |
| AEP | Falling wedge | 09/06/2024 | 09/26/2024 | Electric Utility (Central) | |
| AR | Double Bottom, Adam and Eve | 08/05/2024 | 09/10/2024 | Natural Gas (Diversified) | |
| APA | Double Bottom, Adam and Adam | 09/11/2024 | 09/26/2024 | Petroleum (Producing) | |
| ACGL | Triangle, ascending | 09/04/2024 | 10/03/2024 | Insurance (Prop/Casualty) | |
| ARW | Double Top, Adam and Adam | 09/20/2024 | 09/27/2024 | Electronics | |
| AVNT | Ugly double bottom | 08/05/2024 | 09/11/2024 | Chemical (Specialty) | |
| BAX | Head-and-shoulders top | 09/09/2024 | 09/27/2024 | Medical Supplies | |
| BKH | Double Top, Adam and Adam | 09/17/2024 | 09/24/2024 | Electric Utility (West) | |
| BRKR | Ugly double bottom | 08/06/2024 | 09/11/2024 | Precision Instrument | |
| CLS | Pipe bottom | 09/03/2024 | 09/09/2024 | Electronics | |
| CI | Double Top, Adam and Adam | 09/04/2024 | 09/16/2024 | Medical Services | |
| CLF | Pipe bottom | 09/03/2024 | 09/09/2024 | Metals and Mining (Div.) | |
| CMTL | Flag, high and tight | 08/05/2024 | 10/01/2024 | Telecom. Equipment | |
| COP | Double Bottom, Adam and Adam | 09/11/2024 | 09/26/2024 | Petroleum (Integrated) | |
| COST | Double Top, Adam and Adam | 09/13/2024 | 09/23/2024 | Retail Store | |
| CROX | Ugly double bottom | 08/05/2024 | 09/11/2024 | Shoe | |
| DECK | Triangle, ascending | 08/28/2024 | 10/03/2024 | Shoe | |
| XRAY | Double Top, Adam and Adam | 09/18/2024 | 09/27/2024 | Medical Supplies | |
| EIX | Double Bottom, Adam and Adam | 09/11/2024 | 09/20/2024 | Electric Utility (West) | |
| EVRG | Head-and-shoulders top | 09/16/2024 | 09/30/2024 | Electric Utility (Central) | |
| FDP | Double Top, Eve and Eve | 09/18/2024 | 10/01/2024 | Food Processing | |
| GD | Double Top, Adam and Eve | 09/16/2024 | 09/23/2024 | Aerospace/Defense | |
| HSII | Double Top, Eve and Eve | 09/20/2024 | 09/30/2024 | Human Resources | |
| HUM | Dead-cat bounce | 10/02/2024 | 10/02/2024 | Medical Services | |
| INCY | Pipe bottom | 09/03/2024 | 09/09/2024 | Drug | |
| NSP | Pipe top | 09/16/2024 | 09/23/2024 | Human Resources | |
| JKHY | Double Bottom, Eve and Adam | 09/06/2024 | 09/25/2024 | IT Services | |
| LXU | Ugly double bottom | 09/11/2024 | 09/23/2024 | Building Materials | |
| MTSI | Pipe bottom | 07/29/2024 | 08/05/2024 | Semiconductor | |
| M | Ugly double bottom | 09/11/2024 | 09/25/2024 | Retail Store | |
| MRTN | Double Top, Adam and Adam | 09/19/2024 | 09/30/2024 | Trucking/Transp. Leasing | |
| MRK | Double Top, Adam and Eve | 09/06/2024 | 09/18/2024 | Drug | |
| NWL | Diamond bottom | 08/16/2024 | 10/03/2024 | Household Products | |
| NWPX | Pipe bottom | 09/03/2024 | 09/09/2024 | Building Materials | |
| OXY | Double Bottom, Adam and Adam | 09/11/2024 | 09/26/2024 | Petroleum (Producing) | |
| OGE | Triangle, ascending | 09/16/2024 | 10/03/2024 | Electric Utility (Central) | |
| ASGN | Diamond top | 09/16/2024 | 10/03/2024 | Human Resources | |
| PKE | Double Top, Eve and Eve | 08/28/2024 | 09/12/2024 | Chemical (Specialty) | |
| PDCO | Double Top, Eve and Adam | 09/19/2024 | 09/27/2024 | Medical Supplies | |
| PAYX | Triple bottom | 09/20/2024 | 10/01/2024 | IT Services | |
| POR | Double Top, Adam and Adam | 09/05/2024 | 09/17/2024 | Electric Utility (West) | |
| PINC | Horn top | 09/03/2024 | 09/16/2024 | Healthcare Information | |
| PG | Double Top, Eve and Adam | 09/10/2024 | 09/16/2024 | Household Products | |
| KWR | Double Top, Eve and Adam | 09/18/2024 | 09/27/2024 | Chemical (Specialty) | |
| RRC | Double Bottom, Adam and Adam | 08/05/2024 | 09/10/2024 | Petroleum (Producing) | |
| ROG | Ugly double bottom | 09/11/2024 | 09/23/2024 | Electronics | |
| SR | Triple top | 09/17/2024 | 09/30/2024 | Natural Gas (Distributor) | |
| SUM | Double Top, Eve and Adam | 09/19/2024 | 09/26/2024 | Cement and Aggregates | |
| TECH | Double Top, Adam and Eve | 09/19/2024 | 09/27/2024 | Biotechnology | |
| TXT | Triangle, symmetrical | 08/08/2024 | 10/03/2024 | Diversified Co. | |
| TJX | Double Top, Eve and Adam | 08/28/2024 | 09/16/2024 | Retail Store | |
| VEEV | Double Top, Adam and Eve | 08/29/2024 | 09/12/2024 | Healthcare Information | |
| VMC | Double Top, Adam and Adam | 09/20/2024 | 09/26/2024 | Cement and Aggregates | |
| WSC | Double Top, Adam and Adam | 09/18/2024 | 09/25/2024 | Industrial Services |
![]()
$ $ $
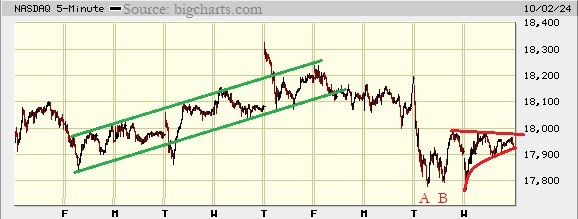
I show a picture of the Nasdaq composite on the 5-minute scale.
The index followed the channel, shown here in green lines, until Friday. During trading on Friday, the index pierced the lower boundary of the channel.
The index took a big plunge on Tuesday before finding bottom at valleys AB. That pattern (AB) is a confirmed double bottom when the index closed above the highest peak between bottoms A and B.
However, the index climbed less than 100 points (a bit less than predicted) before forming a weird looking symmetrical triangle. I say weird because the bottom trendline curves (see red curved line on chart).
I took a glance at the CPI and it showed the markets were still neutral but it had a reading slightly above 35 (35 is bearish). So my guess is the index will drop.
$ $ $
Here's a symbol list of 100 chart and candlestick patterns (13 "investment grade" candle patterns) found in today's securities using my version of Patternz: MMM, AXDX, APD, ALB, ALKS, AME, AMN, AR, APA, ACGL, ADM, ANET, ARW, AGO, BMI, BSET, BIO, BFH, BMY, CPB, CX, CNC, CDAY, CI, CLNE, CLF, CL, DHR, XRAY, DDS, ELV, EME, EVH, EXC, EZPW, GME, GL, GPRO, THG, HLIT, HUM, NSP, PODD, IBKR, IRM, KALU, KBH, KFRC, LEG, LDOS, L, MGY, MRTN, MTDR, MTRN, MUR, NWL, NKE, NUS, NTNX, PDCO, PCTY, PYPL, PETS, PCG, RHI, SBH, SAIC, SEIC, SCI, NOW, SKYW, SXI, SSYS, TECH, TZOO, TG, WERN, WMB, FXI, IYH, IHF, EWK, EWQ, EWH, EWM, EWP, TUR, PBE, XLP, XLV. Click this link for details (pattern type, start and end dates).
For a list of small patterns (those a few days wide) click this link.
$ $ $
The following table shows where Fibonacci retrace values of the day's high-low range are plus pivot points, calculated on the Nasdaq composite, sorted by value. When several are near each other (small differences), the area might act as support or resistance.
-- Thomas Bulkowski
![]()
| © 2024 ThePatternSite.com Metric | Value | Diff | Close (within 10% of the high-low range for the day)? |
| Monthly S2 | 15,981.57 | ||
| Monthly S1 | 16,953.35 | 971.77 | |
| Weekly S2 | 17,574.65 | 621.31 | |
| Monthly Pivot | 17,640.34 | 65.69 | |
| Daily S2 | 17,679.71 | 39.37 | |
| Weekly S1 | 17,749.89 | 70.17 | |
| Low | 17,767.79 | 17.90 | Yes! The Low is close to the Weekly S1. |
| Daily S1 | 17,802.42 | 34.63 | |
| 61.8% Down from Intraday High | 17,848.31 | 45.89 | |
| Open | 17,867.12 | 18.81 | Yes! The Open is close to the 61.8% Down from Intraday High. |
| 50% Down from Intraday High | 17,873.18 | 6.06 | Yes! The 50% Down from Intraday High is close to the Open. |
| Daily Pivot | 17,890.49 | 17.31 | Yes! The Daily Pivot is close to the 50% Down from Intraday High. |
| 38.2% Down from Intraday High | 17,898.05 | 7.56 | Yes! The 38.2% Down from Intraday High is close to the Daily Pivot. |
| Close | 17,925.12 | 27.07 | |
| High | 17,978.57 | 53.45 | |
| Daily R1 | 18,013.20 | 34.63 | |
| Weekly Pivot | 18,038.61 | 25.42 | |
| Daily R2 | 18,101.27 | 62.66 | |
| Weekly R1 | 18,213.85 | 112.57 | |
| Weekly R2 | 18,502.57 | 288.73 | |
| Monthly R1 | 18,612.12 | 109.54 | |
| Monthly R2 | 19,299.11 | 687.00 |
Here's the updated 2024 market forecast, presented in slider format.
$ $ $
Here's a symbol list of 159 chart and candlestick patterns (13 "investment grade" candle patterns) found in today's securities using my version of Patternz: AXDX, AYI, AMD, AES, ALKS, AEE, AXP, AME, AMN, ANIK, AON, APA, AMAT, ACGL, ADM, AWI, ATO, BCPC, BAX, BIO, BIIB, BMRN, BKNG, BMY, BG, CPB, CX, CNC, CLNE, ED, COP, CTS, DHR, XRAY, DFS, ^DJU, DTE, EBAY, ECL, EPAM, EFX, EG, EVH, XOM, FICO, FARO, FDX, FIVN, FTV, GME, GD, GFS, HLIT, HTLD, HP, HON, HUN, IDA, NSP, PODD, IBKR, JAZZ, KBH, KLAC, RAMP, MGY, MANH, MRO, MTDR, MRCY, MU, MCO, MOS, MUR, NFLX, NWL, NEU, NUS, NTNX, NVDA, OMI, PAYX, PYPL, PETS, PPL, PINC, QTWO, RMBS, RHI, RCKY, ROG, ROP, RES, SLB, SIGI, SRE, NOW, SXI, SSYS, TECH, TEVA, TTD, TOL, TDG, RIG, TG, UHAL, UNH, VLO, VECO, WU, WPM, WSC, XEL, IYM, IAI, IEZ, FDN, QTEC, FXL, BOTZ, IEV, IGV, IXN, IEO, IHI, EWK, EWZ, EWQ, EWI, EWY, EWD, EWL, EWT, TUR, EWU, DBA, PXJ, PJP, USO, SMH, VHT, VAW, VONG. Click this link for details (pattern type, start and end dates).
For a list of small patterns (those a few days wide) click this link.
-- Thomas Bulkowski
![]()
$ $ $
I show another slider trading quiz featuring Xcel Energy: XEL stock.
$ $ $
Here's a symbol list of 98 chart and candlestick patterns (13 "investment grade" candle patterns) found in today's securities using my version of Patternz: ACIW, AYI, AEIS, AEE, AFG, AON, AAPL, ADM, AIZ, ATO, ADSK, AXS, BAX, BBY, BIO, BMRN, BRC, BFH, BR, BBW, CPB, CIEN, CSCO, CNO, CMCO, CMTL, CCK, CW, DTE, DUK, EME, FORM, GIS, GPRO, GFF, HE, HSII, HNI, HON, HWM, IBKR, JBLU, KLIC, LZB, RAMP, MAS, MLI, NFLX, NEU, NOC, NOVT, NTNX, ASGN, PEN, PFE, PPL, PINC, PRU, QTWO, REGN, ^GSPC, SBH, SIGI, SLGN, SCS, SSYS, TDOC, TER, TEVA, TTD, VC, WRB, WSC, XEL, ZBRA, IHE, IGV, IYF, EWO, EWZ, ECH, EWH, EWJ, EWP, EWD, IBB, PEJ, PJP, SSO, XLI, SPY, VHT. Click this link for details (pattern type, start and end dates).
For a list of small patterns (those a few days wide) click this link.
$ $ $
The following table shows where Fibonacci retrace values of the day's high-low range are plus pivot points, calculated on the Dow industrials, sorted by value. When several are near each other (small differences), the area might act as support or resistance.
-- Thomas Bulkowski
![]()
| © 2024 ThePatternSite.com Metric | Value | Diff | Close (within 10% of the high-low range for the day)? |
| Monthly S2 | 39,015.26 | ||
| Monthly S1 | 40,672.71 | 1,657.45 | |
| Weekly S2 | 41,504.14 | 831.44 | |
| Monthly Pivot | 41,650.51 | 146.37 | |
| Daily S2 | 41,783.70 | 133.19 | |
| Weekly S1 | 41,917.15 | 133.45 | |
| Low | 41,929.07 | 11.92 | Yes! The Low is close to the Weekly S1. |
| Daily S1 | 42,056.93 | 127.86 | |
| 61.8% Down from Intraday High | 42,088.97 | 32.05 | Yes! The 61.8% Down from Intraday High is close to the Daily S1. |
| 50% Down from Intraday High | 42,138.36 | 49.39 | |
| 38.2% Down from Intraday High | 42,187.76 | 49.39 | |
| Daily Pivot | 42,202.29 | 14.54 | Yes! The Daily Pivot is close to the 38.2% Down from Intraday High. |
| Weekly Pivot | 42,272.73 | 70.44 | |
| Open | 42,289.75 | 17.02 | Yes! The Open is close to the Weekly Pivot. |
| Close | 42,330.15 | 40.40 | Yes! The Close is close to the Open. |
| High | 42,347.66 | 17.51 | Yes! The High is close to the Close. |
| Daily R1 | 42,475.52 | 127.86 | |
| Daily R2 | 42,620.88 | 145.37 | |
| Weekly R1 | 42,685.74 | 64.86 | |
| Weekly R2 | 43,041.32 | 355.59 | |
| Monthly R1 | 43,307.96 | 266.63 | |
| Monthly R2 | 44,285.76 | 977.80 |
Support this site! Clicking any of the books (below) takes you to
Amazon.com If you buy ANYTHING while there, they pay for the referral.
Legal notice for paid links: "As an Amazon Associate I earn from qualifying purchases."
|
My Stock Market Books
|
My Novels
Orb Foresight Rewrite Coming!
|