
As of 05/04/2026
Indus: 48,942 -557.37 -1.1%
Trans: 19,606 -992.51 -4.8%
Utils: 1,153 -4.13 -0.4%
Nasdaq: 25,068 -46.64 -0.2%
S&P 500: 7,201 -29.37 -0.4%
|
YTD
+1.8%
+13.0%
+7.9%
+7.9%
+5.2%
|
|
As of 05/04/2026
Indus: 48,942 -557.37 -1.1%
Trans: 19,606 -992.51 -4.8%
Utils: 1,153 -4.13 -0.4%
Nasdaq: 25,068 -46.64 -0.2%
S&P 500: 7,201 -29.37 -0.4%
|
YTD
+1.8%
+13.0%
+7.9%
+7.9%
+5.2%
| |
|
| ||
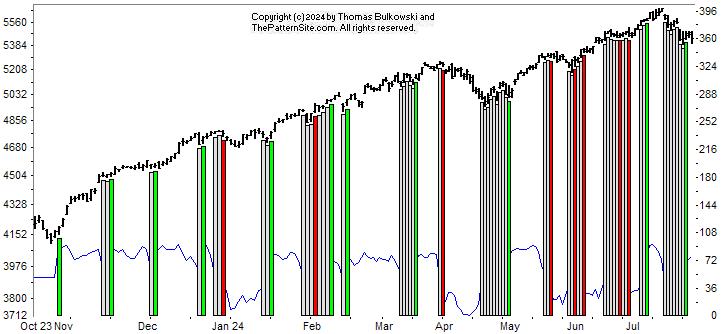
This is a picture of the chart pattern indicator on the daily scale. The indicator is the line chart below a chart of the S&P 500 composite.
The latest reading of the CPI is bullish as the vertical green bar on the far right of the chart shows. Before that, the indicator was in neutral territory for about two weeks even as the index dropped.
There's not much else to say about this chart other than it's bullish (at least for now. The indicator can change its mind for up to a week).
I drew a tall vertical red line to show were the CPI peaked compared to the index. According to this chart, you had about a week's warning before the index turned down.
Circled is what's called a failure swing. The indicator bottoms and then makes a higher bottom, suggesting a bullish turn coming.
There are a number of them on this chart. The easiest one to spot is in January 2024, right above the label. I circled it in green for your viewing pleasure. ![]()
After the index bottomed, the uptrend resumed (in the index).
What does all of this mean? I think the retrace is about over. Look for the index to resume its climb.
$ $ $
Here's a symbol list of 147 chart and candlestick patterns (13 "investment grade" candle patterns) found in today's securities using my version of Patternz: ACIW, AYI, ALRM, ALK, AA, DOX, AXP, AFG, AMWD, ANIK, AON, ADM, AWI, ASH, AVA, BMI, BIO, BKH, BOOT, BAH, BSX, BRC, BCO, BLDR, BG, CALM, CLS, COR, CNC, CF, CRL, CHKP, CVX, CINF, CLNE, CNO, CNX, CGNX, ED, CONN, CXW, GLW, CR, CTS, CMI, DFS, DOV, DRQ, EXP, EIX, ELV, EMR, EVH, EXPI, FFIV, FARO, FLS, FDP, GME, IT, GNW, GPRO, GFF, HLIT, HIG, HE, HQY, HSII, HP, HSIC, HSY, HWM, IDA, INCY, TILE, JNJ, KFRC, KMB, LHX, LANC, LDOS, MANH, MLM, MA, MTRN, MGEE, MOS, NOC, NOVT, NUS, NTNX, OGE, ASGN, OR, OMI, PTEN, PCG, PPL, PINC, PSTG, RMBS, RJF, RGA, RNG, RES, SAIA, SLB, SCHW, SMTC, SCI, NOW, SCCO, TDC, VFC, VECO, VEEV, MDRX, VRSN, VC, VMC, WSC, WOLF, ZBRA, IYE, IHE, IXC, IXN, IGE, IEO, IHI, EIS, EWP, XLE, XLF, GLD, VONG. Click this link for details (pattern type, start and end dates).
For a list of small patterns (those a few days wide) click this link.
-- Thomas Bulkowski, author: Invest for Two-Comma Wealth (#Ad)
![]()
$ $ $
I show another slider trading quiz featuring extended V-tops chart pattern.
$ $ $
Here's a symbol list of 117 chart and candlestick patterns (13 "investment grade" candle patterns) found in today's securities using my version of Patternz: DDD, ALRM, ALK, ALKS, AMWD, ANIK, AR, AGO, AVA, BKH, BFH, BCO, CAL, CLS, CX, COR, CVX, CNX, CL, CXW, DVN, FANG, EXP, ECL, EOG, EQT, EVRG, EXPI, EXPD, FAST, FDX, FISV, FDP, FRD, GNW, GL, GS, GFF, THG, HLIT, HQY, HSII, JBHT, INFN, NSP, INTC, TILE, IPI, JBLU, KEYS, KFRC, KLIC, LPLA, MTSI, MRO, MUR, JWN, NOC, OTEX, ORCL, PANW, PKE, PINC, QCOM, RMBS, RNG, RLI, RCKY, ROST, SAIA, SBH, SEE, SIGI, NOW, STR, SWX, SR, TECH, TER, VLO, MDRX, VC, ZBRA, IAI, IYE, IHE, FXI, BOTZ, IAT, IGV, IXC, IGE, IEO, EWO, EWC, ECH, EWG, EWI, EWS, EWT, TUR, EWU, DBA, PXJ, ROBO, XLE, XLB, VAW. Click this link for details (pattern type, start and end dates).
For a list of small patterns (those a few days wide) click this link.
$ $ $
The following table shows where Fibonacci retrace values of the day's high-low range are plus pivot points, calculated on the Dow industrials, sorted by value. When several are near each other (small differences), the area might act as support or resistance.
-- Thomas Bulkowski, author: Invest for Two-Comma Wealth (#Ad)
![]()
| © 2024 ThePatternSite.com Metric | Value | Diff | Close (within 10% of the high-low range for the day)? |
| Monthly S2 | 37,807.96 | ||
| Monthly S1 | 39,173.95 | 1,365.98 | |
| Weekly S2 | 39,420.69 | 246.75 | |
| Weekly S1 | 39,980.31 | 559.62 | |
| Daily S2 | 40,243.42 | 263.11 | |
| Monthly Pivot | 40,274.97 | 31.55 | |
| Weekly Pivot | 40,367.07 | 92.10 | |
| Low | 40,388.83 | 21.76 | Yes! The Low is close to the Weekly Pivot. |
| Daily S1 | 40,391.68 | 2.85 | Yes! The Daily S1 is close to the Low. |
| 61.8% Down from Intraday High | 40,501.01 | 109.33 | |
| 50% Down from Intraday High | 40,535.66 | 34.65 | |
| Daily Pivot | 40,537.08 | 1.42 | Yes! The Daily Pivot is close to the 50% Down from Intraday High. |
| Close | 40,539.93 | 2.85 | Yes! The Close is close to the Daily Pivot. |
| 38.2% Down from Intraday High | 40,570.31 | 30.38 | |
| Open | 40,665.71 | 95.40 | |
| High | 40,682.49 | 16.78 | Yes! The High is close to the Open. |
| Daily R1 | 40,685.34 | 2.85 | Yes! The Daily R1 is close to the High. |
| Daily R2 | 40,830.74 | 145.41 | |
| Weekly R1 | 40,926.69 | 95.95 | |
| Weekly R2 | 41,313.45 | 386.76 | |
| Monthly R1 | 41,640.96 | 327.51 | |
| Monthly R2 | 42,741.98 | 1,101.03 |
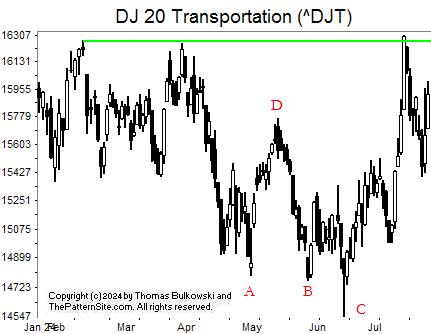
I show the Dow transports on the daily scale.
At AB, a potential double bottom appears. Price has to close above the highest peak between the two bottoms (D) before it confirms as a valid chart pattern. Without confirmation, it's just squiggles on the price chart.
In this case, it's not a double bottom because the index drops below B at C.
I drew a line of overhead resistance in green connecting price peaks. Will price pierce this line of resistance? I don't have an answer to that. Elliott wavers may claim that it's wave 5 of an uptrend, so there's a risk of reversal.
We'll have to see how this all plays out.
![]()
The following is a brief review of how the markets performed over time. The numbers refer to the close-to-close move in the Dow industrials.
No options expire this week.
![]()
The following is based on an SFO article in December 2004 by John Seekinger, titled, "Take a two-dimensional approach." He offers these tips.
| Index | S2 | S1 | Pivot | R1 | R2 |
| Dow Industrials (^DJI): Daily | 39,882 | 40,236 | 40,495 | 40,848 | 41,108 |
| Weekly | 39,437 | 40,013 | 40,384 | 40,960 | 41,330 |
| Monthly | 37,824 | 39,207 | 40,291 | 41,674 | 42,758 |
| S&P500 (^GSPC): Daily | 5,402 | 5,430 | 5,459 | 5,488 | 5,517 |
| Weekly | 5,284 | 5,372 | 5,478 | 5,566 | 5,673 |
| Monthly | 5,228 | 5,343 | 5,507 | 5,622 | 5,785 |
| Nasdaq (^IXIC): Daily | 17,136 | 17,247 | 17,351 | 17,462 | 17,565 |
| Weekly | 16,412 | 16,885 | 17,507 | 17,980 | 18,601 |
| Monthly | 16,051 | 16,704 | 17,688 | 18,341 | 19,325 |
Here are the formulas:
![]()
Earnings season is either underway or should be starting soon. The sessions could be more volatile.
Here's a symbol list of 100 chart and candlestick patterns (13 "investment grade" candle patterns) found in today's securities using my version of Patternz: DDD, AFL, ALRM, ALB, ALKS, AMWD, ANIK, AON, APOG, AVA, BMI, BMRN, BKH, BAH, BMY, CPB, CX, CNC, CINF, CLNE, CL, CMTL, CONN, COP, CROX, EMN, EPAM, EVRG, FICO, FIS, FISV, FMC, FTNT, FRD, GNW, GMS, GFF, THG, HIG, HSII, HOLX, ITW, INCY, IBP, IIIN, ITGR, INTC, TILE, JBLU, JNJ, KALU, KLIC, LEG, LDOS, LLY, LPLA, MTSI, MTDR, META, MOS, MYGN, NOV, NWL, JWN, NWPX, ORI, OLN, PKE, PGR, PHM, RL, RMBS, RTX, RGA, ROL, ROST, SAIA, SKYW, TRGP, TER, UPS, VEEV, VC, WRB, WPM, ZBRA, IYM, IYE, IEZ, BOTZ, IYH, IXC, IEO, ECH, PHO, XLV, UNG. Click this link for details (pattern type, start and end dates).
For a list of small patterns (those a few days wide) click this link.
The below industries were the best (rank 1) or worst performing of those I follow.
|
-- Thomas Bulkowski, author: Invest for Two-Comma Wealth and the novel (fiction), Training "Miles" (#Ad)
![]()
$ $ $
Here's a symbol list of 167 chart and candlestick patterns (13 "investment grade" candle patterns) found in today's securities using my version of Patternz: DDD, ACN, AMD, AES, ALK, ALKS, ALGT, AMWD, APH, AON, AMAT, ACGL, ASH, ATO, AVA, AXS, AZTA, BMI, BSET, BBY, BMRN, BKH, BKNG, BSX, BRKR, CBT, CX, CNP, CHD, CLNE, CCK, DOV, DUK, EMN, EBAY, ECL, EIX, EME, EVRG, FIS, FISV, FTV, GPS, GNW, GILD, GFS, GL, GS, GOOGL, GPRO, GES, HBI, THG, HE, HAYN, HOLX, INCY, INTC, IBKR, TILE, INTU, KELYA, KMB, KLIC, LRCX, LLY, LXU, MTSI, MANH, MCHX, MTDR, META, MSFT, MYGN, ^IXIC, NOV, NFLX, JWN, NOC, NWPX, NVDA, ASGN, OR, PKE, PATK, PTEN, PYPL, QCOM, RTX, RHI, ROP, ROST, ^GSPC, SAND, SEE, SRE, SMTC, NOW, SO, SRDX, TER, TSCO, TZOO, UNM, VMI, VECO, VEEV, MDRX, WMT, WLK, WPM, WDAY, XEL, ZBRA, IYK, IYC, FTEC, FDN, QTEC, FXL, FXI, BOTZ, QQQ, IHF, IAT, IXN, ILF, SOXX, SLV, EWK, ECH, EWH, EIS, EWI, EWJ, EWM, EWW, EWP, EWT, TUR, QLD, PJP, SSO, ROBO, XLY, GLD, SPY, XLK, XLU, UNG, SMH, MGK, VONG. Click this link for details (pattern type, start and end dates).
For a list of small patterns (those a few days wide) click this link.
$ $ $
You can find setups based on a Fibonacci retrace by clicking on the link.
The following patterns were found manually, not using Patternz. Mr. Bulkowski has excluded any securities he owns from appearing in the list. However, he may add any of the securities listed to his portfolio at any time, just as you can.
In the table below, the red and green colors are based on the historical breakout direction for the associated chart pattern. If a high and tight flag appears, the start and end dates highlight the flagpole only and not the flag.
For details about the chart patterns, click here.
-- Thomas Bulkowski, author: Invest for Two-Comma Wealth (#Ad)
![]()
| Symbol | Chart Pattern | Bullish Bearish | Start | End | Industry |
| ALKS | Pipe bottom | 07/08/2024 | 07/15/2024 | Drug | |
| AEO | Head-and-shoulders bottom | 06/20/2024 | 07/19/2024 | Apparel | |
| APOG | Double Bottom, Adam and Adam | 06/25/2024 | 07/09/2024 | Building Materials | |
| ANET | Head-and-shoulders top | 06/20/2024 | 07/23/2024 | E-Commerce | |
| ADSK | Broadening top | 07/01/2024 | 07/24/2024 | Computer Software and Svcs | |
| AZTA | Double Bottom, Eve and Adam | 07/02/2024 | 07/10/2024 | Semiconductor Cap Equip. | |
| BALL | Double Bottom, Adam and Eve | 06/20/2024 | 07/09/2024 | Packaging and Container | |
| BOOT | Double Top, Eve and Adam | 06/20/2024 | 07/16/2024 | Shoe | |
| CAL | Double Bottom, Eve and Eve | 06/10/2024 | 07/05/2024 | Shoe | |
| CENX | Double Top, Adam and Adam | 07/03/2024 | 07/17/2024 | Metals and Mining (Div.) | |
| COST | Pipe top | 07/01/2024 | 07/08/2024 | Retail Store | |
| CSGS | Triangle, symmetrical | 05/30/2024 | 07/10/2024 | IT Services | |
| CMI | Double Bottom, Adam and Eve | 06/14/2024 | 07/05/2024 | Machinery | |
| DDS | Triple top | 04/01/2024 | 07/12/2024 | Retail Store | |
| EME | Double Top, Adam and Adam | 07/16/2024 | 07/25/2024 | Industrial Services | |
| EXPD | Double Bottom, Adam and Adam | 07/09/2024 | 07/15/2024 | Air Transport | |
| HBI | Double Bottom, Adam and Eve | 06/20/2024 | 07/10/2024 | Apparel | |
| HOV | Double Bottom, Eve and Eve | 05/29/2024 | 07/01/2024 | Homebuilding | |
| HWM | Double Bottom, Eve and Eve | 06/28/2024 | 07/18/2024 | Aerospace/Defense | |
| INTC | Pipe top | 07/08/2024 | 07/15/2024 | Semiconductor | |
| KLIC | Pipe top | 07/08/2024 | 07/15/2024 | Semiconductor Cap Equip. | |
| MTRX | Pipe bottom | 07/01/2024 | 07/08/2024 | Oilfield Svcs/Equipment | |
| JWN | Pipe top | 07/08/2024 | 07/15/2024 | Retail Store | |
| POR | Head-and-shoulders bottom | 06/14/2024 | 07/05/2024 | Electric Utility (West) | |
| RRC | Triple top | 06/24/2024 | 07/15/2024 | Petroleum (Producing) | |
| ROL | Double Top, Adam and Adam | 07/08/2024 | 07/23/2024 | Industrial Services | |
| ROST | Double Top, Eve and Adam | 06/17/2024 | 07/12/2024 | Retail (Special Lines) | |
| RES | Double Bottom, Eve and Eve | 07/10/2024 | 07/24/2024 | Oilfield Svcs/Equipment | |
| NOW | Triple bottom | 07/10/2024 | 07/24/2024 | IT Services | |
| SHOP | Triple top | 06/14/2024 | 07/16/2024 | E-Commerce | |
| TER | Pipe top | 07/08/2024 | 07/15/2024 | Semiconductor Cap Equip. | |
| TTD | Triple top | 07/10/2024 | 07/23/2024 | Advertising | |
| TMO | Double Bottom, Adam and Adam | 07/09/2024 | 07/19/2024 | Precision Instrument | |
| VFC | Pennant | 07/18/2024 | 07/25/2024 | Apparel | |
| WERN | Ugly double bottom | 07/09/2024 | 07/22/2024 | Trucking/Transp. Leasing | |
| WWW | Double Bottom, Adam and Eve | 06/17/2024 | 07/10/2024 | Shoe |
![]()
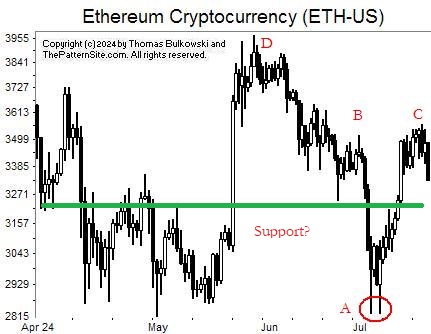
I show a picture of the cryptocurrency Ethereum (ETH-USD) on the daily scale.
At A, we see what looks like a horn bottom (but it looks as if there is more than one price bar between the two spikes) or a narrow double bottom. Regardless of what you call it, the currency made a quick rise to C.
Because B and C are at nearly the same price, you might conclude that this is a chart pattern called a double top. Actually, it's not. The currency has to close below the lowest valley between the two peaks (below A) before it becomes valid.
Also, the drop from D to B makes the pattern look more like a bottom than a top.
So what's next for ETH? My guess, and it's only a guess, is that the currency will drop a bit more before finding support and rising. I drew a horizontal green line where I think the currency might reverse.
$ $ $
Here's a symbol list of 152 chart and candlestick patterns (13 "investment grade" candle patterns) found in today's securities using my version of Patternz: AES, ALKS, AEE, AFG, AMWD, APH, AMAT, ATR, ASH, AVY, AVA, AXS, BMI, BSET, BERY, BBY, BKH, BKNG, BOOT, BCO, BMY, BR, CACI, CX, CINF, CTAS, CLF, CONN, DFS, ^DJI, DOV, BOOM, ECL, FDX, FE, FISV, FLEX, FTV, FNV, FCX, GNW, GFS, GL, THG, HTLD, HL, HON, IEX, ITGR, INTC, KALU, KLIC, LHX, LRCX, LDOS, L, LOW, MANH, MAN, MKTX, MRTN, MA, MGEE, MYGN, NOV, JWN, NWPX, NUS, ORI, OMC, ASGN, OR, PKE, PTEN, PEN, PNW, KWR, RGA, ROST, SCHW, NOW, SHOP, SMAR, SRDX, TPR, TGT, TDY, TER, TSCO, TDG, SLCA, UNM, MDRX, V, WPM, XEL, ZBRA, IYM, IHE, DDM, FDN, QTEC, BOTZ, MXI, IXN, ILF, SOXX, SLV, IHI, EWA, EWZ, ECH, EEM, EWQ, EWH, EIS, EWJ, EPP, EWS, EZA, EWP, EWD, EWT, THD, PEJ, PXJ, PJP, ROBO, GLD, XLB, SMH, VONG. Click this link for details (pattern type, start and end dates).
For a list of small patterns (those a few days wide) click this link.
$ $ $
The following table shows where Fibonacci retrace values of the day's high-low range are plus pivot points, calculated on the Nasdaq composite, sorted by value. When several are near each other (small differences), the area might act as support or resistance.
-- Thomas Bulkowski, author: Invest for Two-Comma Wealth (#Ad)
![]()
| © 2024 ThePatternSite.com Metric | Value | Diff | Close (within 10% of the high-low range for the day)? |
| Monthly S2 | 16,658.78 | ||
| Weekly S2 | 16,941.69 | 282.91 | |
| Monthly S1 | 17,000.60 | 58.91 | |
| Daily S2 | 17,034.12 | 33.53 | Yes! The Daily S2 is close to the Monthly S1. |
| Weekly S1 | 17,142.05 | 107.93 | |
| Daily S1 | 17,188.27 | 46.21 | |
| Low | 17,313.52 | 125.25 | |
| Close | 17,342.41 | 28.89 | Yes! The Close is close to the Low. |
| Daily Pivot | 17,467.66 | 125.25 | |
| 61.8% Down from Intraday High | 17,479.13 | 11.47 | Yes! The 61.8% Down from Intraday High is close to the Daily Pivot. |
| 50% Down from Intraday High | 17,530.29 | 51.16 | |
| 38.2% Down from Intraday High | 17,581.45 | 51.16 | |
| Daily R1 | 17,621.81 | 40.36 | Yes! The Daily R1 is close to the 38.2% Down from Intraday High. |
| Open | 17,733.91 | 112.10 | |
| High | 17,747.06 | 13.15 | Yes! The High is close to the Open. |
| Monthly Pivot | 17,835.83 | 88.77 | |
| Weekly Pivot | 17,891.79 | 55.96 | |
| Daily R2 | 17,901.20 | 9.41 | Yes! The Daily R2 is close to the Weekly Pivot. |
| Weekly R1 | 18,092.15 | 190.95 | |
| Monthly R1 | 18,177.65 | 85.50 | |
| Weekly R2 | 18,841.89 | 664.24 | |
| Monthly R2 | 19,012.88 | 170.99 |
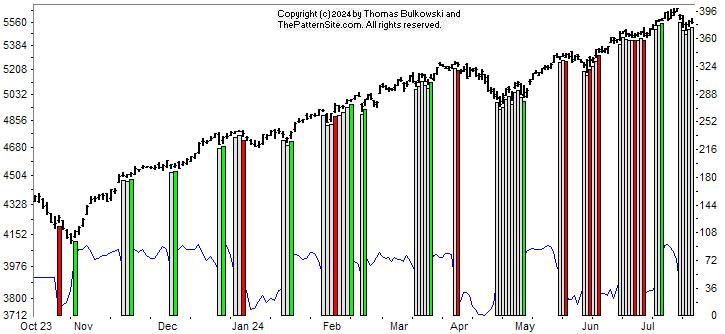
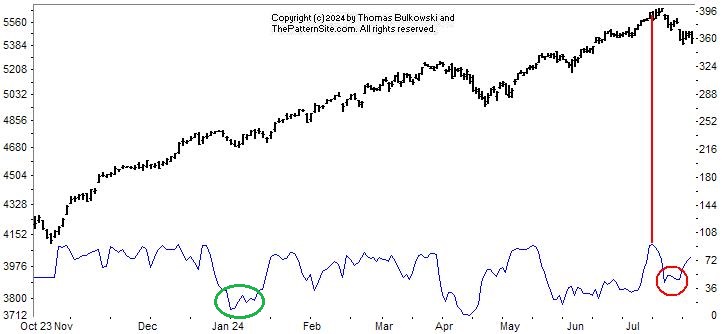
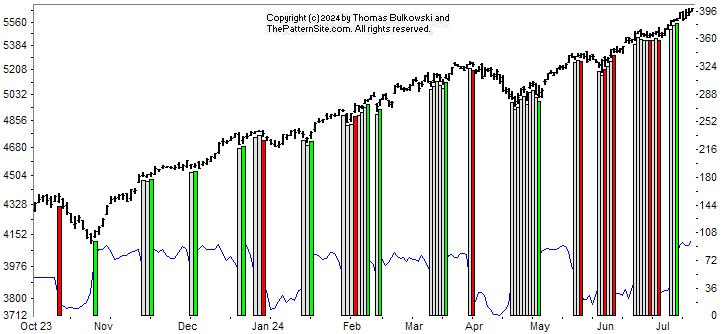
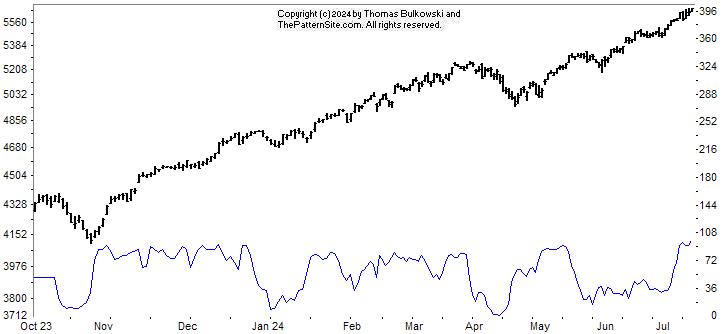
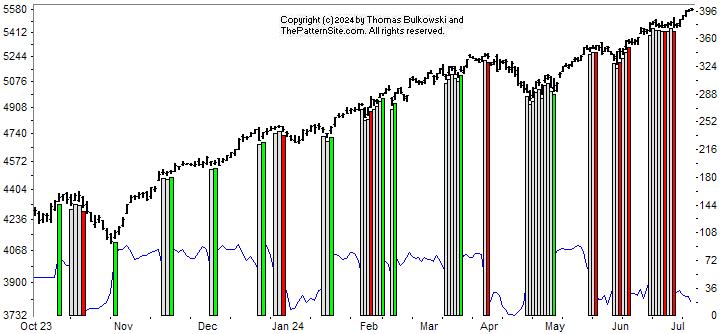
This is a picture of the chart pattern indicator on the daily scale. The indicator is the line chart below a chart of the S&P 500 composite.
In this chart, you can't see much of the underlying CPI line. We'll see the line in the next chart.
What we can see is that the CPI has turned neutral. That's clear by the chart showing white bars on the far right of the chart.
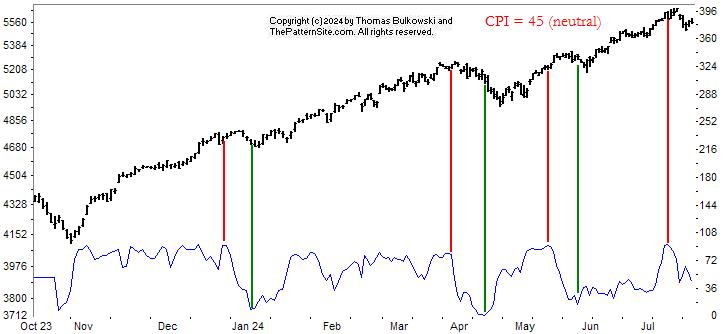
Here we see the CPI line (the thin blue line near the bottom of the chart), pegged at 45 (almost midrange from 0 to 100).
I drew vertical red and green lines to match the high to low swings in the CPI. Notice the width of the three red-green pairs. They are about the same, aren't they?
If the trend continues-and there's no reason to suspect that it will and no reason to suspect that it won't-but if the trend continues then we have a few more days of retracing before the index resumes rising.
Also notice that after the red line the index doesn't drop much before the green line appears.
$ $ $
Here's a symbol list of 98 chart and candlestick patterns (13 "investment grade" candle patterns) found in today's securities using my version of Patternz: ACIW, A, ATSG, ALKS, AEP, AMWD, APOG, ARCB, BMI, BKH, BCO, BRKR, CX, CRL, CVX, CHD, CTAS, ED, COP, CW, DVN, ^DJI, ECL, EOG, FNV, GE, GNW, THG, HOLX, JBHT, IEX, IDXX, ILMN, ITGR, INTC, IPAR, JNJ, KLIC, LH, RAMP, LMT, LOW, LXU, MRO, MKTX, MRTN, MA, MGEE, MUR, MYGN, NEU, JWN, NTNX, ORCL, PKE, PFE, POR, RGA, ROK, RCKY, ROST, SAIC, SMTC, NOW, SMAR, TDY, TER, RIG, TG, WAT, WERN, WSM, WDAY, XEL, ZBRA, IDU, DDM, BOTZ, IYH, IYZ, ILF, EWZ, ECH, EEM, EWH, EIS, EWD, THD, PBE, XLY. Click this link for details (pattern type, start and end dates).
For a list of small patterns (those a few days wide) click this link.
-- Thomas Bulkowski, author: Invest for Two-Comma Wealth (#Ad)
![]()
$ $ $
I show another slider trading quiz featuring extended V-bottoms chart pattern.
$ $ $
Here's a symbol list of 133 chart and candlestick patterns (13 "investment grade" candle patterns) found in today's securities using my version of Patternz: AXDX, ADBE, AA, AEP, AMWD, AMN, APOG, AMAT, ARCB, AIZ, AVY, AZTA, BMI, BIG, BKH, BKNG, BRC, BCO, CBT, CACI, CPB, CE, CVX, CHD, CI, CLNE, CMCO, CMTL, ED, COP, COST, CCK, CTS, DECK, DVN, DSGR, EMN, ECL, EOG, EXPI, FIVN, FMC, FNV, FDP, GPS, GNW, GILD, GFS, THG, HE, HP, HNI, HUN, IEX, INCY, ISRG, K, KLAC, KLIC, LRCX, MRO, MCHX, MKTX, MTRX, MDT, META, MLKN, MOS, MYGN, NUS, NTNX, OLN, ON, OMI, PKE, PDCO, PTEN, PFE, PCG, PNW, PINC, PG, PHM, KWR, QCOM, RMBS, RES, SKX, SKYW, SMAR, SPSC, TRGP, TEVA, TXN, TMO, RIG, UNM, VFC, VMI, VECO, VC, WLK, WMB, WSC, WWW, XEL, ZBRA, IYM, SOXX, SLV, IHI, EEM, EWM, EWY, EWP, EWT, THD, TUR, EWU, PPA, DBA, PJP, UNG, SMH. Click this link for details (pattern type, start and end dates).
For a list of small patterns (those a few days wide) click this link.
$ $ $
The following table shows where Fibonacci retrace values of the day's high-low range are plus pivot points, calculated on the Dow industrials, sorted by value. When several are near each other (small differences), the area might act as support or resistance.
-- Thomas Bulkowski, author: Invest for Two-Comma Wealth (#Ad)
![]()
| © 2024 ThePatternSite.com Metric | Value | Diff | Close (within 10% of the high-low range for the day)? |
| Monthly S2 | 37,130.41 | ||
| Monthly S1 | 38,772.93 | 1,642.51 | |
| Weekly S2 | 39,402.61 | 629.69 | |
| Weekly S1 | 39,909.03 | 506.41 | |
| Monthly Pivot | 40,074.46 | 165.44 | |
| Daily S2 | 40,120.49 | 46.02 | |
| Low | 40,222.77 | 102.28 | |
| Daily S1 | 40,267.96 | 45.20 | |
| 61.8% Down from Intraday High | 40,318.18 | 50.21 | |
| 50% Down from Intraday High | 40,347.65 | 29.47 | |
| Daily Pivot | 40,370.25 | 22.60 | Yes! The Daily Pivot is close to the 50% Down from Intraday High. |
| 38.2% Down from Intraday High | 40,377.12 | 6.88 | Yes! The 38.2% Down from Intraday High is close to the Daily Pivot. |
| Open | 40,414.49 | 37.37 | |
| Close | 40,415.44 | 0.95 | Yes! The Close is close to the Open. |
| High | 40,472.53 | 57.09 | |
| Daily R1 | 40,517.72 | 45.19 | |
| Daily R2 | 40,620.01 | 102.29 | |
| Weekly Pivot | 40,642.51 | 22.50 | Yes! The Weekly Pivot is close to the Daily R2. |
| Weekly R1 | 41,148.93 | 506.41 | |
| Monthly R1 | 41,716.98 | 568.05 | |
| Weekly R2 | 41,882.41 | 165.44 | |
| Monthly R2 | 43,018.51 | 1,136.10 |
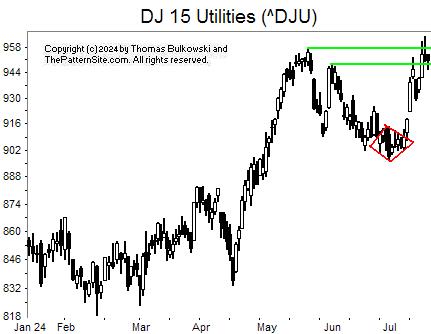
I show the Dow utilities on the daily scale.
Outlined in red is a nicely shaped diamond bottom. The upward breakout from this chart pattern led to a nice gain.
The two green lines highlight resistance to the upward move. Although the index pierced the lines, they closed below the top one. In short, you might see the index start a downward retrace here.
![]()
The following is a brief review of how the markets performed over time. The numbers refer to the close-to-close move in the Dow industrials.
No options expire this week.
![]()
The following is based on an SFO article in December 2004 by John Seekinger, titled, "Take a two-dimensional approach." He offers these tips.
| Index | S2 | S1 | Pivot | R1 | R2 |
| Dow Industrials (^DJI): Daily | 39,949 | 40,118 | 40,372 | 40,541 | 40,795 |
| Weekly | 39,360 | 39,824 | 40,600 | 41,064 | 41,840 |
| Monthly | 37,088 | 38,688 | 40,032 | 41,632 | 42,976 |
| S&P500 (^GSPC): Daily | 5,459 | 5,482 | 5,520 | 5,543 | 5,580 |
| Weekly | 5,385 | 5,445 | 5,557 | 5,617 | 5,730 |
| Monthly | 5,282 | 5,394 | 5,532 | 5,643 | 5,781 |
| Nasdaq (^IXIC): Daily | 17,541 | 17,634 | 17,785 | 17,878 | 18,028 |
| Weekly | 17,070 | 17,398 | 18,020 | 18,349 | 18,970 |
| Monthly | 16,787 | 17,257 | 17,964 | 18,434 | 19,141 |
Here are the formulas:
![]()
Earnings season is either underway or should be starting soon. The sessions could be more volatile.
Here's a symbol list of 161 chart and candlestick patterns (13 "investment grade" candle patterns) found in today's securities using my version of Patternz: DDD, AFL, APD, AKAM, AA, ALL, AEE, AEP, AFG, AIG, AMWD, AMN, APH, AON, APOG, ACGL, AIZ, AVY, BCPC, BALL, BAX, BZH, BKH, BAH, BSX, BCO, BBW, CBT, CACI, CPB, CVX, CI, CLNE, CLX, CNA, CMCO, CAG, COP, COST, CCK, CMI, FANG, DSGR, ^DJU, DTE, EIX, EOG, FTNT, FWRD, FNV, GPS, IT, GD, GIS, GILD, GPRO, THG, HLIT, HIG, HE, HAYN, HSY, HUN, IDXX, INCY, TILE, IPG, ISRG, JNJ, K, KSS, LHX, LH, LANC, LDOS, LEN, L, LXU, MRO, MCHX, MKTX, MLM, MAS, MTRX, MDT, MRCY, META, MOS, NBR, NFG, NI, NTNX, ORI, OLN, OMC, OMI, PKG, PANW, PTEN, PYPL, POR, PHM, KWR, RTX, RGS, RLI, ROK, SAIC, SKX, SRDX, TFX, TPX, TDC, TEVA, TXT, TSCO, VFC, VMI, WMB, WSC, XEL, ZBRA, FXI, IEV, ILF, SLV, IEO, EWZ, EEM, EWQ, EWG, EWI, EWS, EWY, EWD, EWT, EWU. Click this link for details (pattern type, start and end dates).
For a list of small patterns (those a few days wide) click this link.
The below industries were the best (rank 1) or worst performing of those I follow.
|
-- Thomas Bulkowski, author: Invest for Two-Comma Wealth and the novel (fiction), Training "Miles" (#Ad)
![]()
$ $ $
Here's a symbol list of 158 chart and candlestick patterns (13 "investment grade" candle patterns) found in today's securities using my version of Patternz: DDD, AMD, AKAM, ALGT, ALL, AMZN, AEP, AMGN, AMN, AON, APOG, AAPL, AMAT, ANET, AVY, BMI, BZH, BMRN, BKH, BKNG, BOOT, BCO, BBW, CBT, CDNS, CNC, CI, CTAS, CLNE, CMCO, CMTL, COST, CCK, CSGS, FANG, DSGR, ELV, EFX, XOM, FORM, FTNT, FWRD, FNV, FCX, GD, GNW, GILD, GPRO, HBI, THG, HLIT, DHI, HUN, INCY, IIIN, KLAC, LRCX, LAMR, LEN, LLY, LPLA, LXU, MANH, MCHX, MKTX, MTRX, META, MU, MSFT, MOS, NBR, ^IXIC, NWPX, NTNX, NVDA, OLN, ORCL, OMI, PTEN, PAYX, PG, PGR, PHM, PSTG, KWR, QCOM, ^GSPC, SCHW, SAIC, SKX, SMAR, SCS, SSYS, SRDX, SNPS, TPX, TDC, TEVA, TG, UNM, VFC, VMI, VECO, VEEV, WMB, WSC, XEL, ZBRA, FTEC, FDN, QTEC, FXL, BOTZ, QQQ, IEV, IGV, IXN, ILF, SOXX, IEO, EWO, EWK, ECH, EEM, EWQ, EWG, EIS, EWI, EWM, EZA, EWY, EWD, EWT, EWU, QLD, SSO, XLP, XLE, SPY, XLK, SMH, MGK, VONG. Click this link for details (pattern type, start and end dates).
For a list of small patterns (those a few days wide) click this link.
$ $ $
You can find setups based on a Fibonacci retrace by clicking on the link.
The following patterns were found manually, not using Patternz. Mr. Bulkowski has excluded any securities he owns from appearing in the list. However, he may add any of the securities listed to his portfolio at any time, just as you can.
In the table below, the red and green colors are based on the historical breakout direction for the associated chart pattern. If a high and tight flag appears, the start and end dates highlight the flagpole only and not the flag.
For details about the chart patterns, click here.
-- Thomas Bulkowski, author: Invest for Two-Comma Wealth (#Ad)
![]()
| Symbol | Chart Pattern | Bullish Bearish | Start | End | Industry |
| ANF | Horn top | 05/28/2024 | 06/10/2024 | Apparel | |
| ADTN | Triple bottom | 06/10/2024 | 06/27/2024 | Telecom. Equipment | |
| AEIS | Roof, inverted | 05/15/2024 | 07/10/2024 | Semiconductor | |
| AFL | Triple bottom | 06/26/2024 | 07/09/2024 | Insurance (Diversified) | |
| ALGT | Pipe bottom | 07/01/2024 | 07/08/2024 | Air Transport | |
| AMN | Pipe bottom | 07/01/2024 | 07/08/2024 | Human Resources | |
| APH | Double Top, Adam and Eve | 06/20/2024 | 07/12/2024 | Electronics | |
| ANIK | Double Bottom, Adam and Adam | 05/23/2024 | 06/07/2024 | Biotechnology | |
| APA | Head-and-shoulders bottom | 06/04/2024 | 07/08/2024 | Petroleum (Producing) | |
| ARCB | Double Bottom, Eve and Adam | 06/06/2024 | 07/09/2024 | Trucking/Transp. Leasing | |
| BMI | Cup with handle | 05/23/2024 | 07/16/2024 | Precision Instrument | |
| BCO | Pipe bottom | 06/10/2024 | 06/17/2024 | Industrial Services | |
| BMY | Double Bottom, Adam and Eve | 06/20/2024 | 07/05/2024 | Drug | |
| CBT | Pipe bottom | 07/01/2024 | 07/08/2024 | Chemical (Diversified) | |
| CVX | Double Bottom, Eve and Adam | 06/17/2024 | 07/10/2024 | Petroleum (Integrated) | |
| CI | Pipe bottom | 07/01/2024 | 07/08/2024 | Medical Services | |
| CSCO | Head-and-shoulders bottom | 05/29/2024 | 07/09/2024 | Computers and Peripherals | |
| CMCO | Pipe bottom | 07/01/2024 | 07/08/2024 | Machinery | |
| COP | Head-and-shoulders bottom | 06/07/2024 | 07/10/2024 | Petroleum (Integrated) | |
| COTY | Triple bottom | 06/11/2024 | 07/02/2024 | Toiletries/Cosmetics | |
| CRH | Diamond bottom | 06/25/2024 | 07/05/2024 | Cement and Aggregates | |
| CCK | Pipe bottom | 07/01/2024 | 07/08/2024 | Packaging and Container | |
| DVN | Double Bottom, Eve and Eve | 06/14/2024 | 07/11/2024 | Natural Gas (Diversified) | |
| DSGR | Pipe bottom | 07/01/2024 | 07/08/2024 | Metal Fabricating | |
| DOV | Double Bottom, Eve and Eve | 06/14/2024 | 07/05/2024 | Machinery | |
| ELV | Triple top | 06/13/2024 | 07/16/2024 | Medical Services | |
| EOG | Ugly double bottom | 06/14/2024 | 07/09/2024 | Natural Gas (Distributor) | |
| EFX | Triangle, symmetrical | 05/15/2024 | 07/10/2024 | Information Services | |
| EVH | Double Bottom, Adam and Adam | 07/01/2024 | 07/10/2024 | Healthcare Information | |
| XOM | Head-and-shoulders bottom | 06/04/2024 | 07/10/2024 | Petroleum (Integrated) | |
| FAST | Double Bottom, Adam and Eve | 06/14/2024 | 07/02/2024 | Retail Building Supply | |
| FIVN | Double Bottom, Eve and Adam | 06/26/2024 | 07/10/2024 | Computer Software and Svcs | |
| FLS | Double Bottom, Adam and Eve | 06/14/2024 | 07/09/2024 | Machinery | |
| FMC | Pipe bottom | 06/10/2024 | 06/17/2024 | Chemical (Basic) | |
| FDP | Double Bottom, Adam and Eve | 06/18/2024 | 07/09/2024 | Food Processing | |
| FRD | Double Bottom, Adam and Adam | 06/26/2024 | 07/09/2024 | Building Materials | |
| GME | Pipe bottom | 06/24/2024 | 07/01/2024 | Retail (Special Lines) | |
| GIS | Triple bottom | 06/26/2024 | 07/16/2024 | Food Processing | |
| GMS | Double Bottom, Adam and Eve | 06/20/2024 | 07/01/2024 | Cement and Aggregates | |
| GGG | Double Bottom, Adam and Adam | 07/01/2024 | 07/10/2024 | Machinery | |
| HELE | Dead-cat bounce | 07/09/2024 | 07/09/2024 | Toiletries/Cosmetics | |
| HSIC | Double Bottom, Adam and Adam | 06/27/2024 | 07/10/2024 | Medical Supplies | |
| HUN | Pipe bottom | 07/01/2024 | 07/08/2024 | Chemical (Specialty) | |
| IDA | Double Bottom, Eve and Adam | 06/17/2024 | 06/26/2024 | Electric Utility (West) | |
| IEX | Double Bottom, Adam and Eve | 06/14/2024 | 07/05/2024 | Machinery | |
| ITW | Double Bottom, Adam and Eve | 06/14/2024 | 07/01/2024 | Metal Fabricating | |
| INCY | Pipe bottom | 07/01/2024 | 07/08/2024 | Drug | |
| ITGR | Triple bottom | 06/26/2024 | 07/10/2024 | Electronics | |
| ISRG | Double Top, Eve and Eve | 07/01/2024 | 07/11/2024 | Medical Supplies | |
| JKHY | Double Bottom, Adam and Adam | 06/13/2024 | 07/10/2024 | IT Services | |
| K | Double Bottom, Eve and Adam | 07/09/2024 | 07/15/2024 | Food Processing | |
| KEYS | Triple bottom | 06/10/2024 | 07/01/2024 | Precision Instrument | |
| KFRC | Triple bottom | 04/30/2024 | 07/09/2024 | Human Resources | |
| LMT | Double Bottom, Eve and Eve | 06/14/2024 | 07/11/2024 | Aerospace/Defense | |
| L | Triple bottom | 05/29/2024 | 07/05/2024 | Insurance (Prop/Casualty) | |
| LOW | Double Bottom, Eve and Eve | 05/29/2024 | 07/02/2024 | Retail Building Supply | |
| MGY | Double Bottom, Adam and Adam | 05/08/2024 | 06/17/2024 | Petroleum (Producing) | |
| MRO | Head-and-shoulders bottom | 06/07/2024 | 07/10/2024 | Petroleum (Integrated) | |
| MTDR | Head-and-shoulders bottom | 06/04/2024 | 07/05/2024 | Petroleum (Producing) | |
| MTRN | Triple bottom | 06/20/2024 | 07/09/2024 | Metals and Mining (Div.) | |
| MDT | Head-and-shoulders bottom | 07/02/2024 | 07/16/2024 | Medical Supplies | |
| MRCY | Triple bottom | 05/08/2024 | 06/28/2024 | Computers and Peripherals | |
| META | Pipe top | 07/01/2024 | 07/08/2024 | E-Commerce | |
| MOS | Double Bottom, Adam and Adam | 06/17/2024 | 07/10/2024 | Chemical (Diversified) | |
| MUR | Pipe bottom | 06/10/2024 | 06/17/2024 | Petroleum (Integrated) | |
| NTGR | Double Bottom, Eve and Eve | 06/21/2024 | 07/05/2024 | Telecom. Equipment | |
| NJR | Triple bottom | 05/29/2024 | 07/09/2024 | Natural Gas (Distributor) | |
| NWPX | Triple bottom | 06/17/2024 | 07/10/2024 | Building Materials | |
| NOVT | Triple bottom | 07/01/2024 | 07/10/2024 | Precision Instrument | |
| NTNX | Pipe top | 07/01/2024 | 07/08/2024 | E-Commerce | |
| OLN | Pipe bottom | 07/01/2024 | 07/08/2024 | Chemical (Basic) | |
| OMC | Double Bottom, Eve and Eve | 06/13/2024 | 07/02/2024 | Advertising | |
| OMI | Pipe bottom | 07/01/2024 | 07/08/2024 | Medical Supplies | |
| OXM | Double Bottom, Adam and Adam | 06/13/2024 | 07/09/2024 | Apparel | |
| PATK | Pipe bottom | 06/10/2024 | 06/17/2024 | Retail Building Supply | |
| PEN | Double Bottom, Adam and Eve | 06/20/2024 | 06/26/2024 | Medical Supplies | |
| PFE | Triple bottom | 06/17/2024 | 07/09/2024 | Drug | |
| PHM | Pipe bottom | 07/01/2024 | 07/08/2024 | Homebuilding | |
| RJF | Head-and-shoulders top | 06/24/2024 | 07/12/2024 | Securities Brokerage | |
| RHI | Double Bottom, Adam and Adam | 06/10/2024 | 07/10/2024 | Human Resources | |
| R | Double Bottom, Adam and Adam | 06/14/2024 | 07/09/2024 | Trucking/Transp. Leasing | |
| SBH | Double Bottom, Eve and Adam | 06/20/2024 | 07/10/2024 | Toiletries/Cosmetics | |
| SAIC | Double Bottom, Adam and Eve | 06/14/2024 | 07/09/2024 | IT Services | |
| SCS | Pipe bottom | 06/10/2024 | 06/17/2024 | Furn/Home Furnishings | |
| SNPS | Double Top, Adam and Eve | 06/20/2024 | 07/11/2024 | Computer Software and Svcs | |
| TFX | Ugly double bottom | 06/26/2024 | 07/15/2024 | Diversified Co. | |
| TEVA | Double Bottom, Adam and Adam | 07/01/2024 | 07/09/2024 | Drug | |
| TXT | Double Bottom, Eve and Eve | 06/14/2024 | 07/05/2024 | Diversified Co. | |
| RIG | Big W | 06/25/2024 | 07/10/2024 | Oilfield Svcs/Equipment | |
| TWLO | Ugly double bottom | 06/20/2024 | 07/10/2024 | E-Commerce | |
| UGI | Double Bottom, Eve and Adam | 06/14/2024 | 07/09/2024 | Natural Gas (Distributor) | |
| UNH | Double Bottom, Adam and Eve | 05/29/2024 | 06/20/2024 | Medical Services | |
| VFC | Pipe bottom | 07/01/2024 | 07/08/2024 | Apparel | |
| VMI | Three Rising Valleys | 05/01/2024 | 07/09/2024 | Metal Fabricating | |
| VECO | Double Top, Adam and Eve | 06/18/2024 | 07/11/2024 | Precision Instrument | |
| WRB | Triple bottom | 04/26/2024 | 07/11/2024 | Insurance (Prop/Casualty) | |
| WU | Double Bottom, Adam and Adam | 06/17/2024 | 06/27/2024 | Financial Services | |
| WSC | Pipe bottom | 07/01/2024 | 07/08/2024 | Industrial Services |
![]()
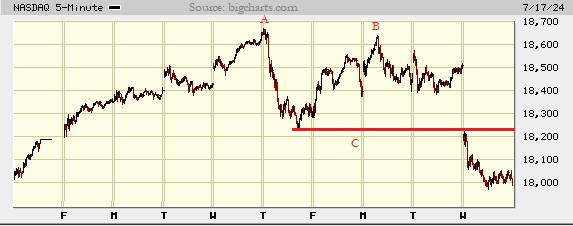
I show a picture of the Nasdaq composite on the 5-minute scale.
$ $ $
A chart pattern called a double top appears at AB. It confirms as a valid chart pattern when the index closes below the lowest price between the two peaks. I show that with line C.
The measure rule, which is the height of the pattern (A-C) subtracted from C gives a target that price meets or exceeds 64% of the time in a bull market. Right now, the index is just under halfway to the target.
What does that mean? The measure rule is just a computed target. It's not gravity. It's not magnetism. It's just a number. The index has found support here (the sideways move during the last few hours). That could means tomorrow we'll see a snapback rally. Or it could mean the downward plunge continues. After all, the markets are expected to be weak going into the start of August, according to the updated yearly forecast. And by the way, I found a mistake where I showed the June 2024 forecast update, not July. So you might want to visit the link.
$ $ $
Here's a symbol list of 152 chart and candlestick patterns (13 "investment grade" candle patterns) found in today's securities using my version of Patternz: ANF, AXDX, AMD, AA, ALGT, AMZN, AEE, AEP, AMGN, AMN, AON, APA, APOG, ADM, ATO, ADP, AVNT, AVA, BMI, BECN, BMRN, BKH, BRC, BCO, BMY, BR, BBW, BG, CBT, CDNS, CALM, CI, CSCO, CLNE, CL, CMCO, CMTL, ED, CAG, COP, COST, CCRN, CCK, DVN, DFS, DSGR, ^DJU, EME, EOG, EVRG, XOM, FWRD, FNV, GNW, GILD, GFS, HBI, THG, HL, HP, HWM, HUN, INCY, JNJ, LRCX, LAMR, LMT, L, LPLA, MTSI, MANH, MCHX, MKTX, MRTN, MA, MTRX, META, MGEE, MU, MSFT, MOS, NTGR, NWPX, NTNX, NVDA, OXY, OLN, OMI, PAYX, POR, PG, PHM, PSTG, KWR, RTX, RES, SAND, SLB, SCHW, SCI, NOW, SLGN, STR, SKX, SMAR, SWN, TEVA, TXN, RIG, TRV, TZOO, SLCA, UNH, UNM, VFC, VMI, VECO, MDRX, WSM, WSC, WWD, XEL, ZBRA, ITA, IYK, IYE, IXC, EWK, EWM, XLP, XLE, UNG, SMH. Click this link for details (pattern type, start and end dates).
For a list of small patterns (those a few days wide) click this link.
$ $ $
The following table shows where Fibonacci retrace values of the day's high-low range are plus pivot points, calculated on the Nasdaq composite, sorted by value. When several are near each other (small differences), the area might act as support or resistance.
-- Thomas Bulkowski, author: Invest for Two-Comma Wealth (#Ad)
![]()
| © 2024 ThePatternSite.com Metric | Value | Diff | Close (within 10% of the high-low range for the day)? |
| Monthly S2 | 16,294.71 | ||
| Monthly S1 | 17,145.82 | 851.10 | |
| Daily S2 | 17,813.97 | 668.16 | |
| Weekly S2 | 17,869.97 | 55.99 | |
| Daily S1 | 17,905.45 | 35.48 | |
| Monthly Pivot | 17,908.44 | 3.00 | Yes! The Monthly Pivot is close to the Daily S1. |
| Weekly S1 | 17,933.44 | 25.00 | Yes! The Weekly S1 is close to the Monthly Pivot. |
| Low | 17,972.87 | 39.43 | |
| Close | 17,996.92 | 24.05 | Yes! The Close is close to the Low. |
| Daily Pivot | 18,064.34 | 67.42 | |
| 61.8% Down from Intraday High | 18,068.51 | 4.17 | Yes! The 61.8% Down from Intraday High is close to the Daily Pivot. |
| 50% Down from Intraday High | 18,098.05 | 29.54 | |
| 38.2% Down from Intraday High | 18,127.60 | 29.54 | |
| Daily R1 | 18,155.82 | 28.22 | |
| Open | 18,188.19 | 32.37 | |
| High | 18,223.24 | 35.05 | |
| Weekly Pivot | 18,302.26 | 79.02 | |
| Daily R2 | 18,314.71 | 12.46 | Yes! The Daily R2 is close to the Weekly Pivot. |
| Weekly R1 | 18,365.73 | 51.02 | |
| Weekly R2 | 18,734.55 | 368.81 | |
| Monthly R1 | 18,759.55 | 25.00 | Yes! The Monthly R1 is close to the Weekly R2. |
| Monthly R2 | 19,522.17 | 762.63 |
This is a picture of the chart pattern indicator on the daily scale. The indicator is the line chart below a chart of the S&P 500 composite.
Finally, we have a resolution of the question of what happens next? I'm talking about the undecided switching from neutral bars (which are off white on the chart) and the red ones (bearish). They've been flopping back and forth for months now.
About a week ago, one bar turned green (bullish). Because signals can change for up to a week, this one has been in place long enough to remain on the chart.
That means this chart is bullish. It suggests the markets are going higher and today they did. The Dow was up almost 750 points. Nice.
This chart doesn't add much to the picture. It's bullish. It shows market strength spiking and creating a fast rise in the CPI line over the last week or so even though the index climbed at a more leisurely rate.
The CPI is at or near 100, the top of the scale. It means the CPI is going to drop (because it can't go up). When will that occur and will it translate into a meaningful drop in the index? I don't have an answer to those questions. My guess is yes, the market will grow overextended and drop, but I don't think it'll last long.
Short-term, the markets are strong, but we will likely see a retrace after such a strong upward move.
$ $ $
Here's a symbol list of 162 chart and candlestick patterns (13 "investment grade" candle patterns) found in today's securities using my version of Patternz: MMM, ANF, ACIW, ADTN, ALRM, ALGT, AEP, AMGN, AMN, ANIK, AR, APOG, AVNT, AZTA, BMI, BMRN, BKNG, BFH, BCO, BR, BRKR, BBW, CBT, CACI, CDNS, CALM, CX, COR, CIEN, CI, CSCO, CLNE, CGNX, CMCO, CONN, COST, CCK, DECK, DDS, DFS, DSGR, DUK, EXP, EIX, EPAM, FDX, FISV, FLEX, FTNT, FWRD, FNV, GME, IT, GNW, GOOGL, GPRO, HBI, HLIT, HL, HSII, HOV, HWM, HUN, INCY, ITGR, TILE, K, KFRC, LAMR, LDOS, RAMP, L, MCHX, MKTX, MRTN, MTRN, MTRX, MDT, MRCY, MGEE, MU, MSFT, MCO, MOS, MYGN, NFG, NKE, NOC, NWPX, NTNX, OLN, OMI, PDCO, POR, PFG, PGR, PEG, PHM, KWR, R, SAND, SMG, NOW, SHOP, SKYW, SMAR, SO, SWN, SR, SUM, TGT, TEVA, TXN, RIG, TRV, TZOO, TG, UGI, VFC, VMI, WERN, WMB, WSC, ZBRA, ITA, IYM, DDM, IHF, MXI, SLV, EWO, EWC, EWI, EWJ, EWM, EWY, EWT, PPA, PBE, PEJ, PXJ, PJP, XLF, GLD, XLB, XRT, XAR, UNG. Click this link for details (pattern type, start and end dates).
For a list of small patterns (those a few days wide) click this link.
-- Thomas Bulkowski, author: Invest for Two-Comma Wealth (#Ad)
![]()
$ $ $
I show another slider trading quiz featuring V-bottom chart pattern.
$ $ $
Here's a symbol list of 143 chart and candlestick patterns (13 "investment grade" candle patterns) found in today's securities using my version of Patternz: MMM, ACN, ADTN, AEIS, ALRM, AMED, AXP, AR, AON, AAPL, AVY, AZTA, BALL, BERY, BIIB, BOOT, BSX, BRKR, CACI, CAL, CE, CNP, CRL, CI, CNX, CL, CMTL, CXW, DFS, ^DJI, ECL, EOG, EFX, EG, EXPD, FAST, FISV, FLEX, FTV, FRD, GME, IT, GNW, GPRO, HLIT, HAYN, HL, HON, HUM, IEX, ITW, INCY, ITGR, IPAR, JBLU, KBH, KFRC, KMB, KLIC, LH, LEG, L, MAN, MKTX, MRTN, MU, MS, MOS, MYGN, NFG, NJR, NEU, NUS, NTNX, NVDA, ASGN, OTEX, PYPL, PEN, PLXS, POR, PFG, PGR, DGX, RMBS, ROK, ROP, SCI, SHW, SKYW, SO, LUV, SPSC, SXI, SSYS, TRGP, TGT, TFX, TEVA, RIG, TZOO, SLCA, WU, WLK, WMB, WSC, IYK, IYH, IAT, IEV, IGV, IHI, EWA, EWI, EWJ, EWL, TUR, PPA, PBE, PXJ, XLF, XLV, XAR, UNG, VHT. Click this link for details (pattern type, start and end dates).
For a list of small patterns (those a few days wide) click this link.
$ $ $
The following table shows where Fibonacci retrace values of the day's high-low range are plus pivot points, calculated on the Dow industrials, sorted by value. When several are near each other (small differences), the area might act as support or resistance.
-- Thomas Bulkowski, author: Invest for Two-Comma Wealth (#Ad)
![]()
| © 2024 ThePatternSite.com Metric | Value | Diff | Close (within 10% of the high-low range for the day)? |
| Monthly S2 | 37,640.21 | ||
| Weekly S2 | 38,761.21 | 1,121.00 | |
| Monthly S1 | 38,925.96 | 164.75 | |
| Weekly S1 | 39,486.46 | 560.50 | |
| Monthly Pivot | 39,591.60 | 105.14 | |
| Weekly Pivot | 39,871.85 | 280.25 | |
| Daily S2 | 40,017.97 | 146.12 | |
| Daily S1 | 40,114.85 | 96.88 | |
| Low | 40,136.10 | 21.25 | Yes! The Low is close to the Daily S1. |
| Open | 40,138.40 | 2.30 | Yes! The Open is close to the Low. |
| Close | 40,211.72 | 73.32 | |
| 61.8% Down from Intraday High | 40,218.23 | 6.51 | Yes! The 61.8% Down from Intraday High is close to the Close. |
| Daily Pivot | 40,232.97 | 14.74 | Yes! The Daily Pivot is close to the 61.8% Down from Intraday High. |
| 50% Down from Intraday High | 40,243.60 | 10.63 | Yes! The 50% Down from Intraday High is close to the Daily Pivot. |
| 38.2% Down from Intraday High | 40,268.97 | 25.37 | |
| Daily R1 | 40,329.85 | 60.88 | |
| High | 40,351.10 | 21.25 | Yes! The High is close to the Daily R1. |
| Daily R2 | 40,447.97 | 96.87 | |
| Weekly R1 | 40,597.11 | 149.13 | |
| Monthly R1 | 40,877.36 | 280.25 | |
| Weekly R2 | 40,982.49 | 105.14 | |
| Monthly R2 | 41,542.99 | 560.50 |
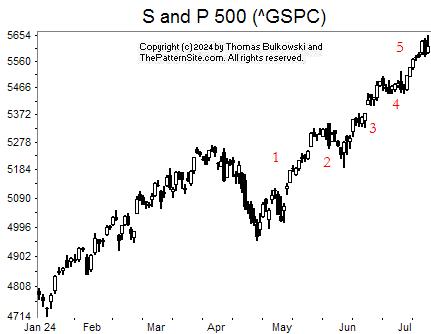
This is a chart of the S&P 500 index on the daily scale.
There's not a lot to say about this chart. The index continues to rise.
I'm not a big fan of Elliott Wave, but I've identified the waves with numbers (but I could be wrong).
Number 1 shows the index making a strong push higher. Number 2 is the retrace. Number 4 might not be a retrace. Rather, it might be a continuation of wave 3. Assigning wave counts is difficult and subject to revision, which is why I dislike Elliott. For a novice like me, it can be downright dangerous.
It seems that two experts can't agree on the wave count sometimes.
We're either waiting for a wave 4 retrace or seeing price climb in wave 5. If it's wave 5, then look for a decline where price drops, retraces the drop, and then drops again (an ABC correction).
![]()
The following is a brief review of how the markets performed over time. The numbers refer to the close-to-close move in the Dow industrials.
Many options expire this week, so traders will be looking to close out their positions, and that suggests increased volatility (large daily price swings).
![]()
The following is based on an SFO article in December 2004 by John Seekinger, titled, "Take a two-dimensional approach." He offers these tips.
| Index | S2 | S1 | Pivot | R1 | R2 |
| Dow Industrials (^DJI): Daily | 39,540 | 39,770 | 40,014 | 40,244 | 40,488 |
| Weekly | 38,691 | 39,346 | 39,802 | 40,457 | 40,912 |
| Monthly | 37,570 | 38,785 | 39,521 | 40,737 | 41,473 |
| S&P500 (^GSPC): Daily | 5,555 | 5,585 | 5,620 | 5,650 | 5,686 |
| Weekly | 5,518 | 5,567 | 5,611 | 5,660 | 5,704 |
| Monthly | 5,204 | 5,410 | 5,533 | 5,738 | 5,861 |
| Nasdaq (^IXIC): Daily | 18,153 | 18,276 | 18,416 | 18,539 | 18,679 |
| Weekly | 18,004 | 18,201 | 18,436 | 18,633 | 18,868 |
| Monthly | 16,429 | 17,414 | 18,042 | 19,027 | 19,656 |
Here are the formulas:
![]()
Earnings season will be starting in about 1 days.
Here's a symbol list of 210 chart and candlestick patterns (13 "investment grade" candle patterns) found in today's securities using my version of Patternz: DDD, ACN, ADTN, ALRM, AMED, AXP, AMWD, AMGN, AON, ATR, AVA, AZTA, BSET, BZH, BIO, BIIB, BKH, BOOT, BAH, BSX, BMY, BLDR, CBT, CAL, CLS, CINF, CNA, CNO, CNX, CL, CMTL, COTY, CSGS, CMI, CW, DDS, ^DJI, EXP, ECL, EIX, EMR, EL, EXPD, FICO, FAST, FISV, FWRD, FNV, GME, IT, GNW, GL, GMS, GPRO, HBI, HE, HL, HSY, HNI, DHI, HOV, ILMN, INFN, IBP, ITGR, IPAR, IBKR, TILE, IPI, JBLU, KBH, LZB, LDOS, LEN, L, LOW, MHO, MRO, MA, MGEE, MLKN, MCO, MS, MOS, MYGN, NFG, NOV, NFLX, NJR, JWN, NWPX, NUS, NVDA, ASGN, OR, OXM, PEN, PLXS, PG, PGR, PRU, PHM, PSTG, RL, RJF, RGA, ROST, R, SAIC, SEIC, SCI, SHW, SO, SWN, SCS, SUM, TPR, TGT, TFX, TPX, TXN, TXT, TOL, RIG, TG, UHAL, UGI, VLO, VMI, VRTX, VC, XEL, ZBRA, IYM, IAI, IYK, IEZ, IHE, DDM, FXL, FXI, IYH, IHF, IAT, IEV, MXI, IGE, ITB, IHI, EWA, EWO, EWK, EWZ, EWC, EWQ, EWG, EWH, EWI, EWJ, EWM, EPP, EWP, EWD, EWL, EWT, EWU, IBB, PPA, PEJ, PXJ, PJP, PHO, ROBO, XLP, XLF, XHB, XLI, XLB, XRT, XAR, VHT, VIS, VAW. Click this link for details (pattern type, start and end dates).
For a list of small patterns (those a few days wide) click this link.
The below industries were the best (rank 1) or worst performing of those I follow.
|
-- Thomas Bulkowski, author: Invest for Two-Comma Wealth and the novel (fiction), Training "Miles" (#Ad)
![]()
$ $ $
Here's a symbol list of 254 chart and candlestick patterns (13 "investment grade" candle patterns) found in today's securities using my version of Patternz: DDD, ABT, AXDX, AEIS, ATSG, ALRM, AMED, AEE, AEO, AXP, AMGN, AR, AMAT, AWI, AIZ, AGO, AZTA, BCPC, BSET, BECN, BERY, BIIB, BKNG, BMY, BLDR, CDNS, CLS, CX, CNC, CRL, CVX, CLX, CNA, CNO, CGNX, CL, COST, CRH, CCRN, CMI, DECK, DDS, ^DJU, ^DJI, D, DOV, EBAY, ECL, EPAM, EVRG, EXPI, XOM, EZPW, FARO, FTV, GME, GPS, IT, GNW, GL, GPRO, GES, HBI, HAYN, HL, HELE, HOV, IDA, IEX, ITW, ILMN, NSP, IBP, IIIN, ITGR, INTC, TILE, JKHY, JAZZ, KLAC, KSS, KLIC, LZB, LRCX, LEG, LDOS, RAMP, MHO, MTSI, M, MANH, MKTX, MGEE, MCO, MS, MUR, MYGN, ^IXIC, NOV, NEE, NI, JWN, NOVT, NVDA, ON, OUT, OMI, PATK, PDCO, PCTY, PEN, PCG, PNW, PLXS, POR, PPG, PPL, PFG, PRU, PHM, PSTG, QCOM, RHI, ROK, ROST, ^GSPC, CRM, SBH, SEIC, SRE, SMTC, SHW, SKYW, SO, SCCO, LUV, SWN, SXI, SNPS, TPR, TDOC, TDY, TFX, TER, TXN, TXT, TOL, TG, TREX, VFC, VECO, WSO, WSC, WWW, ZBRA, IAI, IYC, IYE, IHE, IDU, FTEC, QTEC, FXL, FXI, BOTZ, QQQ, ICF, IAT, IYZ, IEV, IGV, MXI, IXN, SOXX, SLV, IYF, ITB, IHI, EWA, EWO, EWK, EWC, ECH, EEM, EWG, EWH, EIS, EWI, EWJ, EWM, EPP, EWS, EZA, EWP, EWL, EWT, THD, EWU, QLD, IBB, PPA, DBA, PBE, PXJ, PJP, SSO, ROBO, XLY, GLD, XHB, SPY, XAR, XLK, XLU, USO, SMH, VHT, VONG. Click this link for details (pattern type, start and end dates).
For a list of small patterns (those a few days wide) click this link.
$ $ $
You can find setups based on a Fibonacci retrace by clicking on the link.
The following patterns were found manually, not using Patternz. Mr. Bulkowski has excluded any securities he owns from appearing in the list. However, he may add any of the securities listed to his portfolio at any time, just as you can.
In the table below, the red and green colors are based on the historical breakout direction for the associated chart pattern. If a high and tight flag appears, the start and end dates highlight the flagpole only and not the flag.
For details about the chart patterns, click here.
-- Thomas Bulkowski, author: Invest for Two-Comma Wealth (#Ad)
![]()
| Symbol | Chart Pattern | Bullish Bearish | Start | End | Industry |
| ANF | Triangle, descending | 06/04/2024 | 07/10/2024 | Apparel | |
| AMD | Double Bottom, Eve and Adam | 06/18/2024 | 07/01/2024 | Semiconductor | |
| AA | Pipe bottom | 06/10/2024 | 06/17/2024 | Aerospace/Defense | |
| AEO | Double Bottom, Adam and Eve | 06/20/2024 | 07/05/2024 | Apparel | |
| AIG | Double Bottom, Eve and Adam | 06/17/2024 | 06/26/2024 | Insurance (Prop/Casualty) | |
| ACGL | Double Top, Eve and Eve | 05/23/2024 | 06/25/2024 | Insurance (Prop/Casualty) | |
| ASH | Double Bottom, Adam and Adam | 07/02/2024 | 07/09/2024 | Chemical (Basic) | |
| AGO | Rising wedge | 06/06/2024 | 07/08/2024 | Insurance (Life) | |
| AVY | Double Bottom, Adam and Adam | 07/02/2024 | 07/09/2024 | Packaging and Container | |
| AVA | Double Bottom, Eve and Eve | 06/21/2024 | 07/09/2024 | Electric Utility (West) | |
| AXS | Triangle, symmetrical | 06/14/2024 | 07/11/2024 | Insurance (Prop/Casualty) | |
| BAX | Double Bottom, Eve and Eve | 06/11/2024 | 07/02/2024 | Medical Supplies | |
| CNP | Head-and-shoulders top | 06/12/2024 | 07/01/2024 | Electric Utility (Central) | |
| CIEN | Triangle, symmetrical | 06/13/2024 | 07/11/2024 | Telecom. Equipment | |
| DFS | Broadening wedge, ascending | 05/29/2024 | 06/27/2024 | Financial Services | |
| DSGR | Triangle, symmetrical | 04/28/2023 | 05/26/2023 | Metal Fabricating | |
| ^DJU | Diamond bottom | 06/26/2024 | 07/08/2024 | None | |
| EXP | Triple bottom | 06/25/2024 | 07/09/2024 | Cement and Aggregates | |
| EMR | Triple bottom | 06/06/2024 | 06/26/2024 | Computers and Peripherals | |
| EPAM | Ugly double bottom | 06/18/2024 | 07/10/2024 | IT Services | |
| EZPW | Double Top, Eve and Eve | 06/03/2024 | 07/01/2024 | Financial Services | |
| FTV | Broadening top, right-angled and ascending | 06/12/2024 | 07/11/2024 | Industrial Services | |
| FCX | Head-and-shoulders bottom | 06/04/2024 | 07/02/2024 | Metals and Mining (Div.) | |
| GL | Head-and-shoulders bottom | 05/24/2024 | 07/09/2024 | Insurance (Life) | |
| HQY | Double Top, Eve and Adam | 06/12/2024 | 07/01/2024 | Healthcare Information | |
| HL | Pipe bottom | 06/24/2024 | 07/01/2024 | Metals and Mining (Div.) | |
| HP | Ugly double bottom | 06/14/2024 | 07/09/2024 | Petroleum (Producing) | |
| JNJ | Double Bottom, Adam and Eve | 06/27/2024 | 07/05/2024 | Medical Supplies | |
| KELYA | Pipe top | 06/17/2024 | 06/24/2024 | Human Resources | |
| LHX | Double Bottom, Adam and Adam | 05/29/2024 | 06/14/2024 | Aerospace/Defense | |
| LEG | Double Bottom, Adam and Eve | 06/27/2024 | 07/09/2024 | Furn/Home Furnishings | |
| LEN | Double Top, Adam and Adam | 03/28/2024 | 05/15/2024 | Homebuilding | |
| LPLA | Head-and-shoulders top | 05/31/2024 | 07/01/2024 | Securities Brokerage | |
| MA | Double Top, Eve and Adam | 05/16/2024 | 06/24/2024 | Financial Services | |
| MRCY | Double Bottom, Adam and Adam | 06/20/2024 | 06/28/2024 | Computers and Peripherals | |
| NBR | Ugly double bottom | 06/17/2024 | 07/08/2024 | Oilfield Svcs/Equipment | |
| NEE | Double Bottom, Adam and Eve | 06/18/2024 | 07/02/2024 | Electric Utility (East) | |
| NI | Triangle, symmetrical | 05/21/2024 | 07/08/2024 | Electric Utility (Central) | |
| NVDA | Pipe bottom | 06/24/2024 | 07/01/2024 | Semiconductor | |
| OGE | Triple bottom | 06/17/2024 | 07/09/2024 | Electric Utility (Central) | |
| ON | Broadening top, right-angled and descending | 05/15/2024 | 07/11/2024 | Semiconductor | |
| PNW | Head-and-shoulders bottom | 06/11/2024 | 07/05/2024 | Electric Utility (West) | |
| PPG | Diamond bottom | 06/26/2024 | 07/05/2024 | Chemical (Diversified) | |
| KWR | Double Bottom, Eve and Eve | 06/21/2024 | 07/10/2024 | Chemical (Specialty) | |
| QCOM | Pipe bottom | 06/24/2024 | 07/01/2024 | Telecom. Equipment | |
| RGA | Double Bottom, Eve and Adam | 06/13/2024 | 07/02/2024 | Insurance (Life) | |
| ROP | Double Top, Eve and Eve | 06/24/2024 | 06/28/2024 | Industrial Services | |
| SRE | Triangle, symmetrical | 06/04/2024 | 07/10/2024 | Electric Utility (West) | |
| SCI | Rising wedge | 05/24/2024 | 06/26/2024 | Industrial Services | |
| SHW | Double Bottom, Adam and Adam | 06/25/2024 | 07/02/2024 | Chemical (Basic) | |
| SO | Broadening top | 06/10/2024 | 07/11/2024 | Electric Utility (East) | |
| SWX | Double Bottom, Adam and Adam | 07/01/2024 | 07/09/2024 | Natural Gas (Distributor) | |
| SR | Head-and-shoulders bottom | 05/29/2024 | 07/09/2024 | Natural Gas (Distributor) | |
| TDY | Triple bottom | 06/20/2024 | 07/05/2024 | Aerospace/Defense | |
| TPX | Diamond bottom | 06/26/2024 | 07/10/2024 | Furn/Home Furnishings | |
| UPS | Rectangle bottom | 05/29/2024 | 07/11/2024 | Air Transport | |
| V | Double Top, Adam and Adam | 06/07/2024 | 06/24/2024 | Financial Services | |
| WAT | Double Bottom, Adam and Adam | 07/01/2024 | 07/09/2024 | Precision Instrument | |
| WWW | Triple top | 05/14/2024 | 06/25/2024 | Shoe | |
| XEL | Head-and-shoulders top | 05/13/2024 | 06/04/2024 | Electric Utility (West) |
![]()
$ $ $
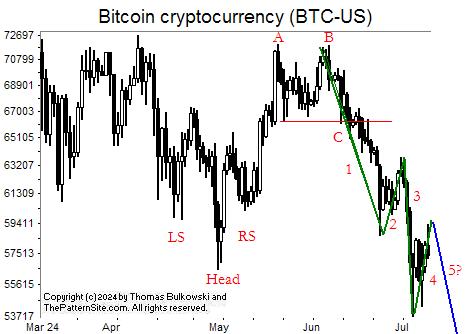
I show a picture of bitcoin (BTC-USD) on the daily scale.
LS, RS, and head are the shoulders and head of a head-and-shoulders bottom chart pattern. It confirmed as valid and the currency climbed and formed another pattern at AB.
AB is a double top, confirmed when the currency closed below the lowest low between A and B. Line C shows the value it needed to close below.
Highlighted in green (which is hard to see), is what I think of as Elliott waves (5 count, motive wave). It's only made 4 legs, so expect another down leg and perhaps additional down legs if there are extensions. I show a possible leg 5 in blue.
$ $ $
Here's a symbol list of 136 chart and candlestick patterns (13 "investment grade" candle patterns) found in today's securities using my version of Patternz: AEIS, ATSG, ALK, DOX, AR, AAPL, ADM, ANET, ARW, ATO, AVA, BBY, BIO, BMRN, BRC, CX, CHKP, CSCO, CLNE, CNO, CNX, CAG, CTS, ^DJU, ^DJI, DTE, EXC, FICO, FIS, FLEX, FTNT, FTV, FNV, GME, GNW, GPRO, GGG, GFF, HBI, HIG, HE, HQY, HL, HSY, HON, JBHT, HURC, IDA, ILMN, IIIN, INTU, KMT, KSS, LHX, LDOS, MRCY, MCO, MOS, MLI, MUR, MYGN, NOV, NI, NOC, NOVT, NVDA, OLN, ASGN, OMI, PKG, PCTY, PYPL, POR, PINC, PFG, PG, PRU, QCOM, ROST, RGLD, R, SEIC, SIGI, SHW, SKYW, SCS, TEVA, UHAL, VFC, MDRX, V, WSO, WLK, WPM, IYM, IYE, IHE, DDM, FXL, ILF, IYF, EWA, EWK, EWC, EEM, EIS, EWI, EWJ, EWW, EPP, EWS, EZA, EWT, THD, PPA, PBE, PXJ, XLB, VAW. Click this link for details (pattern type, start and end dates).
For a list of small patterns (those a few days wide) click this link.
$ $ $
The following table shows where Fibonacci retrace values of the day's high-low range are plus pivot points, calculated on the Nasdaq composite, sorted by value. When several are near each other (small differences), the area might act as support or resistance.
-- Thomas Bulkowski, author: Invest for Two-Comma Wealth (#Ad)
![]()
| © 2024 ThePatternSite.com Metric | Value | Diff | Close (within 10% of the high-low range for the day)? |
| Monthly S2 | 16,166.85 | ||
| Monthly S1 | 17,407.15 | 1,240.30 | |
| Weekly S2 | 17,515.13 | 107.98 | |
| Monthly Pivot | 17,886.73 | 371.60 | |
| Weekly S1 | 18,081.29 | 194.56 | |
| Weekly Pivot | 18,223.80 | 142.51 | |
| Daily S2 | 18,402.46 | 178.66 | |
| Low | 18,467.58 | 65.12 | |
| Open | 18,512.09 | 44.51 | |
| Daily S1 | 18,524.96 | 12.87 | Yes! The Daily S1 is close to the Open. |
| 61.8% Down from Intraday High | 18,539.25 | 14.29 | Yes! The 61.8% Down from Intraday High is close to the Daily S1. |
| 50% Down from Intraday High | 18,561.38 | 22.14 | |
| 38.2% Down from Intraday High | 18,583.52 | 22.14 | |
| Daily Pivot | 18,590.07 | 6.55 | Yes! The Daily Pivot is close to the 38.2% Down from Intraday High. |
| Close | 18,647.45 | 57.38 | |
| High | 18,655.19 | 7.74 | Yes! The High is close to the Close. |
| Daily R1 | 18,712.57 | 57.38 | |
| Daily R2 | 18,777.68 | 65.12 | |
| Weekly R1 | 18,789.96 | 12.28 | Yes! The Weekly R1 is close to the Daily R2. |
| Weekly R2 | 18,932.47 | 142.51 | |
| Monthly R1 | 19,127.03 | 194.56 | |
| Monthly R2 | 19,606.61 | 479.58 |
This is a picture of the chart pattern indicator on the daily scale. The indicator is the line chart below a chart of the S&P 500 composite.
The vacillation between neutral (white bars) and bearish (red bars) continues. You can see a hint at the bottom of the chart that the CPI is trending lower. We'll see a better view of that on the next chart.
I still think these bars represent a weakening of the general market.
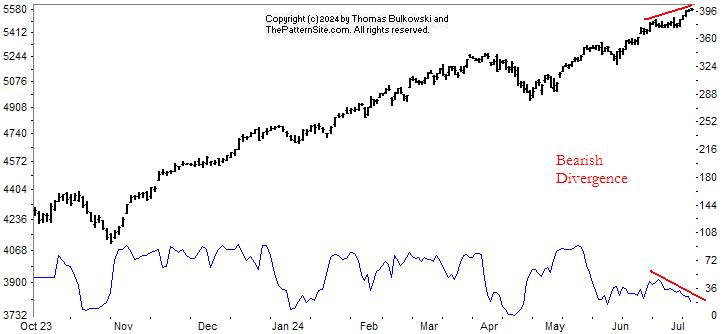
Here's the chart which shows the CPI line continuing to drop even as the index rises. That's bearish divergence. It suggests but does not guarantee that the index will following the CPI lower.
Keep in mind that bearish divergence can last for months before anything of significance happens.
$ $ $

I changed the title of my 'Training "Miles" ' book to "Foresight". Unfortunately, I forgot to check how many other titles used the same name (there's a lot). Oops. If you'd like to buy a copy, click on the link. And if you read the book, please post a review. The new title wiped out the existing reviews. Sigh.
$ $ $
Here's a symbol list of 117 chart and candlestick patterns (13 "investment grade" candle patterns) found in today's securities using my version of Patternz: AEIS, ALK, AEP, AON, AAPL, AMAT, ANET, ARW, AGO, ATO, AVA, BALL, BSET, BRC, BCO, BMY, BRKR, BBW, COR, CHKP, CHD, CSCO, CLNE, CGNX, CAG, CR, CTS, D, DRQ, DTE, EIX, EVH, EZPW, FDX, FIS, FIVN, FLEX, FLS, FMC, GME, GNW, GL, GPRO, HBI, HTLD, HL, HSII, HELE, TILE, IPI, ISRG, JKHY, K, KEYS, KFRC, LXU, MANH, MAN, MRTN, MTRN, MCO, MUR, NOV, NEU, NUS, NVDA, ASGN, ORCL, OR, OXM, PKG, PTEN, PG, QCOM, ROG, ROL, SCHW, NOW, SKYW, SO, SR, SRDX, TTD, UHAL, VLO, VC, WERN, WSM, WOLF, QTEC, FXL, IGE, IYF, EWO, EWH, PPA, PHO, XLF, XRT, UNG, USO. Click this link for details (pattern type, start and end dates).
For a list of small patterns (those a few days wide) click this link.
-- Thomas Bulkowski, author: Invest for Two-Comma Wealth (#Ad)
![]()
$ $ $
I show another slider trading quiz featuring symmetrical triangles, part 2.
$ $ $
Here's a symbol list of 128 chart and candlestick patterns (13 "investment grade" candle patterns) found in today's securities using my version of Patternz: DDD, ADTN, AFL, AKAM, AEP, AFG, AME, AON, AAPL, ADM, ARW, ATO, BCPC, BSET, BECN, BKH, BA, BCO, CNP, CDAY, CHKP, CVX, CHD, CMCO, ED, GLW, COTY, ^DJT, DTE, EMR, EVRG, EVH, EXPI, EXPD, EZPW, FARO, FIVN, FDP, GES, HOV, JBHT, HUN, IDA, INTC, IRM, K, KELYA, LHX, LZB, LNC, MHO, MANH, MAN, MCHX, MLM, MRCY, MU, MCO, MOS, NBR, ^IXIC, NJR, JWN, NOC, NUS, ASGN, ORCL, OMI, PETS, PLXS, POR, PPG, PEG, PSTG, KWR, RLI, ROL, RES, ^GSPC, SAIA, SIGI, SRE, SKYW, SSYS, TGT, TPX, TDC, TTD, TMO, TKR, TOL, TSCO, UIS, VC, VMC, WSO, WEX, IAI, QTEC, FXL, QQQ, IYZ, IXC, IGE, EWO, EWK, EWH, EIS, EWI, EWP, EWT, QLD, PXJ, XAR, SMH. Click this link for details (pattern type, start and end dates).
For a list of small patterns (those a few days wide) click this link.
$ $ $
The following table shows where Fibonacci retrace values of the day's high-low range are plus pivot points, calculated on the Dow industrials, sorted by value. When several are near each other (small differences), the area might act as support or resistance.
-- Thomas Bulkowski, author: Invest for Two-Comma Wealth (#Ad)
![]()
| © 2024 ThePatternSite.com Metric | Value | Diff | Close (within 10% of the high-low range for the day)? |
| Monthly S2 | 37,730.40 | ||
| Monthly S1 | 38,537.60 | 807.20 | |
| Weekly S2 | 38,873.28 | 335.68 | |
| Daily S2 | 39,049.53 | 176.25 | |
| Monthly Pivot | 39,054.41 | 4.88 | Yes! The Monthly Pivot is close to the Daily S2. |
| Weekly S1 | 39,109.04 | 54.62 | |
| Daily S1 | 39,197.16 | 88.13 | |
| Weekly Pivot | 39,273.70 | 76.54 | |
| Low | 39,278.43 | 4.73 | Yes! The Low is close to the Weekly Pivot. |
| Close | 39,344.79 | 66.36 | |
| Open | 39,391.98 | 47.19 | |
| 61.8% Down from Intraday High | 39,422.27 | 30.29 | Yes! The 61.8% Down from Intraday High is close to the Open. |
| Daily Pivot | 39,426.06 | 3.79 | Yes! The Daily Pivot is close to the 61.8% Down from Intraday High. |
| 50% Down from Intraday High | 39,466.70 | 40.64 | |
| Weekly R1 | 39,509.45 | 42.76 | |
| 38.2% Down from Intraday High | 39,511.13 | 1.67 | Yes! The 38.2% Down from Intraday High is close to the Weekly R1. |
| Daily R1 | 39,573.69 | 62.57 | |
| High | 39,654.96 | 81.27 | |
| Weekly R2 | 39,674.12 | 19.16 | Yes! The Weekly R2 is close to the High. |
| Daily R2 | 39,802.59 | 128.47 | |
| Monthly R1 | 39,861.61 | 59.02 | |
| Monthly R2 | 40,378.42 | 516.82 |
$ $ $
I show another slider trading quiz featuring symmetrical triangles, part 2.
$ $ $
Here's a symbol list of 128 chart and candlestick patterns (13 "investment grade" candle patterns) found in today's securities using my version of Patternz: DDD, ADTN, AFL, AKAM, AEP, AFG, AME, AON, AAPL, ADM, ARW, ATO, BCPC, BSET, BECN, BKH, BA, BCO, CNP, CDAY, CHKP, CVX, CHD, CMCO, ED, GLW, COTY, ^DJT, DTE, EMR, EVRG, EVH, EXPI, EXPD, EZPW, FARO, FIVN, FDP, GES, HOV, JBHT, HUN, IDA, INTC, IRM, K, KELYA, LHX, LZB, LNC, MHO, MANH, MAN, MCHX, MLM, MRCY, MU, MCO, MOS, NBR, ^IXIC, NJR, JWN, NOC, NUS, ASGN, ORCL, OMI, PETS, PLXS, POR, PPG, PEG, PSTG, KWR, RLI, ROL, RES, ^GSPC, SAIA, SIGI, SRE, SKYW, SSYS, TGT, TPX, TDC, TTD, TMO, TKR, TOL, TSCO, UIS, VC, VMC, WSO, WEX, IAI, QTEC, FXL, QQQ, IYZ, IXC, IGE, EWO, EWK, EWH, EIS, EWI, EWP, EWT, QLD, PXJ, XAR, SMH. Click this link for details (pattern type, start and end dates).
For a list of small patterns (those a few days wide) click this link.
$ $ $
The following table shows where Fibonacci retrace values of the day's high-low range are plus pivot points, calculated on the Dow industrials, sorted by value. When several are near each other (small differences), the area might act as support or resistance.
-- Thomas Bulkowski, author: Invest for Two-Comma Wealth (#Ad)
![]()
| © 2024 ThePatternSite.com Metric | Value | Diff | Close (within 10% of the high-low range for the day)? |
| Monthly S2 | 37,730.40 | ||
| Monthly S1 | 38,537.60 | 807.20 | |
| Weekly S2 | 38,873.28 | 335.68 | |
| Daily S2 | 39,049.53 | 176.25 | |
| Monthly Pivot | 39,054.41 | 4.88 | Yes! The Monthly Pivot is close to the Daily S2. |
| Weekly S1 | 39,109.04 | 54.62 | |
| Daily S1 | 39,197.16 | 88.13 | |
| Weekly Pivot | 39,273.70 | 76.54 | |
| Low | 39,278.43 | 4.73 | Yes! The Low is close to the Weekly Pivot. |
| Close | 39,344.79 | 66.36 | |
| Open | 39,391.98 | 47.19 | |
| 61.8% Down from Intraday High | 39,422.27 | 30.29 | Yes! The 61.8% Down from Intraday High is close to the Open. |
| Daily Pivot | 39,426.06 | 3.79 | Yes! The Daily Pivot is close to the 61.8% Down from Intraday High. |
| 50% Down from Intraday High | 39,466.70 | 40.64 | |
| Weekly R1 | 39,509.45 | 42.76 | |
| 38.2% Down from Intraday High | 39,511.13 | 1.67 | Yes! The 38.2% Down from Intraday High is close to the Weekly R1. |
| Daily R1 | 39,573.69 | 62.57 | |
| High | 39,654.96 | 81.27 | |
| Weekly R2 | 39,674.12 | 19.16 | Yes! The Weekly R2 is close to the High. |
| Daily R2 | 39,802.59 | 128.47 | |
| Monthly R1 | 39,861.61 | 59.02 | |
| Monthly R2 | 40,378.42 | 516.82 |
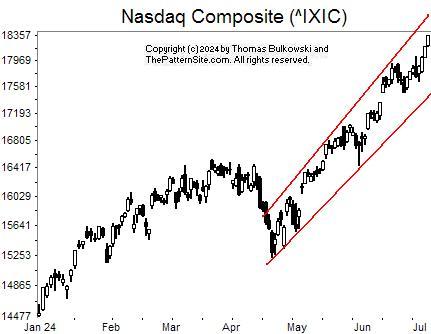
This is a chart of the Nasdaq composite on the daily scale.
There's not much to say about the chart. The Nasdaq keeps going up. It's following a channel shown by the two near-parallel red lines.
The uptrend will continue until it stops. That may sound dumb but it's true. It's how I set my targets at the top of this page. To put it another way, a trend in motion tends to remain in motion.
However, history says that the indices tend to weaken in the summer months. The 2024 forecast, charts 2 through 4, makes this clear. Expect weakness going into August.
Let's wait and see if it happens.
![]()
The following is a brief review of how the markets performed over time. The numbers refer to the close-to-close move in the Dow industrials.
No options expire this week.
![]()
The following is based on an SFO article in December 2004 by John Seekinger, titled, "Take a two-dimensional approach." He offers these tips.
| Index | S2 | S1 | Pivot | R1 | R2 |
| Dow Industrials (^DJI): Daily | 39,090 | 39,233 | 39,312 | 39,455 | 39,534 |
| Weekly | 38,884 | 39,130 | 39,284 | 39,530 | 39,684 |
| Monthly | 37,741 | 38,558 | 39,065 | 39,882 | 40,389 |
| S&P500 (^GSPC): Daily | 5,518 | 5,542 | 5,556 | 5,581 | 5,595 |
| Weekly | 5,404 | 5,486 | 5,528 | 5,610 | 5,652 |
| Monthly | 5,121 | 5,344 | 5,457 | 5,680 | 5,793 |
| Nasdaq (^IXIC): Daily | 18,136 | 18,244 | 18,305 | 18,414 | 18,475 |
| Weekly | 17,417 | 17,885 | 18,126 | 18,594 | 18,834 |
| Monthly | 16,069 | 17,211 | 17,789 | 18,931 | 19,508 |
Here are the formulas:
![]()
Earnings season will be starting in about 8 days.
Here's a symbol list of 155 chart and candlestick patterns (13 "investment grade" candle patterns) found in today's securities using my version of Patternz: AEIS, AMD, AES, A, AEE, AFG, AME, APOG, AAPL, AIZ, ATO, BMI, BSET, BIG, BKH, BMY, BLDR, CBT, CDAY, CHKP, CIEN, CINF, CNA, CMCO, CXW, GLW, COTY, CR, CCK, CMI, CW, EMN, ELV, EQT, EVRG, EZPW, FLS, GE, GNW, GL, HLIT, HTLD, HL, HUN, HURC, IDA, IEX, IDXX, IIIN, ITGR, IBKR, INTU, JKHY, KALU, K, KELYA, LAMR, LDOS, LPLA, M, MAS, META, MU, MLKN, MCO, MOS, ^IXIC, NFLX, NOC, NWPX, ORI, OLN, OR, OMI, PETS, PNW, PPL, RJF, RNG, ^GSPC, SAIA, CRM, SAND, SMG, SEE, SEIC, SKX, SMAR, LUV, SR, TPR, TTD, TKR, TOL, TG, TWLO, WSO, WERN, WU, WPM, WSM, WDAY, ITA, FTEC, QQQ, IHF, IEV, IXC, IXN, SLV, EWO, EWK, EWC, EEM, EWG, EIS, EWJ, EPP, EWY, EWP, THD, TUR, EWU, QLD, DBA, PBE, PXJ, PHO, SSO, GLD, XHB, XRT, UNG, MGK, VONG. Click this link for details (pattern type, start and end dates).
For a list of small patterns (those a few days wide) click this link.
The below industries were the best (rank 1) or worst performing of those I follow.
|
-- Thomas Bulkowski, author: Invest for Two-Comma Wealth and the novel (fiction), Training "Miles" (#Ad)
![]()
$ $ $
Here's a symbol list of 127 chart and candlestick patterns (13 "investment grade" candle patterns) found in today's securities using my version of Patternz: ABT, AXDX, AA, DOX, AEE, AFG, AMGN, AMN, ANIK, AAPL, ACGL, AGO, ATO, BMRN, BOOT, BSX, BMY, CLS, CENX, CHKP, CLF, CNA, CMTL, CXW, GLW, CCK, EXP, ELV, EG, EVRG, FFIV, FDS, FDX, FNV, FDP, GME, GD, GE, GL, GOOGL, GPRO, GFF, HQY, HSIC, HUM, IEX, ITGR, IBKR, IPI, ISRG, JAZZ, KALU, KELYA, KEYS, KSS, LLY, LXU, MCHX, MA, MTRX, META, MLKN, MYGN, NFLX, NEU, OTEX, PFE, RRC, RNG, RGLD, ^GSPC, SAND, SIGI, SCI, SCCO, SR, TPR, TDOC, TEVA, TTD, TSCO, TREX, V, VC, WSO, IYC, IHE, FXI, IHF, IEV, ILF, SLV, IYF, IHI, EWA, EWO, EWK, EWZ, EWC, EEM, EWQ, EWJ, EWM, EPP, EWS, EWT, PJP, SSO, ROBO, XLY, GLD, XRT, VHT. Click this link for details (pattern type, start and end dates).
For a list of small patterns (those a few days wide) click this link.
$ $ $
You can find setups based on a Fibonacci retrace by clicking on the link.
The following patterns were found manually, not using Patternz. Mr. Bulkowski has excluded any securities he owns from appearing in the list. However, he may add any of the securities listed to his portfolio at any time, just as you can.
In the table below, the red and green colors are based on the historical breakout direction for the associated chart pattern. If a high and tight flag appears, the start and end dates highlight the flagpole only and not the flag.
For details about the chart patterns, click here.
-- Thomas Bulkowski, author: Invest for Two-Comma Wealth (#Ad)
![]()
| Symbol | Chart Pattern | Bullish Bearish | Start | End | Industry |
| DDD | Pipe top | 06/03/2024 | 06/10/2024 | Electronics | |
| ALK | Triangle, descending | 05/29/2024 | 07/03/2024 | Air Transport | |
| ALL | Triangle, symmetrical | 06/17/2024 | 07/03/2024 | Insurance (Prop/Casualty) | |
| AMGN | Double Bottom, Adam and Eve | 05/30/2024 | 06/13/2024 | Biotechnology | |
| AIZ | Falling wedge | 05/23/2024 | 07/03/2024 | Insurance (Diversified) | |
| AGO | Broadening bottom | 05/15/2024 | 06/27/2024 | Insurance (Life) | |
| ADP | Three Falling Peaks | 05/22/2024 | 06/24/2024 | IT Services | |
| AZTA | Double Top, Adam and Eve | 06/12/2024 | 06/24/2024 | Semiconductor Cap Equip. | |
| BECN | Triple top | 04/05/2024 | 06/12/2024 | Retail Building Supply | |
| BIO | Double Top, Adam and Adam | 05/15/2024 | 06/17/2024 | Medical Supplies | |
| BIIB | Triangle, ascending | 05/15/2024 | 07/03/2024 | Biotechnology | |
| BA | Double Bottom, Adam and Adam | 06/20/2024 | 06/25/2024 | Aerospace/Defense | |
| BR | Double Bottom, Adam and Eve | 05/30/2024 | 06/14/2024 | Information Services | |
| CALM | Double Bottom, Eve and Adam | 06/10/2024 | 06/21/2024 | Food Processing | |
| COR | Ugly double bottom | 05/29/2024 | 06/12/2024 | Biotechnology | |
| CENX | Pipe bottom | 06/10/2024 | 06/17/2024 | Metals and Mining (Div.) | |
| CVX | Head-and-shoulders complex top | 04/12/2024 | 05/31/2024 | Petroleum (Integrated) | |
| CI | Double Top, Adam and Adam | 05/31/2024 | 06/24/2024 | Medical Services | |
| CINF | Head-and-shoulders bottom | 06/05/2024 | 06/26/2024 | Insurance (Prop/Casualty) | |
| CLNE | Head-and-shoulders top | 05/10/2024 | 06/24/2024 | Natural Gas (Distributor) | |
| CGNX | Pipe bottom | 06/03/2024 | 06/10/2024 | Precision Instrument | |
| CONN | Dead-cat bounce | 06/24/2024 | 06/27/2024 | Retail (Special Lines) | |
| DHR | Double Top, Eve and Eve | 05/22/2024 | 06/06/2024 | Medical Services | |
| FANG | Double Bottom, Adam and Adam | 06/04/2024 | 06/17/2024 | Petroleum (Producing) | |
| ^DJI | Broadening top | 01/03/2024 | 01/19/2024 | None | |
| DRQ | Triangle, symmetrical | 05/31/2024 | 07/03/2024 | Oilfield Svcs/Equipment | |
| DUK | Double Top, Adam and Adam | 05/21/2024 | 06/04/2024 | Electric Utility (East) | |
| EMR | Broadening top, right-angled and ascending | 06/06/2024 | 06/27/2024 | Computers and Peripherals | |
| EOG | Double Bottom, Adam and Adam | 06/04/2024 | 06/14/2024 | Natural Gas (Distributor) | |
| EXPD | Three Rising Valleys | 05/01/2024 | 06/14/2024 | Air Transport | |
| FICO | Ugly double bottom | 04/26/2024 | 05/31/2024 | IT Services | |
| FLS | Broadening wedge, descending | 05/22/2024 | 06/24/2024 | Machinery | |
| FTNT | Double Bottom, Adam and Adam | 06/20/2024 | 06/26/2024 | Computer Software and Svcs | |
| GD | Triple top | 05/21/2024 | 06/24/2024 | Aerospace/Defense | |
| GS | Head-and-shoulders bottom | 05/30/2024 | 06/27/2024 | Securities Brokerage | |
| THG | Double Bottom, Adam and Adam | 06/14/2024 | 06/26/2024 | Insurance (Prop/Casualty) | |
| HTLD | Ugly double bottom | 04/30/2024 | 05/29/2024 | Trucking/Transp. Leasing | |
| HNI | Head-and-shoulders bottom | 06/10/2024 | 06/26/2024 | Furn/Home Furnishings | |
| HOLX | Double Bottom, Eve and Adam | 06/20/2024 | 06/26/2024 | Medical Supplies | |
| JBHT | Diamond bottom | 05/23/2024 | 07/03/2024 | Trucking/Transp. Leasing | |
| INTC | Triangle, symmetrical | 06/12/2024 | 07/03/2024 | Semiconductor | |
| KFRC | Head-and-shoulders bottom | 05/30/2024 | 06/17/2024 | Human Resources | |
| LAMR | Broadening top, right-angled and descending | 01/22/2024 | 02/21/2024 | Advertising | |
| LEN | Double Top, Eve and Adam | 06/03/2024 | 06/12/2024 | Homebuilding | |
| L | Double Bottom, Eve and Eve | 05/29/2024 | 06/14/2024 | Insurance (Prop/Casualty) | |
| MHO | Broadening bottom | 05/23/2024 | 06/21/2024 | Homebuilding | |
| MRTN | Broadening top | 05/14/2024 | 06/28/2024 | Trucking/Transp. Leasing | |
| MOS | Pipe bottom | 06/10/2024 | 06/17/2024 | Chemical (Diversified) | |
| NBR | Pipe bottom | 06/10/2024 | 06/17/2024 | Oilfield Svcs/Equipment | |
| NKE | Dead-cat bounce | 06/28/2024 | 06/28/2024 | Shoe | |
| NTNX | Double Bottom, Eve and Eve | 06/07/2024 | 06/20/2024 | E-Commerce | |
| OTEX | Pipe bottom | 06/03/2024 | 06/10/2024 | E-Commerce | |
| OXM | Triangle, symmetrical | 06/12/2024 | 07/03/2024 | Apparel | |
| PKE | Double Bottom, Eve and Eve | 06/10/2024 | 06/17/2024 | Chemical (Specialty) | |
| PAYX | Double Top, Adam and Adam | 05/22/2024 | 06/24/2024 | IT Services | |
| PNW | Double Top, Eve and Eve | 05/21/2024 | 05/31/2024 | Electric Utility (West) | |
| PG | Double Top, Adam and Eve | 06/07/2024 | 06/24/2024 | Household Products | |
| PGR | Multi-peaks | 03/18/2024 | 07/03/2024 | Insurance (Prop/Casualty) | |
| PRU | Pipe bottom | 06/10/2024 | 06/17/2024 | Insurance (Life) | |
| PHM | Triple top | 04/01/2024 | 05/16/2024 | Homebuilding | |
| PSTG | Pipe top | 06/10/2024 | 06/17/2024 | Computers and Peripherals | |
| DGX | Double Bottom, Eve and Eve | 06/20/2024 | 06/28/2024 | Medical Services | |
| RL | Head-and-shoulders top | 05/31/2024 | 06/25/2024 | Apparel | |
| RMBS | Triple bottom | 05/01/2024 | 06/25/2024 | Semiconductor Cap Equip. | |
| RTX | Head-and-shoulders top | 05/23/2024 | 06/24/2024 | Aerospace/Defense | |
| RGS | Flag, high and tight | 06/07/2024 | 06/27/2024 | Toiletries/Cosmetics | |
| RNG | Double Bottom, Adam and Adam | 06/20/2024 | 06/27/2024 | Computer Software and Svcs | |
| R | Broadening bottom | 05/28/2024 | 06/12/2024 | Trucking/Transp. Leasing | |
| CRM | Ugly double bottom | 05/30/2024 | 06/17/2024 | E-Commerce | |
| SLB | Double Bottom, Eve and Adam | 06/06/2024 | 06/14/2024 | Oilfield Svcs/Equipment | |
| SEE | Head-and-shoulders top | 05/17/2024 | 06/12/2024 | Packaging and Container | |
| SEIC | Double Bottom, Adam and Adam | 06/10/2024 | 06/17/2024 | IT Services | |
| SIGI | Double Bottom, Adam and Adam | 06/14/2024 | 06/26/2024 | Insurance (Prop/Casualty) | |
| NOW | Pipe bottom | 05/28/2024 | 06/03/2024 | IT Services | |
| STR | Double Bottom, Adam and Adam | 06/04/2024 | 06/17/2024 | Natural Gas (Diversified) | |
| SKX | Double Top, Adam and Eve | 06/12/2024 | 06/25/2024 | Shoe | |
| SCS | Double Bottom, Adam and Adam | 06/10/2024 | 06/20/2024 | Furn/Home Furnishings | |
| TPR | Head-and-shoulders complex top | 05/16/2024 | 07/01/2024 | Apparel | |
| TDC | Double Bottom, Adam and Eve | 05/07/2024 | 05/31/2024 | Computer Software and Svcs | |
| TER | Triangle, symmetrical | 06/12/2024 | 07/02/2024 | Semiconductor Cap Equip. | |
| UHAL | Triangle, symmetrical | 05/30/2024 | 07/03/2024 | Trucking/Transp. Leasing | |
| WPM | Triangle, descending | 06/04/2024 | 06/27/2024 | Metals and Mining (Div.) | |
| WSM | Pipe top | 06/10/2024 | 06/17/2024 | Retail (Special Lines) | |
| WDAY | Double Bottom, Adam and Eve | 05/30/2024 | 06/13/2024 | Computer Software and Svcs | |
| ZBRA | Double Bottom, Adam and Eve | 06/10/2024 | 06/21/2024 | Computers and Peripherals |
![]()
Here's the updated 2024 market forecast, presented in slider format.
$ $ $
Here's a symbol list of 155 chart and candlestick patterns (13 "investment grade" candle patterns) found in today's securities using my version of Patternz: AXDX, ACN, AMD, A, ALK, DOX, AIG, AME, APH, AON, AAPL, AMAT, AVA, AZTA, BCPC, BERY, BKNG, BOOT, BG, CDNS, CLS, CNP, CDAY, CHKP, CI, CTAS, CLX, CNO, CNX, CGNX, CONN, CXW, GLW, CRH, CROX, CMI, DHR, DDS, ^DJI, DUK, EME, EG, FDS, FISV, FIVN, FLS, FTNT, GPS, GD, GFS, GFF, GES, THG, HQY, HP, DHI, HURC, IBP, IPI, KBH, K, KELYA, KMT, KLAC, KLIC, LRCX, LEN, LNC, MHO, MTSI, MAS, MA, MTRN, MDT, MRCY, MCO, MYGN, NBR, ORI, OTEX, PKG, PKE, PATK, PTEN, PFE, POR, PRU, PHM, RMBS, RGA, RNG, SAND, SCHW, SEE, SHW, STR, SMAR, SCCO, TPR, TDC, TER, TKR, TOL, TDG, TZOO, UGI, VFC, VC, WMT, WSO, WU, WMB, IYC, DDM, FXL, IAT, ILF, SLV, IYF, ITB, EWC, EWH, EWJ, EWM, EWW, EWS, EWD, EWT, THD, TUR, PJP, PHO, SSO, ROBO, XLF, XHB, XLB, XRT, SPY, XAR, UNG. Click this link for details (pattern type, start and end dates).
For a list of small patterns (those a few days wide) click this link.
-- Thomas Bulkowski, author: Invest for Two-Comma Wealth (#Ad)
![]()
$ $ $
I show another slider trading quiz featuring ascending triangles, part 2 .
$ $ $
Here's a symbol list of 191 chart and candlestick patterns (13 "investment grade" candle patterns) found in today's securities using my version of Patternz: ANF, ABM, AEIS, AKAM, AA, AMED, AR, APOG, AAPL, AWI, ADP, AVA, AZTA, BAX, BERY, BBY, BIIB, BA, BRC, BCO, BLDR, CAL, COR, CNP, CENX, CRL, CHKP, CI, CTAS, CLNE, CLX, CAG, GLW, COTY, CR, CCRN, CTS, DDS, DFS, DOV, DRQ, DTE, DUK, EXP, EMN, EBAY, EIX, EME, EMR, EQT, EG, FFIV, FIS, FIVN, FLEX, FLS, FMC, FTNT, FTV, FNV, GME, GPS, IT, GNW, GGG, GES, HLIT, HP, HSY, HOV, HUN, IDA, IEX, ITW, IBP, ITGR, IPAR, IPI, ISRG, KBH, K, KELYA, KMT, KEYS, KFRC, LHX, LEN, RAMP, MHO, MTSI, MCHX, MLM, MAS, MTRN, MTRX, MDT, MOS, MUR, NBR, NOV, NTGR, NOVT, OGE, OR, OUT, PANW, PATK, PTEN, PAYX, PNW, POR, PPG, PPL, PRU, KWR, RGS, ROG, R, SLB, SEE, SHW, SKYW, LUV, SR, SXI, SCS, SUM, SRDX, SNPS, TGT, TMO, TKR, TOL, TDG, TZOO, UGI, VFC, WAT, WSO, WEX, WMB, WOLF, WWW, XEL, ITA, IYK, IYC, IDU, FXI, BOTZ, IHF, IYZ, ILF, IYF, EWA, EWO, EWK, EWM, THD, DBA, PEJ, PXJ, PJP, PHO, XHB, XLB, XRT, XLU, UNG, VAW. Click this link for details (pattern type, start and end dates).
For a list of small patterns (those a few days wide) click this link.
$ $ $
The following table shows where Fibonacci retrace values of the day's high-low range are plus pivot points, calculated on the Dow industrials, sorted by value. When several are near each other (small differences), the area might act as support or resistance.
-- Thomas Bulkowski, author: Invest for Two-Comma Wealth (#Ad)
![]()
| © 2024 ThePatternSite.com Metric | Value | Diff | Close (within 10% of the high-low range for the day)? |
| Monthly S2 | 37,343.63 | ||
| Monthly S1 | 38,256.58 | 912.95 | |
| Weekly S2 | 38,554.34 | 297.76 | |
| Daily S2 | 38,814.85 | 260.51 | |
| Weekly S1 | 38,861.93 | 47.08 | |
| Monthly Pivot | 38,913.90 | 51.97 | |
| Daily S1 | 38,992.19 | 78.29 | |
| Low | 39,037.94 | 45.75 | |
| Close | 39,169.52 | 131.58 | |
| Open | 39,186.20 | 16.68 | Yes! The Open is close to the Close. |
| 61.8% Down from Intraday High | 39,190.90 | 4.70 | Yes! The 61.8% Down from Intraday High is close to the Open. |
| Daily Pivot | 39,215.27 | 24.37 | Yes! The Daily Pivot is close to the 61.8% Down from Intraday High. |
| Weekly Pivot | 39,216.58 | 1.30 | Yes! The Weekly Pivot is close to the Daily Pivot. |
| 50% Down from Intraday High | 39,238.15 | 21.57 | Yes! The 50% Down from Intraday High is close to the Weekly Pivot. |
| 38.2% Down from Intraday High | 39,285.40 | 47.25 | |
| Daily R1 | 39,392.61 | 107.21 | |
| High | 39,438.36 | 45.75 | |
| Weekly R1 | 39,524.17 | 85.81 | |
| Daily R2 | 39,615.69 | 91.52 | |
| Monthly R1 | 39,826.85 | 211.16 | |
| Weekly R2 | 39,878.82 | 51.97 | |
| Monthly R2 | 40,484.17 | 605.35 |
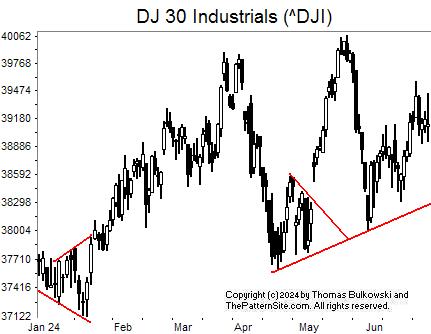
This shows the Dow industrials on the daily scale.
On the far left is a chart pattern called a broadening bottom. The index broke out upward from the pattern and made a good rise.
Toward the center right of the chart are two converging red trendlines. They outline another chart pattern called a symmetrical triangle. This chart pattern also had an upward breakout and prices climbed away from the pattern.
The longer diagonal red line is a trendline. I wanted to see where support was and how the valleys touched the line. The January low is not on the trendline, which I found disappointing, so I didn't connect it. I would expect the trendline to support the index should it drop that far sometime in the future.
The chart seems to show a sideways move from February onward. The 2024 forecast shows the Dow dropping going into August, so expect weakness from here. I'll update the forecast on Wednesday's post.
![]()
The following is a brief review of how the markets performed over time. The numbers refer to the close-to-close move in the Dow industrials.
No options expire this week.
![]()
The following is based on an SFO article in December 2004 by John Seekinger, titled, "Take a two-dimensional approach." He offers these tips.
| Index | S2 | S1 | Pivot | R1 | R2 |
| Dow Industrials (^DJI): Daily | 38,660 | 38,889 | 39,167 | 39,396 | 39,673 |
| Weekly | 38,537 | 38,828 | 39,200 | 39,490 | 39,862 |
| Monthly | 37,327 | 38,223 | 38,897 | 39,793 | 40,467 |
| S&P500 (^GSPC): Daily | 5,406 | 5,433 | 5,478 | 5,506 | 5,551 |
| Weekly | 5,400 | 5,430 | 5,477 | 5,507 | 5,554 |
| Monthly | 5,060 | 5,260 | 5,392 | 5,592 | 5,724 |
| Nasdaq (^IXIC): Daily | 17,519 | 17,626 | 17,830 | 17,937 | 18,142 |
| Weekly | 17,213 | 17,473 | 17,754 | 18,014 | 18,295 |
| Monthly | 15,815 | 16,774 | 17,404 | 18,363 | 18,994 |
Here are the formulas:
![]()
Earnings season is over.
Here's a symbol list of 154 chart and candlestick patterns (13 "investment grade" candle patterns) found in today's securities using my version of Patternz: ANF, ACIW, AEIS, AES, ALK, AA, ALGT, DOX, ANIK, APOG, AAPL, ATR, BALL, BAX, BERY, BA, BOOT, BAH, BCO, CAL, COR, CENX, CHKP, CI, CTAS, CLNE, CLF, CTSH, ED, CXW, COST, XRAY, DFS, ^DJU, D, EIX, EME, EQT, EG, EXPD, FAST, FE, FMC, FWRD, FNV, GFF, HLIT, HE, HP, HWM, HUM, ILMN, INFN, IBP, IIIN, IPAR, INTU, JAZZ, KALU, KMT, KEYS, KLIC, LHX, LZB, LAMR, LEG, LDOS, LPLA, MTSI, M, MAN, MRTN, MA, MDT, MGEE, MU, MSFT, MOS, MUR, NBR, ^IXIC, NTGR, NKE, NUS, NTNX, ORI, OMI, OXM, PATK, PETS, POR, PPL, PRU, PSTG, KWR, RL, RCKY, ROG, ^GSPC, SEE, SKYW, SR, SCS, TPX, TEVA, TDG, TZOO, TREX, V, WU, WSC, WOLF, WWW, WWD, XEL, ITA, IYC, IEZ, FXI, QQQ, IYZ, IYF, EWA, EWK, EWQ, EWH, EWJ, THD, QLD, IBB, PPA, PBE, SSO, SPY, XLU, USO, VIS, VAW, MGK, VONG. Click this link for details (pattern type, start and end dates).
For a list of small patterns (those a few days wide) click this link.
The below industries were the best (rank 1) or worst performing of those I follow.
|
-- Thomas Bulkowski, author: Invest for Two-Comma Wealth and the novel (fiction), Training "Miles" (#Ad)
![]()
Support this site! Clicking any of the books (below) takes you to
Amazon.com If you buy ANYTHING while there, they pay for the referral.
Legal notice for paid links: "As an Amazon Associate I earn from qualifying purchases."
|
My Stock Market Books
|
My Novels
Orb Foresight Rewrite Coming!
|