
As of 04/21/2026
Indus: 49,149 -293.18 -0.6%
Trans: 23,933 +611.01 +2.6%
Utils: 1,134 -18.16 -1.6%
Nasdaq: 24,260 -144.42 -0.6%
S&P 500: 7,064 -45.13 -0.6%
|
YTD
+2.3%
+37.9%
+6.1%
+4.4%
+3.2%
|
|
As of 04/21/2026
Indus: 49,149 -293.18 -0.6%
Trans: 23,933 +611.01 +2.6%
Utils: 1,134 -18.16 -1.6%
Nasdaq: 24,260 -144.42 -0.6%
S&P 500: 7,064 -45.13 -0.6%
|
YTD
+2.3%
+37.9%
+6.1%
+4.4%
+3.2%
| |
|
| ||
Here's a symbol list of 99 chart and candlestick patterns (13 "investment grade" candle patterns) found in today's securities using my version of Patternz: AKAM, ALRM, AMZN, AMED, AIG, AMWD, AR, AON, AAPL, ARW, AXS, BSET, BOOT, BAH, BBW, BG, CBT, CENX, CIEN, CLNE, CL, CMCO, CMTL, CCRN, CCK, XRAY, DDS, EME, EZPW, FFIV, FISV, FDP, GME, GPRO, GGG, HE, HUBG, IDA, INCY, NSP, JNJ, K, KMB, KSS, KLIC, RAMP, MAN, MOS, NTAP, NEE, NOC, NVDA, OLN, ASGN, OMI, PANW, PINC, PG, PEG, RTX, RGA, CRM, SAND, SCI, STR, LUV, SWX, SRDX, TFX, TEVA, TTD, VEEV, MDRX, VRTX, WRB, IYK, FTEC, QTEC, FXI, ICF, IYZ, IXN, EWM, EZA, EWY, TUR, DBA, PBE, PEJ, PJP, MGK. Click this link for details (pattern type, start and end dates).
For a list of small patterns (those a few days wide) click this link.
$ $ $
You can find setups based on a Fibonacci retrace by clicking on the link.
The following patterns were found manually, not using Patternz. Mr. Bulkowski has excluded any securities he owns from appearing in the list. However, he may add any of the securities listed to his portfolio at any time, just as you can.
In the table below, the red and green colors are based on the historical breakout direction for the associated chart pattern. If a high and tight flag appears, the start and end dates highlight the flagpole only and not the flag.
For details about the chart patterns, click here.
-- Thomas Bulkowski, author: Invest for Two-Comma Wealth and the novel (fiction), Foresight (#Ad)
![]()
| Symbol | Chart Pattern | Bullish Bearish | Start | End | Industry |
| ALKS | Triple top | 05/02/2025 | 05/20/2025 | Drug | |
| ACGL | Triangle, symmetrical | 05/12/2025 | 05/29/2025 | Insurance (Prop/Casualty) | |
| BIO | Triple top | 04/23/2025 | 05/13/2025 | Medical Supplies | |
| CACI | Double Top, Eve and Eve | 05/09/2025 | 05/20/2025 | IT Services | |
| CHKP | Horn bottom | 04/07/2025 | 04/21/2025 | E-Commerce | |
| ED | Triple top | 04/04/2025 | 05/01/2025 | Electric Utility (East) | |
| DECK | Dead-cat bounce | 05/23/2025 | 05/23/2025 | Shoe | |
| ^DJU | Diamond top | 04/23/2025 | 05/28/2025 | None | |
| EXPI | Ugly double bottom | 05/07/2025 | 05/22/2025 | E-Commerce | |
| GNW | Double Top, Adam and Eve | 05/12/2025 | 05/20/2025 | Insurance (Life) | |
| THG | Double Bottom, Eve and Adam | 05/14/2025 | 05/22/2025 | Insurance (Prop/Casualty) | |
| HOLX | Pipe bottom | 04/28/2025 | 05/05/2025 | Medical Supplies | |
| DHI | Triple top | 04/23/2025 | 05/12/2025 | Homebuilding | |
| NSP | Pipe top | 05/12/2025 | 05/19/2025 | Human Resources | |
| KELYA | Double Top, Adam and Eve | 05/12/2025 | 05/20/2025 | Human Resources | |
| MLM | Double Top, Adam and Adam | 05/19/2025 | 05/27/2025 | Cement and Aggregates | |
| PRU | Double Top, Adam and Adam | 05/13/2025 | 05/19/2025 | Insurance (Life) | |
| RGA | Double Top, Adam and Eve | 05/12/2025 | 05/20/2025 | Insurance (Life) | |
| RCKY | Flag, high and tight | 04/16/2025 | 05/28/2025 | Shoe |
![]()
$ $ $

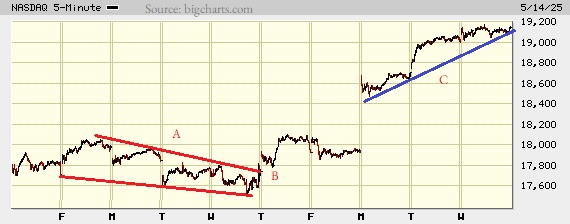
I show a picture of the Nasdaq composite on the 5-minute scale.
Last week, I discussed how flat the index was. You can see part of that from the left side of the chart to Wednesday (A to B). The move follows the red trendline on top and the pink one on the bottom.
On Wednesday, a week ago (B), the index dropped below the pink line to find support at the green line. Yes, it pierced that one, also, and formed an island reversal on Friday.
Now, the index has recovered to move horizontally again, bounded by the red line on top and perhaps the pink line on the bottom.
If you believe in mirrors, then we might see the index move sideways, mirroring the A to B move from Tuesday on to the right. However, let the mirror serve as guidance about what could happen and not bet too heavily that the index will move sideways.
$ $ $
Here's a symbol list of 150 chart and candlestick patterns (13 "investment grade" candle patterns) found in today's securities using my version of Patternz: DDD, ADBE, AEIS, AMD, ALK, AME, AR, APOG, AAPL, AWI, ASH, AVY, AZTA, BMI, BCPC, BAX, BBY, BBW, CBT, CENX, CDAY, CVX, CNA, CNX, CMCO, CMTL, CXW, COTY, CCRN, FANG, DDS, DOV, EMN, EME, EMR, EOG, EQT, XOM, FFIV, FDS, FDX, FIVN, FLS, GME, GD, GE, GPN, GL, GGG, GFF, HE, HQY, HWM, JBHT, HUN, HURC, IEX, ITW, NSP, IBP, IIIN, INTC, JNJ, K, KSS, KLIC, LANC, LDOS, RAMP, LMT, MTDR, NBR, NOV, NTAP, NEU, NEE, NWPX, NOVT, OXY, OMC, ASGN, PKG, PATK, PTEN, PAYX, PEN, PFE, PLXS, PINC, PFG, RJF, REGN, RHI, RCKY, ROG, ROP, R, SAIA, SAND, SLGN, STR, LUV, SWX, SPSC, TXT, TKR, UIS, VLO, VC, WERN, IYM, IAI, IYE, IEZ, IHE, IDU, FXL, FXI, IYZ, IGV, IGE, IEO, EIS, EWY, THD, TUR, DBA, PHO, XLE, GLD, USO, SMH, VAW. Click this link for details (pattern type, start and end dates).
For a list of small patterns (those a few days wide) click this link.
$ $ $
The following table shows where Fibonacci retrace values of the day's high-low range are plus pivot points, calculated on the Nasdaq composite, sorted by value. When several are near each other (small differences), the area might act as support or resistance.
-- Thomas Bulkowski, author: Invest for Two-Comma Wealth and the novel (fiction), Orb Foresight (#Ad)
![]()
| © 2025 ThePatternSite.com Metric | Value | Diff | Close (within 10% of the high-low range for the day)? |
| Monthly S2 | 14,453.15 | ||
| Monthly S1 | 16,777.04 | 2,323.90 | |
| Monthly Pivot | 18,009.23 | 1,232.18 | |
| Weekly S2 | 18,338.96 | 329.73 | |
| Weekly S1 | 18,719.95 | 380.99 | |
| Daily S2 | 18,961.60 | 241.65 | |
| Weekly Pivot | 18,980.68 | 19.08 | Yes! The Weekly Pivot is close to the Daily S2. |
| Daily S1 | 19,031.27 | 50.59 | |
| Low | 19,084.38 | 53.11 | |
| Close | 19,100.94 | 16.56 | Yes! The Close is close to the Low. |
| Daily Pivot | 19,154.05 | 53.11 | |
| 61.8% Down from Intraday High | 19,157.90 | 3.85 | Yes! The 61.8% Down from Intraday High is close to the Daily Pivot. |
| 50% Down from Intraday High | 19,180.61 | 22.71 | |
| 38.2% Down from Intraday High | 19,203.31 | 22.71 | |
| Daily R1 | 19,223.72 | 20.41 | |
| Open | 19,232.62 | 8.90 | Yes! The Open is close to the Daily R1. |
| High | 19,276.83 | 44.21 | |
| Daily R2 | 19,346.50 | 69.67 | |
| Weekly R1 | 19,361.67 | 15.17 | Yes! The Weekly R1 is close to the Daily R2. |
| Weekly R2 | 19,622.40 | 260.73 | |
| Monthly R1 | 20,333.12 | 710.72 | |
| Monthly R2 | 21,565.31 | 1,232.18 |

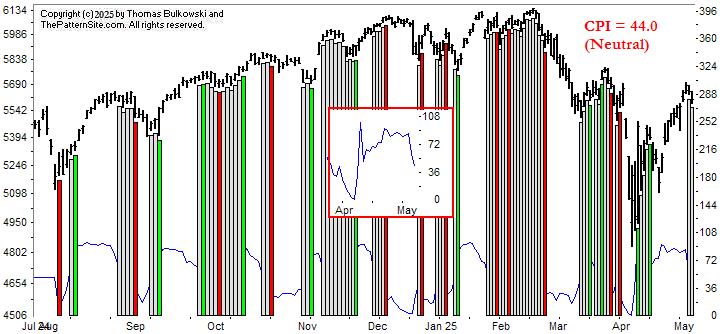
This is a picture of the chart pattern indicator on the daily scale. The indicator is the line chart below a chart of the S&P 500 composite.
After being whipped around this past week, the signal is currently green, which is bullish. Signals can change for up to a week, so the last two or three colored lines on the right of the chart might disappear or change color.
The inset in the middle of the chart shows how today's (Tuesday) big move up pulled the CPI higher, to 96.7, where 100 is the max and 0 is the minimum.
Such a strong, quick move higher suggests it is not lasting, that you'll see another retrace. I think that's likely but not guaranteed.
$ $ $
Here's a symbol list of 88 chart and candlestick patterns (13 "investment grade" candle patterns) found in today's securities using my version of Patternz: DDD, AES, AA, APH, AON, AGO, BKNG, BOOT, CE, CX, CHKP, CTAS, CLF, CMTL, CW, EXP, EME, EFX, FICO, FARO, FAST, FORM, FDP, GME, GE, HOV, HWM, ITGR, IRM, JAZZ, KSS, LAMR, LANC, RAMP, L, MTRX, MGEE, MYGN, OTEX, PKG, PKE, PINC, KWR, RL, RGS, RLI, SAND, SEE, SCCO, TRGP, RIG, TZOO, UGI, VRTX, WRB, WU, WMB, WWD, WDAY, ITA, MXI, ILF, EWA, EWO, EWK, EWZ, EWC, EWW, EPP, EWS, EWY, EWL, TUR, EWU, DBA, PEJ, PXJ, XLP, XRT, XAR. Click this link for details (pattern type, start and end dates).
For a list of small patterns (those a few days wide) click this link.
-- Thomas Bulkowski, author: Invest for Two-Comma Wealth and the novel (fiction), Orb Foresight (#Ad)
![]()
$ $ $
I show another slider trading quiz featuring Tredegar: TG (support and resistance) stock.
$ $ $
Here's a symbol list of 122 chart and candlestick patterns (13 "investment grade" candle patterns) found in today's securities using my version of Patternz: DDD, ABT, ALB, AMED, AEO, AMWD, AMN, APH, AAPL, AMAT, ARCB, ADM, BMI, BAH, BFH, BCO, CBT, CAL, CNC, CHKP, CIEN, CMTL, COTY, CROX, CTS, CMI, DECK, ECL, EMR, EZPW, FIVN, FLS, FCX, FRD, GNW, GILD, GPN, GFS, GPRO, HBI, THG, HLIT, HOV, HUBG, HUM, HUN, HURC, ITW, IBP, TILE, KLIC, LEG, LDOS, LNC, RAMP, MANH, MAS, MTRX, MDT, MUR, NFG, NOVT, ORI, ASGN, OR, OMI, PCG, PINC, RGA, RES, CRM, SBH, SIGI, STR, SCCO, SXI, SCS, SSYS, TPR, TRGP, TEVA, TJX, RIG, TZOO, UIS, UNM, VECO, MDRX, V, WU, WPM, WOLF, WDAY, ZBRA, ITA, IYM, IYE, IEZ, QTEC, FXL, IHF, IEV, IXC, IGE, IEO, EWZ, EWJ, EZA, EWP, TUR, IBB, DBA, PBE, PEJ, PJP, GLD, VAW. Click this link for details (pattern type, start and end dates).
For a list of small patterns (those a few days wide) click this link.
$ $ $
The following table shows where Fibonacci retrace values of the day's high-low range are plus pivot points, calculated on the Dow industrials, sorted by value. When several are near each other (small differences), the area might act as support or resistance.
-- Thomas Bulkowski, author: Invest for Two-Comma Wealth and the novel (fiction), Orb Foresight (#Ad)
![]()
| © 2025 ThePatternSite.com Metric | Value | Diff | Close (within 10% of the high-low range for the day)? |
| Monthly S2 | 35,747.21 | ||
| Monthly S1 | 38,675.14 | 2,927.93 | |
| Weekly S2 | 40,445.12 | 1,769.98 | |
| Monthly Pivot | 40,758.59 | 313.47 | |
| Weekly S1 | 41,024.09 | 265.50 | |
| Daily S2 | 41,147.40 | 123.31 | |
| Low | 41,354.09 | 206.69 | |
| Daily S1 | 41,375.24 | 21.15 | Yes! The Daily S1 is close to the Low. |
| 61.8% Down from Intraday High | 41,520.08 | 144.84 | |
| Open | 41,525.70 | 5.62 | Yes! The Open is close to the 61.8% Down from Intraday High. |
| 50% Down from Intraday High | 41,571.35 | 45.65 | |
| Daily Pivot | 41,581.92 | 10.57 | Yes! The Daily Pivot is close to the 50% Down from Intraday High. |
| Close | 41,603.07 | 21.15 | Yes! The Close is close to the Daily Pivot. |
| 38.2% Down from Intraday High | 41,622.63 | 19.55 | Yes! The 38.2% Down from Intraday High is close to the Close. |
| High | 41,788.61 | 165.98 | |
| Daily R1 | 41,809.76 | 21.15 | Yes! The Daily R1 is close to the High. |
| Weekly Pivot | 41,933.07 | 123.31 | |
| Daily R2 | 42,016.44 | 83.38 | |
| Weekly R1 | 42,512.04 | 495.60 | |
| Weekly R2 | 43,421.02 | 908.97 | |
| Monthly R1 | 43,686.52 | 265.50 | |
| Monthly R2 | 45,769.97 | 2,083.45 |
Here's a symbol list of 125 chart and candlestick patterns (13 "investment grade" candle patterns) found in today's securities using my version of Patternz: DDD, ADTN, AES, AFL, ALB, ALGT, ALL, AEE, AFG, AMWD, APOG, ACGL, ADM, AZTA, BAX, BAH, BRC, BCO, CACI, CALM, CE, CLS, CNC, CHKP, CINF, CTAS, CNA, CMTL, COP, COTY, CCRN, DVN, EBAY, EXPI, XOM, EZPW, FARO, FAST, FIVN, FRD, GIS, GNW, GILD, GFF, HLIT, HSY, JBHT, HUN, IIIN, IPAR, IPG, LAMR, LANC, LEG, LLY, LNC, RAMP, L, MGY, MRTN, MDT, MRK, MGEE, NBR, NJR, NWL, NKE, NOVT, ORI, OMC, ASGN, PKG, PTEN, PINC, PSTG, KWR, DGX, RL, RJF, RTX, RLI, ROK, R, SAIA, SEE, SLGN, TPR, TRGP, TECH, TFX, TJX, TSCO, RIG, TG, TWLO, WERN, WU, WLK, WSM, WOLF, WDAY, ITA, FXI, IYH, IHF, IEO, EWC, EIS, EWM, EWL, THD, TUR, IBB, PPA, PXJ, PJP, XLV, USO. Click this link for details (pattern type, start and end dates).
For a list of small patterns (those a few days wide) click this link.
$ $ $
You can find setups based on a Fibonacci retrace by clicking on the link.
The following patterns were found manually, not using Patternz. Mr. Bulkowski has excluded any securities he owns from appearing in the list. However, he may add any of the securities listed to his portfolio at any time, just as you can.
In the table below, the red and green colors are based on the historical breakout direction for the associated chart pattern. If a high and tight flag appears, the start and end dates highlight the flagpole only and not the flag.
For details about the chart patterns, click here.
-- Thomas Bulkowski, author: Invest for Two-Comma Wealth and the novel (fiction), Foresight (#Ad)
![]()
| Symbol | Chart Pattern | Bullish Bearish | Start | End | Industry |
| ABT | Ugly double bottom | 04/07/2025 | 04/23/2025 | Medical Supplies | |
| AFL | Triangle, descending | 04/21/2025 | 05/20/2025 | Insurance (Diversified) | |
| ALRM | Pennant | 05/13/2025 | 05/20/2025 | Computer Software and Svcs | |
| ALK | Pipe bottom | 04/21/2025 | 04/28/2025 | Air Transport | |
| AON | Ugly double bottom | 04/25/2025 | 05/14/2025 | Insurance (Diversified) | |
| AIZ | Triple top | 05/07/2025 | 05/19/2025 | Insurance (Diversified) | |
| BOOT | Flag, high and tight | 04/21/2025 | 05/20/2025 | Shoe | |
| CHKP | Ugly double bottom | 04/23/2025 | 05/14/2025 | E-Commerce | |
| CMTL | Flag, high and tight | 04/22/2025 | 05/22/2025 | Telecom. Equipment | |
| CMI | Double Top, Adam and Eve | 05/13/2025 | 05/19/2025 | Machinery | |
| EFX | Double Top, Adam and Eve | 05/13/2025 | 05/19/2025 | Information Services | |
| GD | Pipe bottom | 03/31/2025 | 04/07/2025 | Aerospace/Defense | |
| GILD | Pipe bottom | 05/05/2025 | 05/12/2025 | Biotechnology | |
| HSY | Double Top, Adam and Eve | 04/15/2025 | 05/12/2025 | Food Processing | |
| HURC | Triangle, symmetrical | 04/29/2025 | 05/22/2025 | Machinery | |
| IPG | Head-and-shoulders top | 05/02/2025 | 05/20/2025 | Advertising | |
| OGE | Head-and-shoulders top | 04/17/2025 | 05/07/2025 | Electric Utility (Central) | |
| ORI | Triangle, ascending | 04/23/2025 | 05/20/2025 | Insurance (Prop/Casualty) | |
| OMC | Head-and-shoulders top | 05/05/2025 | 05/20/2025 | Advertising | |
| PG | Double Bottom, Adam and Eve | 04/24/2025 | 05/12/2025 | Household Products | |
| DGX | Double Top, Eve and Adam | 05/02/2025 | 05/20/2025 | Medical Services | |
| RTX | Pipe bottom | 03/31/2025 | 04/07/2025 | Aerospace/Defense | |
| TSCO | Horn bottom | 04/07/2025 | 04/21/2025 | Retail Building Supply | |
| WU | Triangle, descending | 04/21/2025 | 05/22/2025 | Financial Services | |
| WOLF | Dead-cat bounce | 05/21/2025 | 05/21/2025 | Semiconductor |
![]()
$ $ $

I show a picture of the Nasdaq composite on the 5-minute scale.
The high to low swing in the index today (Wednesday) is about 450 points but it closed 270 points lower. Regardless, that's a big swing. The news headline: "Dow sinks 800 points as bond market starts to freak out over Trump’s tax bill." (Note: The headline relates to the Dow and not the Nasdaq).
I show a pattern that is a rectangle top (A), but I like to think of it as a multi-peak. The two are similar with the rectangle being more scarce than the multi-peak.
You can read about the patterns at the links provided, but both are bearish after a downward breakout. A breakout occurs when the index closes above the top or closes below the bottom of the respective nearby red lines. In this case, we could likely see a pullback to the bottom red line before a resumption of the down move. However, with a multi-peak, the pullback might continue rising above the top line (or reverse somewhere in between), suggesting a busted pattern but it is more likely a trap. Again, that means a falling price.
In this politically-charged environment, we could see a big recovery that invalidates the bearish outlook from the rectangle or the multi-peak. So be cautious.
$ $ $
Here's a symbol list of 127 chart and candlestick patterns (13 "investment grade" candle patterns) found in today's securities using my version of Patternz: DDD, ACIW, AYI, ALB, AEO, AXP, AMWD, APOG, ASH, AVNT, BAX, BIO, BLDR, CBT, CAL, CPB, CLS, CLNE, CNA, CGNX, CAG, COTY, CCRN, DHR, DSGR, ^DJT, DOV, EXP, EIX, EXPD, XOM, FFIV, FDX, FIVN, FTV, FRD, GILD, GPN, GMS, GOOGL, GFF, HSY, HNI, HURC, IIIN, KELYA, KSS, LHX, LEG, LNC, LMT, MRTN, MAS, MTDR, MDT, MLI, NBR, NOC, NOVT, OLN, OMC, ASGN, OTEX, OR, PTEN, PNW, PINC, QCOM, RTX, RLI, RES, R, SAIA, SAND, SCHW, SIGI, SHW, STR, SKYW, TRGP, TGT, TDC, TREX, UHAL, UPS, VLO, WERN, WLK, WPM, WSC, WOLF, ITA, IYE, IEZ, IHE, FXI, IAT, IEO, ITB, EWA, EWO, EWK, EWM, EWS, EWY, EWP, EWL, EWT, TUR, EWU, IBB, PPA, DBA, PEJ, XLE, XHB, USO. Click this link for details (pattern type, start and end dates).
For a list of small patterns (those a few days wide) click this link.
$ $ $
The following table shows where Fibonacci retrace values of the day's high-low range are plus pivot points, calculated on the Nasdaq composite, sorted by value. When several are near each other (small differences), the area might act as support or resistance.
-- Thomas Bulkowski, author: Invest for Two-Comma Wealth and the novel (fiction), Orb Foresight (#Ad)
![]()
| © 2025 ThePatternSite.com Metric | Value | Diff | Close (within 10% of the high-low range for the day)? |
| Monthly S2 | 14,395.71 | ||
| Monthly S1 | 16,634.17 | 2,238.47 | |
| Monthly Pivot | 17,923.80 | 1,289.62 | |
| Weekly S2 | 18,112.21 | 188.42 | |
| Weekly S1 | 18,492.43 | 380.21 | |
| Daily S2 | 18,528.87 | 36.45 | Yes! The Daily S2 is close to the Weekly S1. |
| Daily S1 | 18,700.76 | 171.88 | |
| Low | 18,799.20 | 98.44 | |
| Weekly Pivot | 18,852.92 | 53.72 | |
| Close | 18,872.64 | 19.72 | Yes! The Close is close to the Weekly Pivot. |
| 61.8% Down from Intraday High | 18,968.13 | 95.48 | |
| Daily Pivot | 18,971.08 | 2.96 | Yes! The Daily Pivot is close to the 61.8% Down from Intraday High. |
| Open | 19,002.94 | 31.86 | Yes! The Open is close to the Daily Pivot. |
| 50% Down from Intraday High | 19,020.30 | 17.37 | Yes! The 50% Down from Intraday High is close to the Open. |
| 38.2% Down from Intraday High | 19,072.49 | 52.18 | |
| Daily R1 | 19,142.97 | 70.48 | |
| Weekly R1 | 19,233.14 | 90.17 | |
| High | 19,241.41 | 8.27 | Yes! The High is close to the Weekly R1. |
| Daily R2 | 19,413.29 | 171.88 | |
| Weekly R2 | 19,593.63 | 180.34 | |
| Monthly R1 | 20,162.26 | 568.63 | |
| Monthly R2 | 21,451.89 | 1,289.62 |

This is a picture of the chart pattern indicator on the daily scale. The indicator is the line chart below a chart of the S&P 500 composite.
With today's (Tuesday's) move lower in the market, it pulled the CPI down to the neutral zone. That's shown on the chart with the white bar.
The drop could be the start of a retrace that I've been expecting for a while now. A week ago, for example, I discussed bearish divergence between the CPI line and the index. That divergence suggested the index would drop. And it will. Guaranteed. Sometime. Maybe this is the start of the decline.
The CPI reading is 60.9, which is neutral, as I mentioned. You can see the blue indicator line near the bottom of the chart, how it has been trending lower for a few days. The downtrend hints of weakness.
Of course, something like two days after I mentioned the divergence in my blog, the CPI spiked, so the divergence is still there but it has a flat CPI line (which was trending down before the spike) even as the index has continued to rise.
It's possible the index will continue higher. But it will drop eventually. When and by how much are not known, though.
$ $ $
Here's a symbol list of 103 chart and candlestick patterns (13 "investment grade" candle patterns) found in today's securities using my version of Patternz: MMM, ANF, AMD, AES, ALB, APOG, AVY, BOOT, BMY, CBT, CHKP, CVX, CLNE, CNO, CCRN, ^DJU, D, EBAY, EME, EOG, EXPD, FFIV, FDX, FIVN, FRD, GIS, GILD, HBI, HQY, HP, HSY, HOV, HUN, HURC, IBP, IPI, KELYA, KFRC, KMB, KSS, LEG, LLY, MRTN, MRK, MLKN, MLI, NBR, NOC, NUS, OXY, OLN, OTEX, OMI, PFE, PINC, DGX, RLI, RCKY, SAIA, SAND, SMG, SHW, SLGN, STR, SCCO, SCS, TRGP, TDOC, TDC, TEVA, UHAL, UIS, VEEV, WERN, WLK, WMB, IDU, FXI, BOTZ, IEV, ITB, EWK, EWQ, EWG, EWH, EWI, EWJ, EWP, EWL, EWU, IBB, DBA, PBE, PJP, XLP, XHB, UNG. Click this link for details (pattern type, start and end dates).
For a list of small patterns (those a few days wide) click this link.
-- Thomas Bulkowski, author: Invest for Two-Comma Wealth and the novel (fiction), Orb Foresight (#Ad)
![]()
$ $ $
I show another slider trading quiz featuring Tredegar v2: TG stock.
$ $ $
Here's a symbol list of 74 chart and candlestick patterns (13 "investment grade" candle patterns) found in today's securities using my version of Patternz: MMM, ACIW, ADTN, AIG, ANET, AZTA, BAH, BCO, CALM, CX, COR, CENX, CDAY, CTAS, CSCO, CGNX, CL, CMCO, CROX, EVH, FFIV, FNV, GD, GES, HTLD, HSII, HP, HOLX, HUM, HURC, JAZZ, KMB, KLAC, LHX, LEG, RAMP, NBR, PFE, PINC, PGR, QCOM, DGX, ROP, ROST, SAND, SAIC, SWX, SXI, SNPS, TZOO, TREX, MDRX, WLK, QTEC, IYZ, IEV, IYF, EWK, EWQ, EWG, EIS, EWI, EWM, EWP, EWD, EWL, TUR, DBA, PBE, XLF, GLD, UNG, USO. Click this link for details (pattern type, start and end dates).
For a list of small patterns (those a few days wide) click this link.
$ $ $
The following table shows where Fibonacci retrace values of the day's high-low range are plus pivot points, calculated on the Dow industrials, sorted by value. When several are near each other (small differences), the area might act as support or resistance.
-- Thomas Bulkowski, author: Invest for Two-Comma Wealth and the novel (fiction), Orb Foresight (#Ad)
![]()
| © 2025 ThePatternSite.com Metric | Value | Diff | Close (within 10% of the high-low range for the day)? |
| Monthly S2 | 36,262.45 | ||
| Monthly S1 | 39,527.26 | 3,264.81 | |
| Monthly Pivot | 41,095.47 | 1,568.21 | |
| Weekly S2 | 41,525.54 | 430.07 | |
| Daily S2 | 42,152.94 | 627.40 | |
| Weekly S1 | 42,158.80 | 5.86 | Yes! The Weekly S1 is close to the Daily S2. |
| Low | 42,337.71 | 178.91 | |
| Weekly Pivot | 42,411.24 | 73.53 | |
| Daily S1 | 42,472.51 | 61.27 | |
| 61.8% Down from Intraday High | 42,530.36 | 57.86 | |
| Open | 42,542.81 | 12.45 | Yes! The Open is close to the 61.8% Down from Intraday High. |
| 50% Down from Intraday High | 42,589.88 | 47.07 | Yes! The 50% Down from Intraday High is close to the Open. |
| 38.2% Down from Intraday High | 42,649.39 | 59.51 | |
| Daily Pivot | 42,657.27 | 7.89 | Yes! The Daily Pivot is close to the 38.2% Down from Intraday High. |
| Close | 42,792.07 | 134.80 | |
| High | 42,842.04 | 49.97 | Yes! The High is close to the Close. |
| Daily R1 | 42,976.84 | 134.80 | |
| Weekly R1 | 43,044.51 | 67.67 | |
| Daily R2 | 43,161.60 | 117.09 | |
| Weekly R2 | 43,296.94 | 135.34 | |
| Monthly R1 | 44,360.28 | 1,063.34 | |
| Monthly R2 | 45,928.49 | 1,568.21 |

I show the Nasdaq composite on the daily scale.
ABC is a triple top, denoted by peaks A, B, and C.
But there's another interpretation, that of an inverted roof. I show that outlined in green.
The pattern turned bearish when the index tumbled after the pattern completed.
The two red lines that slope upward on the far right of the chart show a slope that's not sustainable. That means look for the index to drop (retrace the prior gain).
![]()
The following is a brief review of how the markets performed over time. The numbers refer to the close-to-close move in the Dow industrials.
No options expire this week.
![]()
The following is based on an SFO article in December 2004 by John Seekinger, titled, "Take a two-dimensional approach." He offers these tips.
| Index | S2 | S1 | Pivot | R1 | R2 |
| Dow Industrials (^DJI): Daily | 42,086 | 42,370 | 42,517 | 42,801 | 42,948 |
| Weekly | 41,480 | 42,067 | 42,365 | 42,953 | 43,251 |
| Monthly | 36,217 | 39,436 | 41,050 | 44,269 | 45,883 |
| S&P500 (^GSPC): Daily | 5,890 | 5,924 | 5,941 | 5,976 | 5,993 |
| Weekly | 5,728 | 5,843 | 5,901 | 6,016 | 6,074 |
| Monthly | 4,816 | 5,387 | 5,673 | 6,244 | 6,530 |
| Nasdaq (^IXIC): Daily | 18,979 | 19,095 | 19,154 | 19,270 | 19,329 |
| Weekly | 18,225 | 18,718 | 18,966 | 19,459 | 19,706 |
| Monthly | 14,509 | 16,860 | 18,037 | 20,388 | 21,565 |
Here are the formulas:
![]()
Earnings season is either underway or should be starting soon. The sessions could be more volatile.
Here's a symbol list of 88 chart and candlestick patterns (13 "investment grade" candle patterns) found in today's securities using my version of Patternz: ANF, ADBE, ADTN, AES, APD, AMZN, AEO, AFG, APA, ATR, ARW, AZTA, BIO, CALM, CX, CNP, CENX, CDAY, CI, CTAS, CTSH, ELV, EVH, EXPD, FFIV, FMC, FORM, FCX, GD, GNW, GS, GGG, GES, HTLD, HSY, HOLX, IEX, TILE, JAZZ, KLAC, KSS, LZB, MGY, MLM, MA, MTDR, MTRN, MU, JWN, NTNX, PFE, PLXS, PINC, DGX, ROP, ROST, SCHW, SAIC, SEE, SIGI, STR, TGT, TZOO, VLO, VMC, XEL, IYM, IHE, DDM, FXI, IYZ, IYF, IHI, EWP, THD, TUR, DBA, PEJ, XLF, GLD, XLB, XRT, USO, VAW. Click this link for details (pattern type, start and end dates).
For a list of small patterns (those a few days wide) click this link.
The below industries were the best (rank 1) or worst performing of those I follow.
|
-- Thomas Bulkowski, author: Invest for Two-Comma Wealth and the novel (fiction), Orb Foresight (#Ad)
![]()
Here's a symbol list of 111 chart and candlestick patterns (13 "investment grade" candle patterns) found in today's securities using my version of Patternz: DDD, ABT, ANF, ACN, AFL, ALB, AMZN, AMED, AFG, AME, AON, ATR, ADM, AGO, AVY, AZTA, BOOT, BR, CACI, CALM, CX, CENX, CDAY, CRL, CVX, CTAS, CSCO, CNA, CMTL, CAG, CSGP, CR, CRH, DHR, ^DJI, ELV, EPAM, EVH, FDX, FCX, GD, GE, GNW, HTLD, HP, HOLX, HUM, TILE, JNJ, KEYS, KSS, LMT, LOW, MLM, MA, MCO, MOS, MUR, NEE, NKE, NOC, NUS, OXY, ORI, OLN, PANW, PTEN, PFE, PCG, PINC, QTWO, RJF, ROP, ROST, ^GSPC, SEIC, SRE, SXI, SRDX, TXN, TRV, TZOO, UNH, VFC, VEEV, WSM, ITA, IYK, ICF, IHF, IYZ, IGE, IYF, EWJ, EWS, EZA, EWL, THD, TUR, DBA, PJP, SSO, XLP, XLF, GLD, SPY, UNG, USO, VHT. Click this link for details (pattern type, start and end dates).
For a list of small patterns (those a few days wide) click this link.
$ $ $
You can find setups based on a Fibonacci retrace by clicking on the link.
The following patterns were found manually, not using Patternz. Mr. Bulkowski has excluded any securities he owns from appearing in the list. However, he may add any of the securities listed to his portfolio at any time, just as you can.
In the table below, the red and green colors are based on the historical breakout direction for the associated chart pattern. If a high and tight flag appears, the start and end dates highlight the flagpole only and not the flag.
For details about the chart patterns, click here.
-- Thomas Bulkowski, author: Invest for Two-Comma Wealth and the novel (fiction), Foresight (#Ad)
![]()
| Symbol | Chart Pattern | Bullish Bearish | Start | End | Industry |
| DDD | Dead-cat bounce | 05/13/2025 | 05/13/2025 | Electronics | |
| ADTN | Double Bottom, Eve and Adam | 04/07/2025 | 04/21/2025 | Telecom. Equipment | |
| APD | Double Bottom, Adam and Adam | 04/21/2025 | 05/01/2025 | Chemical (Diversified) | |
| AMZN | Pipe bottom | 03/31/2025 | 04/07/2025 | Internet | |
| AEP | Triple top | 04/17/2025 | 05/06/2025 | Electric Utility (Central) | |
| AXP | Pipe bottom | 03/31/2025 | 04/07/2025 | Financial Services | |
| AMWD | Double Bottom, Eve and Eve | 04/09/2025 | 04/21/2025 | Building Materials | |
| AME | Pipe bottom | 03/31/2025 | 04/07/2025 | Industrial Services | |
| ANIK | Dead-cat bounce | 05/09/2025 | 05/09/2025 | Biotechnology | |
| APA | Ugly double bottom | 04/09/2025 | 05/07/2025 | Petroleum (Producing) | |
| APOG | Double Bottom, Eve and Eve | 04/25/2025 | 05/07/2025 | Building Materials | |
| ADM | Pipe bottom | 03/31/2025 | 04/07/2025 | Food Processing | |
| AVY | Ugly double bottom | 04/08/2025 | 04/30/2025 | Packaging and Container | |
| AVA | Triple top | 04/03/2025 | 05/06/2025 | Electric Utility (West) | |
| BFH | Pipe bottom | 03/31/2025 | 04/07/2025 | Information Services | |
| BCO | Ugly double bottom | 04/09/2025 | 04/30/2025 | Industrial Services | |
| BBW | Pipe bottom | 04/21/2025 | 04/28/2025 | Retail (Special Lines) | |
| CAL | Triple bottom | 04/08/2025 | 05/06/2025 | Shoe | |
| CLS | Flag, high and tight | 04/04/2025 | 05/14/2025 | Electronics | |
| CVX | Double Bottom, Adam and Adam | 04/11/2025 | 04/21/2025 | Petroleum (Integrated) | |
| CLF | Pipe bottom | 03/31/2025 | 04/07/2025 | Metals and Mining (Div.) | |
| ED | Double Top, Eve and Adam | 04/22/2025 | 05/01/2025 | Electric Utility (East) | |
| GLW | Pipe bottom | 03/31/2025 | 04/07/2025 | Telecom. Equipment | |
| CSGS | Pipe bottom | 03/31/2025 | 04/07/2025 | IT Services | |
| CTS | Pipe bottom | 03/31/2025 | 04/07/2025 | Electronics | |
| DDS | Pipe bottom | 03/31/2025 | 04/07/2025 | Retail Store | |
| DOV | Pipe bottom | 03/31/2025 | 04/07/2025 | Machinery | |
| DUK | Double Top, Adam and Adam | 04/17/2025 | 05/06/2025 | Electric Utility (East) | |
| EMN | Double Bottom, Eve and Adam | 04/28/2025 | 05/07/2025 | Chemical (Diversified) | |
| EMR | Pipe bottom | 03/31/2025 | 04/07/2025 | Computers and Peripherals | |
| EQT | Pipe bottom | 03/31/2025 | 04/07/2025 | Natural Gas (Diversified) | |
| EXC | Double Top, Adam and Adam | 04/04/2025 | 04/17/2025 | Electric Utility (East) | |
| XOM | Ugly double bottom | 04/10/2025 | 05/05/2025 | Petroleum (Integrated) | |
| FFIV | Pipe bottom | 03/31/2025 | 04/07/2025 | Internet | |
| FDX | Ugly double bottom | 04/09/2025 | 04/30/2025 | Air Transport | |
| FISV | Dead-cat bounce | 05/15/2025 | 05/15/2025 | IT Services | |
| FIVN | Horn bottom | 04/07/2025 | 04/21/2025 | Computer Software and Svcs | |
| FLS | Pipe bottom | 03/31/2025 | 04/07/2025 | Machinery | |
| FCX | Pipe bottom | 03/31/2025 | 04/07/2025 | Metals and Mining (Div.) | |
| GFS | Double Bottom, Eve and Eve | 04/08/2025 | 04/16/2025 | Semiconductor | |
| GMS | Big W | 03/06/2025 | 04/08/2025 | Cement and Aggregates | |
| GS | Pipe bottom | 03/31/2025 | 04/07/2025 | Securities Brokerage | |
| GFF | Double Bottom, Eve and Adam | 04/09/2025 | 04/21/2025 | Building Materials | |
| HE | Ugly double bottom | 04/09/2025 | 04/25/2025 | Electric Utility (West) | |
| HTLD | Pipe bottom | 04/28/2025 | 05/05/2025 | Trucking/Transp. Leasing | |
| HOV | Ugly double bottom | 04/09/2025 | 04/30/2025 | Homebuilding | |
| HUBG | Triple bottom | 04/21/2025 | 05/06/2025 | Trucking/Transp. Leasing | |
| HUM | Pipe top | 04/07/2025 | 04/14/2025 | Medical Services | |
| INTC | Triangle, symmetrical | 04/24/2025 | 05/07/2025 | Semiconductor | |
| KBH | Ugly double bottom | 04/11/2025 | 04/30/2025 | Homebuilding | |
| KELYA | Double Bottom, Eve and Adam | 04/21/2025 | 05/08/2025 | Human Resources | |
| KEYS | Pipe bottom | 03/31/2025 | 04/07/2025 | Precision Instrument | |
| KLAC | Pipe bottom | 03/31/2025 | 04/07/2025 | Semiconductor Cap Equip. | |
| KLIC | Pipe bottom | 03/31/2025 | 04/07/2025 | Semiconductor Cap Equip. | |
| LEN | Ugly double bottom | 04/09/2025 | 04/30/2025 | Homebuilding | |
| LPLA | Pipe bottom | 03/31/2025 | 04/07/2025 | Securities Brokerage | |
| MRTN | Triple bottom | 04/09/2025 | 04/30/2025 | Trucking/Transp. Leasing | |
| MAS | Horn bottom | 04/07/2025 | 04/21/2025 | Building Materials | |
| MTDR | Ugly double bottom | 04/09/2025 | 04/30/2025 | Petroleum (Producing) | |
| MGEE | Triangle, ascending | 04/07/2025 | 05/15/2025 | Electric Utility (Central) | |
| MU | Pipe bottom | 03/31/2025 | 04/07/2025 | Semiconductor | |
| MCO | Pipe bottom | 03/31/2025 | 04/07/2025 | Information Services | |
| MS | Pipe bottom | 03/31/2025 | 04/07/2025 | Securities Brokerage | |
| MLI | Double Bottom, Eve and Adam | 04/07/2025 | 04/21/2025 | Metal Fabricating | |
| NOV | Ugly double bottom | 04/08/2025 | 04/30/2025 | Oilfield Svcs/Equipment | |
| NJR | Double Top, Eve and Adam | 04/17/2025 | 05/06/2025 | Natural Gas (Distributor) | |
| NWL | Triple bottom | 04/09/2025 | 04/30/2025 | Household Products | |
| JWN | Pipe bottom | 03/31/2025 | 04/07/2025 | Retail Store | |
| NOVT | Double Bottom, Adam and Adam | 04/07/2025 | 05/06/2025 | Precision Instrument | |
| NUS | Ugly double bottom | 04/21/2025 | 05/06/2025 | Toiletries/Cosmetics | |
| OUT | Ugly double bottom | 04/09/2025 | 05/09/2025 | Advertising | |
| PKE | Double Bottom, Adam and Eve | 04/21/2025 | 05/06/2025 | Chemical (Specialty) | |
| PEN | Double Top, Eve and Adam | 04/25/2025 | 05/09/2025 | Medical Supplies | |
| PFE | Pipe top | 04/28/2025 | 05/05/2025 | Drug | |
| PLXS | Pipe bottom | 03/31/2025 | 04/07/2025 | Electronics | |
| PFG | Horn bottom | 04/07/2025 | 04/21/2025 | Insurance (Diversified) | |
| QTWO | Pipe bottom | 03/31/2025 | 04/07/2025 | E-Commerce | |
| QCOM | Ugly double bottom | 04/07/2025 | 05/01/2025 | Telecom. Equipment | |
| RMBS | Pipe bottom | 03/31/2025 | 04/07/2025 | Semiconductor Cap Equip. | |
| RTX | Double Bottom, Adam and Adam | 04/07/2025 | 04/22/2025 | Aerospace/Defense | |
| RGLD | Pipe top | 04/14/2025 | 04/21/2025 | Metals and Mining (Div.) | |
| R | Pipe bottom | 03/31/2025 | 04/07/2025 | Trucking/Transp. Leasing | |
| SBH | Double Bottom, Adam and Eve | 04/09/2025 | 04/25/2025 | Toiletries/Cosmetics | |
| SHOP | Pipe bottom | 03/31/2025 | 04/07/2025 | E-Commerce | |
| SGI | Pipe bottom | 03/31/2025 | 04/07/2025 | Furn/Home Furnishings | |
| SO | Triple top | 04/17/2025 | 05/07/2025 | Electric Utility (East) | |
| SR | Head-and-shoulders top | 03/20/2025 | 04/17/2025 | Natural Gas (Distributor) | |
| SSYS | Pipe bottom | 03/31/2025 | 04/07/2025 | Electronics | |
| TGT | Ugly double bottom | 04/08/2025 | 05/06/2025 | Retail Store | |
| TDOC | Head-and-shoulders bottom | 04/07/2025 | 05/01/2025 | Healthcare Information | |
| TXT | Pipe bottom | 03/31/2025 | 04/07/2025 | Diversified Co. | |
| TTD | Pipe bottom | 03/31/2025 | 04/07/2025 | Advertising | |
| TG | Double Bottom, Adam and Eve | 03/11/2025 | 04/07/2025 | Chemical (Specialty) | |
| TREX | Pipe bottom | 03/31/2025 | 04/07/2025 | Building Materials | |
| WPM | Double Top, Eve and Eve | 04/21/2025 | 05/09/2025 | Metals and Mining (Div.) | |
| WSC | Pipe bottom | 03/31/2025 | 04/07/2025 | Industrial Services | |
| WOLF | Dead-cat bounce | 05/09/2025 | 05/09/2025 | Semiconductor |
![]()
$ $ $
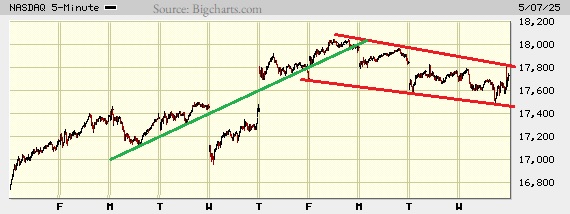
I show a picture of the Nasdaq composite on the 5-minute scale.
There's not much to discuss in the chart.
Pattern A is called a falling wedge. It has two down-sloping trendlines that converge. Most of the time (68%), the breakout is upward. An upward breakout happens when the index closes above the top trendline. We see an upward breakout here, near B.
B points to a common retrace that I call a throwback. It happens when price returns to the breakout price within a week.
Line C is a trendline drawn below the valleys. Given its slope, not too steep and not too shallow, it could continue going higher for quite some time. However, the general market is weakening, so I expect the uptrend to stop soon.
$ $ $
Here's a symbol list of 132 chart and candlestick patterns (13 "investment grade" candle patterns) found in today's securities using my version of Patternz: DDD, ADTN, AMD, ALB, ALGT, AMZN, AEP, ANIK, APOG, ADM, AVA, AZTA, BSET, BZH, BRKR, CPB, CLS, CX, CENX, CDAY, CRL, CGNX, CTSH, ED, CXW, GLW, CRH, CTS, DHR, ELV, EFX, EVH, EXC, FICO, FARO, FLEX, FDP, GME, GIS, GPRO, GGG, THG, HLIT, HIG, HTLD, HL, HOLX, HD, HUM, HURC, ITW, PODD, JKHY, KALU, K, LH, L, LOW, NTGR, NOC, NVDA, OMCL, ASGN, PKG, PAYX, PFE, PNW, PLXS, POR, PPG, PINC, PGR, PSTG, QTWO, REGN, RCKY, ROST, RGLD, R, SEE, SO, SR, TZOO, UHAL, UPS, UNH, UNM, VEEV, WPM, FXI, IHF, IYZ, IEV, SLV, IHI, EWO, EWC, ECH, EEM, EWG, EWH, EWI, EWJ, EWM, EWY, EWP, TUR, EWU, PPA, PEJ, PHO, XLP, XLF, GLD, USO. Click this link for details (pattern type, start and end dates).
For a list of small patterns (those a few days wide) click this link.
$ $ $
The following table shows where Fibonacci retrace values of the day's high-low range are plus pivot points, calculated on the Nasdaq composite, sorted by value. When several are near each other (small differences), the area might act as support or resistance.
-- Thomas Bulkowski, author: Invest for Two-Comma Wealth and the novel (fiction), Orb Foresight (#Ad)
![]()
| © 2025 ThePatternSite.com Metric | Value | Diff | Close (within 10% of the high-low range for the day)? |
| Monthly S2 | 14,030.31 | ||
| Monthly S1 | 16,588.56 | 2,558.25 | |
| Monthly Pivot | 17,342.28 | 753.72 | |
| Weekly S2 | 17,655.62 | 313.34 | |
| Weekly Pivot | 18,248.61 | 592.99 | |
| Weekly S1 | 18,401.21 | 152.61 | |
| Weekly R2 | 18,841.60 | 440.38 | |
| Daily S2 | 18,963.38 | 121.79 | |
| Weekly R1 | 18,994.20 | 30.82 | |
| Low | 19,023.61 | 29.41 | |
| Daily S1 | 19,055.10 | 31.49 | |
| Open | 19,074.72 | 19.63 | |
| 61.8% Down from Intraday High | 19,081.65 | 6.93 | Yes! The 61.8% Down from Intraday High is close to the Open. |
| 50% Down from Intraday High | 19,099.58 | 17.93 | |
| Daily Pivot | 19,115.32 | 15.74 | |
| 38.2% Down from Intraday High | 19,117.51 | 2.19 | Yes! The 38.2% Down from Intraday High is close to the Daily Pivot. |
| Close | 19,146.81 | 29.30 | |
| High | 19,175.55 | 28.74 | |
| Daily R1 | 19,207.04 | 31.49 | |
| Daily R2 | 19,267.26 | 60.23 | |
| Monthly R1 | 19,900.53 | 633.27 | |
| Monthly R2 | 20,654.25 | 753.72 |
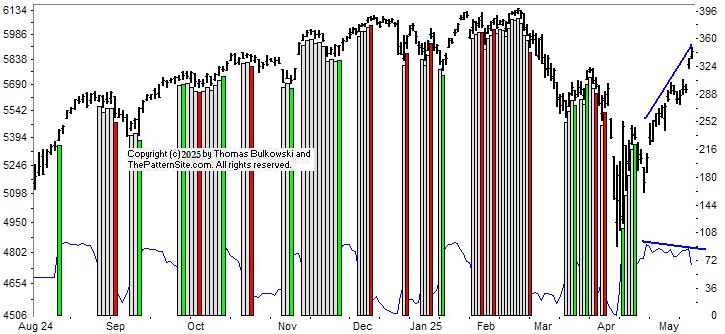
This is a picture of the chart pattern indicator on the daily scale. The indicator is the line chart below a chart of the S&P 500 composite.
The CPI is bullish as shown by the vertical green bar on the far right of the chart. It's been bullish for about 3 weeks now.
However, look at the trend of the indicator versus the index. A line drawn along the peaks on the CPI line shows a slight downward trend. A line drawn along the peaks in the index shows a rising trend.
That's called bearish divergence. The two indicators diverge (one slopes up and one down). The theory is that the index will follow the CPI down.
I think that's likely. The index has been moving higher for too long. It's overextended and it needs to pause for a time before resuming the uptrend. So that's what I anticipate, a retrace-rise move.
Using the right scale (which is for the CPI, but I'm using it only as a reference), I expect a drop back to 288, which is where a knot appears. That should support price.
$ $ $
Here's a symbol list of 147 chart and candlestick patterns (13 "investment grade" candle patterns) found in today's securities using my version of Patternz: DDD, AES, ALGT, AEP, APOG, AAPL, ATR, AVY, AVA, AXS, AZTA, BA, BRKR, CPB, CLS, CX, CENX, CDAY, CI, CTAS, CTSH, CL, ED, CTS, ^DJI, D, DOV, DUK, EXP, ELV, EFX, EQT, EVRG, EVH, EXC, EXPD, FFIV, FARO, FISV, FWRD, FNV, FDP, GME, GD, GIS, GGG, THG, HIG, HTLD, HP, HSY, HOLX, HD, HUM, HURC, IDA, ITW, IPAR, JKHY, KALU, KBH, KEYS, LHX, L, LOW, MA, META, ^IXIC, NVDA, OGE, ASGN, ORCL, PFE, PNW, PLXS, PPG, PPL, PINC, PRU, RGS, ROP, ROST, SAIA, SAND, SIGI, SCI, SO, SWX, SR, SCS, SRDX, TER, TDG, UHAL, UPS, UNH, WPM, WOLF, IYK, FTEC, FDN, FXL, BOTZ, QQQ, IHF, IYZ, IGV, IHI, EWA, EWZ, EWQ, EWI, EWM, EWS, EZA, EWY, THD, TUR, QLD, DBA, PEJ, PHO, XLP, GLD, XLI, XLK, USO, VIS, MGK, VONG. Click this link for details (pattern type, start and end dates).
For a list of small patterns (those a few days wide) click this link.
-- Thomas Bulkowski, author: Invest for Two-Comma Wealth and the novel (fiction), Orb Foresight (#Ad)
![]()
$ $ $
I show another slider trading quiz featuring Trex: (TREX) stock.
$ $ $
Here's a symbol list of 390 chart and candlestick patterns (13 "investment grade" candle patterns) found in today's securities using my version of Patternz: MMM, ANF, ACN, ACIW, AYI, ADBE, ADTN, AEIS, AMD, AES, A, APD, ALK, AA, ALGT, ALL, AMZN, AEO, AEP, AXP, AMWD, AME, AMGN, APH, ANIK, AR, APA, APOG, AAPL, AMAT, ARCB, ANET, AWI, ARW, ASH, ADSK, ADP, AVY, AVNT, AVA, AXS, BCPC, BALL, BSET, BAX, BZH, BBY, BKNG, BOOT, BRC, BFH, BBW, BLDR, CBT, CAL, CPB, CE, COR, CHKP, CVX, CIEN, CI, CSCO, CNO, CNX, CGNX, CTSH, CL, CMCO, ED, COP, GLW, CSGP, CR, CRH, CROX, CTS, CMI, DHR, XRAY, DVN, FANG, DDS, DFS, DSGR, ^DJT, ^DJI, DOV, DUK, EXP, EMN, EME, EMR, EOG, EPAM, EFX, EL, EVRG, EXC, EXPD, XOM, FFIV, FARO, FDX, FISV, FLEX, FLS, FMC, FORM, FTV, FWRD, FNV, FCX, FDP, IT, GD, GNW, GPN, GFS, GL, GS, GGG, GES, HBI, HLIT, HQY, HTLD, HELE, HSIC, HSY, HNI, HD, HON, DHI, HOV, HUBG, JBHT, IDA, IEX, IDXX, ITW, INCY, IIIN, INTC, IBKR, TILE, IPG, IPI, ISRG, KALU, KBH, KMT, KEYS, KMB, KLAC, KSS, LHX, LZB, LRCX, LAMR, LEG, LEN, LNC, RAMP, LOW, LPLA, LXU, MHO, M, MGY, MANH, MAN, MRTN, MLM, MAS, MA, MTDR, META, MU, MLKN, MCO, MS, MLI, MUR, NBR, ^IXIC, NOV, NFLX, NTAP, NWL, NEU, NKE, NI, JWN, NOVT, NTNX, NVDA, OXY, OGE, OLN, OMCL, OMC, ON, ORCL, OXM, PKE, PATK, PTEN, PAYX, PYPL, PNW, PLXS, PPG, PPL, PINC, PFG, PG, PRU, PHM, PSTG, QTWO, KWR, QCOM, RL, RMBS, RRC, RJF, REGN, RGA, RHI, ROK, ROG, ROP, ROST, RES, R, ^GSPC, CRM, SBH, SLB, SMG, SEE, SEIC, SMTC, NOW, SHW, STR, SKX, SKYW, SO, SCCO, SR, SPSC, SXI, SCS, SRDX, SNPS, TPR, TGT, TECH, TDOC, TDC, TER, TXN, TXT, TMO, TKR, TJX, TOL, TSCO, TDG, RIG, TZOO, TREX, TWLO, UHAL, UGI, UPS, VFC, VLO, V, VC, VMC, WAT, WERN, WU, WLK, WEX, WSM, WSC, WDAY, ZBRA, IYM, IAI, IYK, IYC, IYE, IEZ, IHE, IDU, DDM, FTEC, FDN, QTEC, FXL, FXI, BOTZ, QQQ, ICF, IAT, IYZ, IGV, IXC, MXI, IXN, SOXX, IGE, IEO, IYF, ITB, IHI, EWZ, EEM, EWH, EPP, EWY, EWD, EWT, TUR, QLD, PBE, PEJ, PXJ, PJP, PHO, SSO, ROBO, XLY, XLE, XLF, XHB, XLI, XLB, XRT, SPY, XLK, USO, SMH, VIS, VAW, MGK, VONG. Click this link for details (pattern type, start and end dates).
For a list of small patterns (those a few days wide) click this link.
$ $ $
The following table shows where Fibonacci retrace values of the day's high-low range are plus pivot points, calculated on the Dow industrials, sorted by value. When several are near each other (small differences), the area might act as support or resistance.
-- Thomas Bulkowski, author: Invest for Two-Comma Wealth and the novel (fiction), Orb Foresight (#Ad)
![]()
| © 2025 ThePatternSite.com Metric | Value | Diff | Close (within 10% of the high-low range for the day)? |
| Monthly S2 | 35,103.59 | ||
| Monthly S1 | 38,756.85 | 3,653.25 | |
| Monthly Pivot | 40,265.04 | 1,508.19 | |
| Weekly S2 | 40,633.77 | 368.73 | |
| Weekly S1 | 41,521.93 | 888.17 | |
| Weekly Pivot | 41,647.58 | 125.64 | |
| Daily S2 | 41,723.40 | 75.82 | |
| Low | 41,899.05 | 175.65 | |
| Open | 41,899.05 | 0.00 | Yes! The Open is close to the Low. |
| Daily S1 | 42,066.75 | 167.70 | |
| 61.8% Down from Intraday High | 42,097.31 | 30.56 | Yes! The 61.8% Down from Intraday High is close to the Daily S1. |
| 50% Down from Intraday High | 42,158.55 | 61.24 | |
| 38.2% Down from Intraday High | 42,219.79 | 61.24 | |
| Daily Pivot | 42,242.40 | 22.61 | Yes! The Daily Pivot is close to the 38.2% Down from Intraday High. |
| Close | 42,410.10 | 167.70 | |
| High | 42,418.05 | 7.95 | Yes! The High is close to the Close. |
| Weekly R1 | 42,535.74 | 117.69 | |
| Daily R1 | 42,585.75 | 50.01 | Yes! The Daily R1 is close to the Weekly R1. |
| Weekly R2 | 42,661.39 | 75.64 | |
| Daily R2 | 42,761.40 | 100.01 | |
| Monthly R1 | 43,918.29 | 1,156.89 | |
| Monthly R2 | 45,426.47 | 1,508.19 |
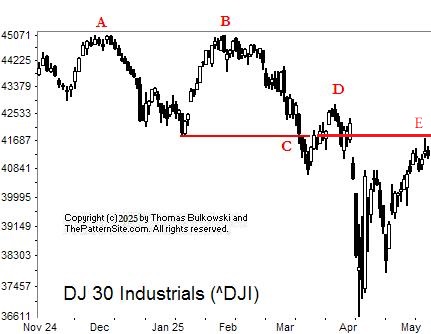
I show the Dow industrials on the daily scale.
A double top appears at AB which confirms as a valid chart pattern when the index closes below C. If the index doesn't close below C, then you do not have a double top. You are just looking at squiggles on the chart.
At D, the index retraces a portion of the decline. That retrace has a name: Pullback.
A pullback happens after a downward breakout from a chart pattern. The index or stock returns, or comes close to, the breakout price. The breakout price in this case, is C, the red line, which is the lowest low between the two peaks (AB).
Notice at E, that the index has reached the level of line C. It suggests that the index has climbed to a resistance level, so I'd expect the Dow to drop.
![]()
The following is a brief review of how the markets performed over time. The numbers refer to the close-to-close move in the Dow industrials.
Many options expire this week, so traders will be looking to close out their positions, and that suggests increased volatility (large daily price swings).
![]()
The following is based on an SFO article in December 2004 by John Seekinger, titled, "Take a two-dimensional approach." He offers these tips.
| Index | S2 | S1 | Pivot | R1 | R2 |
| Dow Industrials (^DJI): Daily | 40,942 | 41,096 | 41,304 | 41,458 | 41,666 |
| Weekly | 40,247 | 40,748 | 41,261 | 41,762 | 42,274 |
| Monthly | 34,717 | 37,983 | 39,878 | 43,144 | 45,040 |
| S&P500 (^GSPC): Daily | 5,618 | 5,639 | 5,665 | 5,686 | 5,713 |
| Weekly | 5,511 | 5,586 | 5,653 | 5,727 | 5,794 |
| Monthly | 4,520 | 5,090 | 5,405 | 5,975 | 6,290 |
| Nasdaq (^IXIC): Daily | 17,735 | 17,832 | 17,951 | 18,047 | 18,166 |
| Weekly | 17,250 | 17,589 | 17,843 | 18,182 | 18,436 |
| Monthly | 13,624 | 15,777 | 16,936 | 19,089 | 20,248 |
Here are the formulas:
![]()
Earnings season is either underway or should be starting soon. The sessions could be more volatile.
Here's a symbol list of 141 chart and candlestick patterns (13 "investment grade" candle patterns) found in today's securities using my version of Patternz: ACIW, ADBE, A, ALK, AA, ALKS, AMGN, AMN, ANIK, AR, AON, AVA, AXS, BCPC, BAX, BBY, BSX, BBW, CX, CNC, CNP, CHKP, CLNE, CLF, CLX, CNO, CNX, CL, ED, CSGP, DVN, DFS, ^DJI, EPAM, EVRG, EVH, EXC, EXPD, FFIV, FICO, FAST, FLEX, FMC, FTNT, FNV, FRD, GL, GPRO, GFF, HE, DHI, HUM, IDA, ITW, PODD, IPG, KBH, KLAC, LH, LEN, LLY, LPLA, M, MANH, MTRX, MLKN, MUR, NOV, NTAP, NJR, OMC, OUT, PANW, PKE, PAYX, PNW, PPL, PINC, DGX, RRC, ROP, ^GSPC, CRM, SBH, SMG, SCCO, SPSC, TRGP, TEVA, TXN, TTD, RIG, TREX, WAT, WU, WPM, WOLF, WWW, WDAY, IHE, DDM, FDN, IYH, IEV, ITB, EWZ, ECH, EWG, EWH, EIS, EWI, EPP, EWS, EZA, EWY, EWP, EWT, THD, TUR, EWU, IBB, PBE, PEJ, PJP, XAR, UNG. Click this link for details (pattern type, start and end dates).
For a list of small patterns (those a few days wide) click this link.
The below industries were the best (rank 1) or worst performing of those I follow.
|
-- Thomas Bulkowski, author: Invest for Two-Comma Wealth and the novel (fiction), Orb Foresight (#Ad)
![]()
Here's a symbol list of 162 chart and candlestick patterns (13 "investment grade" candle patterns) found in today's securities using my version of Patternz: AYI, ADBE, ALK, AEO, AME, AMGN, AON, APOG, AMAT, ARW, ASH, ADP, AVY, AVA, AXS, BCPC, BSX, BBW, CPB, CX, CHKP, CTAS, CLNE, CLF, CNO, CNX, ED, CR, CROX, CSGS, DECK, DVN, FANG, DOV, EBAY, EOG, EPAM, EFX, EQT, EXC, EXPI, FFIV, FIS, FIVN, FLEX, FMC, FWRD, GL, GS, GPRO, HBI, HSII, HSY, PODD, IBKR, TILE, IRM, JAZZ, KEYS, KFRC, LHX, LEN, LLY, RAMP, LOW, MTSI, MAN, MKTX, MA, MGEE, MU, MLKN, MUR, MYGN, NFG, NJR, NKE, NWPX, OGE, ORI, OR, OUT, OMI, PAYX, PCTY, PYPL, PETS, PNW, PINC, PRU, QTWO, QCOM, RL, RRC, RJF, REGN, ROP, ROST, SEE, SEIC, SKYW, SCCO, SSYS, TER, TTD, TJX, TG, TWLO, UGI, VFC, VECO, VRTX, V, WAT, WSO, WU, WWW, WDAY, ITA, IAI, IEZ, IDU, QTEC, FXL, FXI, ICF, IGV, IXN, ILF, SLV, IGE, IEO, IYF, EWK, EWG, EIS, EWI, EWJ, EWW, EWD, TUR, PPA, PEJ, ROBO, XLP, XLF, XLI, XAR, XLU, UNG, VIS, VAW. Click this link for details (pattern type, start and end dates).
For a list of small patterns (those a few days wide) click this link.
$ $ $
You can find setups based on a Fibonacci retrace by clicking on the link.
The following patterns were found manually, not using Patternz. Mr. Bulkowski has excluded any securities he owns from appearing in the list. However, he may add any of the securities listed to his portfolio at any time, just as you can.
In the table below, the red and green colors are based on the historical breakout direction for the associated chart pattern. If a high and tight flag appears, the start and end dates highlight the flagpole only and not the flag.
For details about the chart patterns, click here.
-- Thomas Bulkowski, author: Invest for Two-Comma Wealth and the novel (fiction), Foresight (#Ad)
![]()
| Symbol | Chart Pattern | Bullish Bearish | Start | End | Industry |
| DDD | Triple bottom | 04/04/2025 | 04/30/2025 | Electronics | |
| MMM | Double Bottom, Eve and Adam | 04/07/2025 | 04/21/2025 | Diversified Co. | |
| ANF | Double Bottom, Adam and Adam | 04/30/2025 | 05/06/2025 | Apparel | |
| ACN | Horn bottom | 04/07/2025 | 04/21/2025 | IT Services | |
| AEIS | Pipe bottom | 03/31/2025 | 04/07/2025 | Semiconductor | |
| AES | Head-and-shoulders bottom | 04/09/2025 | 05/01/2025 | Electric Utility (East) | |
| ALRM | Horn bottom | 04/07/2025 | 04/21/2025 | Computer Software and Svcs | |
| ALK | Horn bottom | 04/07/2025 | 04/21/2025 | Air Transport | |
| AA | Triangle, ascending | 04/09/2025 | 05/08/2025 | Aerospace/Defense | |
| ALGT | Double Bottom, Eve and Adam | 04/07/2025 | 04/22/2025 | Air Transport | |
| AIG | Double Bottom, Adam and Adam | 04/21/2025 | 05/02/2025 | Insurance (Prop/Casualty) | |
| AMAT | Pipe bottom | 03/31/2025 | 04/07/2025 | Semiconductor Cap Equip. | |
| ASH | Pipe top | 04/21/2025 | 04/28/2025 | Chemical (Basic) | |
| AZTA | Double Bottom, Eve and Adam | 04/21/2025 | 05/07/2025 | Semiconductor Cap Equip. | |
| BCPC | Double Bottom, Adam and Adam | 04/09/2025 | 04/24/2025 | Chemical (Specialty) | |
| BIIB | Ugly double bottom | 04/09/2025 | 04/29/2025 | Biotechnology | |
| BSX | Pipe bottom | 03/31/2025 | 04/07/2025 | Medical Services | |
| CENX | Double Top, Adam and Adam | 04/23/2025 | 05/02/2025 | Metals and Mining (Div.) | |
| CHKP | Pipe bottom | 04/21/2025 | 04/28/2025 | E-Commerce | |
| CINF | Horn bottom | 04/07/2025 | 04/21/2025 | Insurance (Prop/Casualty) | |
| CTAS | Ugly double bottom | 04/07/2025 | 04/21/2025 | Industrial Services | |
| CNX | Pipe bottom | 04/21/2025 | 04/28/2025 | Natural Gas (Diversified) | |
| COST | Ugly double bottom | 04/07/2025 | 04/21/2025 | Retail Store | |
| CSGS | Ugly double bottom | 04/07/2025 | 04/25/2025 | IT Services | |
| DVN | Double Bottom, Adam and Adam | 04/30/2025 | 05/07/2025 | Natural Gas (Diversified) | |
| DFS | Double Bottom, Adam and Eve | 03/17/2025 | 04/07/2025 | Financial Services | |
| ^DJU | Broadening top | 02/10/2025 | 05/06/2025 | None | |
| EXP | Horn bottom | 04/07/2025 | 04/21/2025 | Cement and Aggregates | |
| ELV | Pipe top | 03/31/2025 | 04/07/2025 | Medical Services | |
| EQT | Ugly double bottom | 04/04/2025 | 04/23/2025 | Natural Gas (Diversified) | |
| EVH | Double Bottom, Eve and Eve | 03/05/2025 | 04/21/2025 | Healthcare Information | |
| EXPI | Dead-cat bounce | 05/07/2025 | 05/07/2025 | E-Commerce | |
| FAST | Broadening top | 04/15/2025 | 05/07/2025 | Retail Building Supply | |
| FIVN | Double Bottom, Eve and Adam | 04/09/2025 | 04/21/2025 | Computer Software and Svcs | |
| FMC | Pipe top | 04/21/2025 | 04/28/2025 | Chemical (Basic) | |
| FORM | Pipe bottom | 03/31/2025 | 04/07/2025 | Semiconductor | |
| FWRD | Flag, high and tight | 04/09/2025 | 05/08/2025 | Trucking/Transp. Leasing | |
| FRD | Dead-cat bounce | 05/06/2025 | 05/06/2025 | Building Materials | |
| GAP | Pipe bottom | 03/31/2025 | 04/07/2025 | Apparel | |
| IT | Pipe bottom | 03/31/2025 | 04/07/2025 | IT Services | |
| GE | Pipe bottom | 03/31/2025 | 04/07/2025 | Diversified Co. | |
| HE | Roof, inverted | 04/16/2025 | 05/08/2025 | Electric Utility (West) | |
| HQY | Pipe bottom | 03/31/2025 | 04/07/2025 | Healthcare Information | |
| HSII | Head-and-shoulders bottom | 04/09/2025 | 04/30/2025 | Human Resources | |
| HSIC | Double Bottom, Adam and Adam | 04/21/2025 | 05/05/2025 | Medical Supplies | |
| HNI | Double Bottom, Adam and Adam | 04/09/2025 | 04/21/2025 | Furn/Home Furnishings | |
| JBHT | Head-and-shoulders bottom | 04/09/2025 | 04/30/2025 | Trucking/Transp. Leasing | |
| IBKR | Pipe bottom | 03/31/2025 | 04/07/2025 | Securities Brokerage | |
| TILE | Triangle, symmetrical | 04/02/2025 | 04/30/2025 | Furn/Home Furnishings | |
| ISRG | Pipe bottom | 03/31/2025 | 04/07/2025 | Medical Supplies | |
| JNJ | Triangle, symmetrical | 04/17/2025 | 05/08/2025 | Medical Supplies | |
| KMT | Rising wedge | 04/09/2025 | 05/06/2025 | Metal Fabricating | |
| KSS | Horn top | 05/13/2024 | 05/28/2024 | Retail Store | |
| LZB | Pipe bottom | 03/31/2025 | 04/07/2025 | Furn/Home Furnishings | |
| LRCX | Pipe bottom | 03/31/2025 | 04/07/2025 | Semiconductor Cap Equip. | |
| LAMR | Pipe bottom | 03/31/2025 | 04/07/2025 | Advertising | |
| MTSI | Pipe bottom | 03/31/2025 | 04/07/2025 | Semiconductor | |
| MANH | Pipe bottom | 03/31/2025 | 04/07/2025 | IT Services | |
| MKTX | Triple bottom | 04/23/2025 | 04/30/2025 | Securities Brokerage | |
| MDT | Triangle, symmetrical | 04/09/2025 | 05/02/2025 | Medical Supplies | |
| META | Horn bottom | 04/07/2025 | 04/21/2025 | E-Commerce | |
| MYGN | Dead-cat bounce | 05/07/2025 | 05/07/2025 | Biotechnology | |
| ^IXIC | Pipe bottom | 03/31/2025 | 04/07/2025 | None | |
| NFG | Pipe bottom | 03/31/2025 | 04/07/2025 | Natural Gas (Diversified) | |
| NTGR | Pipe bottom | 03/31/2025 | 04/07/2025 | Telecom. Equipment | |
| NTAP | Pipe bottom | 03/31/2025 | 04/07/2025 | Computers and Peripherals | |
| NI | Ugly double bottom | 04/07/2025 | 04/21/2025 | Electric Utility (Central) | |
| JWN | Ugly double bottom | 04/09/2025 | 04/30/2025 | Retail Store | |
| NTNX | Pipe bottom | 03/31/2025 | 04/07/2025 | E-Commerce | |
| NVDA | Pipe bottom | 03/31/2025 | 04/07/2025 | Semiconductor | |
| OXY | Ugly double bottom | 04/09/2025 | 05/07/2025 | Petroleum (Producing) | |
| OLN | Double Top, Eve and Adam | 04/23/2025 | 05/02/2025 | Chemical (Basic) | |
| OMCL | Dead-cat bounce | 05/06/2025 | 05/06/2025 | Healthcare Information | |
| PAYX | Horn bottom | 04/07/2025 | 04/21/2025 | IT Services | |
| PYPL | Pipe bottom | 03/31/2025 | 04/07/2025 | Financial Services | |
| PETS | Ugly double bottom | 04/09/2025 | 04/30/2025 | Medical Services | |
| PSTG | Pipe bottom | 03/31/2025 | 04/07/2025 | Computers and Peripherals | |
| RL | Pipe bottom | 03/31/2025 | 04/07/2025 | Apparel | |
| RJF | Pipe bottom | 03/31/2025 | 04/07/2025 | Securities Brokerage | |
| ROK | Pipe bottom | 03/31/2025 | 04/07/2025 | Diversified Co. | |
| ROP | Pipe bottom | 04/21/2025 | 04/28/2025 | Industrial Services | |
| R | Triangle, symmetrical | 04/02/2025 | 05/07/2025 | Trucking/Transp. Leasing | |
| CRM | Horn bottom | 04/07/2025 | 04/21/2025 | E-Commerce | |
| SMG | Double Bottom, Eve and Adam | 04/09/2025 | 04/30/2025 | Chemical (Basic) | |
| SEE | Pipe bottom | 03/31/2025 | 04/07/2025 | Packaging and Container | |
| SMTC | Double Bottom, Eve and Adam | 04/08/2025 | 04/21/2025 | Semiconductor Cap Equip. | |
| STR | Pipe bottom | 04/07/2025 | 04/14/2025 | Natural Gas (Diversified) | |
| SKYW | Pipe bottom | 03/31/2025 | 04/07/2025 | Air Transport | |
| LUV | Double Bottom, Eve and Adam | 04/09/2025 | 04/21/2025 | Air Transport | |
| SWX | Ugly double bottom | 04/07/2025 | 04/30/2025 | Natural Gas (Distributor) | |
| SXI | Double Bottom, Eve and Adam | 04/07/2025 | 04/21/2025 | Diversified Co. | |
| SSYS | Double Bottom, Eve and Adam | 04/07/2025 | 04/21/2025 | Electronics | |
| TER | Triangle, symmetrical | 04/09/2025 | 05/08/2025 | Semiconductor Cap Equip. | |
| TXN | Ugly double bottom | 04/11/2025 | 04/30/2025 | Semiconductor | |
| TDG | Pipe bottom | 03/31/2025 | 04/07/2025 | Aerospace/Defense | |
| RIG | Triple bottom | 04/07/2025 | 04/30/2025 | Oilfield Svcs/Equipment | |
| TG | Pipe bottom | 03/31/2025 | 04/07/2025 | Chemical (Specialty) | |
| TREX | Ugly double bottom | 04/09/2025 | 04/30/2025 | Building Materials | |
| TWLO | Pipe bottom | 03/31/2025 | 04/07/2025 | E-Commerce | |
| UGI | Ugly double bottom | 04/07/2025 | 04/30/2025 | Natural Gas (Distributor) | |
| UIS | Ugly double bottom | 04/07/2025 | 04/30/2025 | Computers and Peripherals | |
| UPS | Triangle, descending | 04/10/2025 | 05/08/2025 | Air Transport | |
| UNM | Double Bottom, Adam and Adam | 04/21/2025 | 04/30/2025 | Insurance (Diversified) | |
| VMI | Pipe bottom | 03/31/2025 | 04/07/2025 | Metal Fabricating | |
| VECO | Triangle, symmetrical | 04/08/2025 | 05/01/2025 | Precision Instrument | |
| WU | Pipe top | 04/21/2025 | 04/28/2025 | Financial Services | |
| WSC | Double Bottom, Eve and Adam | 04/04/2025 | 04/22/2025 | Industrial Services | |
| WOLF | Flag, high and tight | 04/10/2025 | 05/02/2025 | Semiconductor | |
| WWD | Pipe bottom | 03/31/2025 | 04/07/2025 | Precision Instrument |
![]()
$ $ $
I show a picture of the Nasdaq composite on the 5-minute scale.
I drew the green line under price valleys. Why? Because it's Wednesday and I need something to write about. ![]()
The real reason is that the price trend screamed linearity (rising at a steady clip, following a trend).
I drew the red lines for the same reason. The two red lines form a chart pattern called a channel.
Earlier today, the index touched the top red line before backing down. What does that mean? I'm not sure. Often it means a trip to the other side of the channel. That's also my guess as to what happens next.
$ $ $
Here's a symbol list of 122 chart and candlestick patterns (13 "investment grade" candle patterns) found in today's securities using my version of Patternz: A, ALRM, ALK, ALB, AEE, AIG, AMWD, AON, APA, APOG, AAPL, ASH, ADP, AVNT, AVA, AZTA, BCPC, BALL, BRKR, BBW, BLDR, BG, CALM, CAL, CPB, CNC, CDAY, CHKP, CTAS, CLF, CNO, CNX, COP, COST, COTY, CRH, CCRN, CSGS, EBAY, EVRG, EXPI, FIS, FISV, FMC, GL, GOOGL, GPRO, HBI, HELE, HUBG, IBP, TILE, JKHY, JAZZ, KMT, KMB, KSS, KLIC, LZB, LANC, L, MAN, MTRN, MOS, MYGN, NI, NWPX, OLN, ASGN, PAYX, PPL, PINC, PGR, PRU, PEG, QCOM, RGS, RLI, ROP, ROST, SAND, SCHW, SLGN, SKYW, SO, SCCO, SPSC, SXI, TECH, TSCO, TDG, RIG, TWLO, UGI, VLO, VMI, VRTX, V, WMT, WSO, WU, WEX, WWD, EWO, EEM, EWQ, EWH, EIS, EWP, THD, TUR, PEJ. Click this link for details (pattern type, start and end dates).
For a list of small patterns (those a few days wide) click this link.
$ $ $
The following table shows where Fibonacci retrace values of the day's high-low range are plus pivot points, calculated on the Nasdaq composite, sorted by value. When several are near each other (small differences), the area might act as support or resistance.
-- Thomas Bulkowski, author: Invest for Two-Comma Wealth and the novel (fiction), Orb Foresight (#Ad)
![]()
| © 2025 ThePatternSite.com Metric | Value | Diff | Close (within 10% of the high-low range for the day)? |
| Monthly S2 | 13,592.21 | ||
| Monthly S1 | 15,665.18 | 2,072.98 | |
| Weekly S2 | 16,492.87 | 827.69 | |
| Monthly Pivot | 16,857.01 | 364.13 | |
| Weekly S1 | 17,115.52 | 258.51 | |
| Daily S2 | 17,369.87 | 254.35 | |
| Low | 17,503.01 | 133.14 | |
| Daily S1 | 17,554.01 | 51.00 | |
| Weekly Pivot | 17,582.17 | 28.16 | Yes! The Weekly Pivot is close to the Daily S1. |
| 61.8% Down from Intraday High | 17,624.21 | 42.04 | |
| 50% Down from Intraday High | 17,661.65 | 37.44 | |
| Daily Pivot | 17,687.16 | 25.50 | Yes! The Daily Pivot is close to the 50% Down from Intraday High. |
| 38.2% Down from Intraday High | 17,699.10 | 11.94 | Yes! The 38.2% Down from Intraday High is close to the Daily Pivot. |
| Open | 17,706.83 | 7.73 | Yes! The Open is close to the 38.2% Down from Intraday High. |
| Close | 17,738.16 | 31.33 | Yes! The Close is close to the Open. |
| High | 17,820.30 | 82.14 | |
| Daily R1 | 17,871.30 | 51.00 | |
| Daily R2 | 18,004.45 | 133.14 | |
| Weekly R1 | 18,204.82 | 200.37 | |
| Weekly R2 | 18,671.47 | 466.66 | |
| Monthly R1 | 18,929.98 | 258.51 | |
| Monthly R2 | 20,121.81 | 1,191.82 |
This is a picture of the chart pattern indicator on the daily scale. The indicator is the line chart below a chart of the S&P 500 composite.
After being bullish for the last two weeks or so, the CPI has slipped to neutral. That's what the two vertical white bars on the far right of the chart mean.
A clearer picture of the CPI is in the inset in the middle of the chart. The index didn't make a big drop today (Tuesday) but the CPI tumbled. It suggests more of a downward move is coming. Besides, we're due for a retrace.
$ $ $
Here's a symbol list of 89 chart and candlestick patterns (13 "investment grade" candle patterns) found in today's securities using my version of Patternz: ABT, ALK, AMGN, AVNT, BCPC, BAH, BBW, BLDR, CBT, CACI, CAL, CPB, CE, CLS, CHKP, CLNE, CLX, CNO, CNX, CSGP, EVRG, EXPI, EZPW, FARO, FMC, FCX, FDP, FRD, GILD, GL, GES, HSII, HNI, IBP, ITGR, IPAR, IPI, JAZZ, K, KELYA, KSS, MAN, MKTX, MTRX, MOS, NEU, NWPX, NOVT, NUS, OXY, OLN, OMCL, OR, PKG, PKE, PINC, PGR, QCOM, ROP, SAND, SIGI, SCCO, TJX, UGI, UNM, VLO, MDRX, WU, WPM, FXI, IEO, EWO, EWK, EWH, EWM, EWW, EZA, EWY, GLD. Click this link for details (pattern type, start and end dates).
For a list of small patterns (those a few days wide) click this link.
-- Thomas Bulkowski, author: Invest for Two-Comma Wealth and the novel (fiction), Orb Foresight (#Ad)
![]()
$ $ $
I show another slider trading quiz featuring Tribune Co.: TRB stock.
$ $ $
Here's a symbol list of 87 chart and candlestick patterns (13 "investment grade" candle patterns) found in today's securities using my version of Patternz: ANF, ACN, ALRM, ALK, DOX, AAPL, BCPC, CNC, CHKP, CINF, COP, CROX, CSGS, CMI, DUK, EXP, EBAY, EVRG, EZPW, FIVN, FMC, FNV, GILD, GES, HE, HOLX, HUM, HUN, ILMN, JAZZ, JNJ, KELYA, KSS, LH, LMT, MKTX, MAS, META, NJR, NUS, OLN, ORCL, OR, PATK, PAYX, PCTY, PFG, PGR, RTX, RCKY, ROP, RGLD, R, CRM, SKX, SKYW, SXI, TGT, TECH, TJX, TSCO, TWLO, UGI, VEEV, V, VC, WPM, WWW, IYH, ILF, SLV, EWO, EWZ, EEM, EWG, EWJ, EWS, EWY, EWP, EWT, GLD, XLV, USO, VHT. Click this link for details (pattern type, start and end dates).
For a list of small patterns (those a few days wide) click this link.
$ $ $
The following table shows where Fibonacci retrace values of the day's high-low range are plus pivot points, calculated on the Dow industrials, sorted by value. When several are near each other (small differences), the area might act as support or resistance.
-- Thomas Bulkowski, author: Invest for Two-Comma Wealth and the novel (fiction), Orb Foresight (#Ad)
![]()
| © 2025 ThePatternSite.com Metric | Value | Diff | Close (within 10% of the high-low range for the day)? |
| Monthly S2 | 34,300.47 | ||
| Monthly S1 | 37,759.65 | 3,459.18 | |
| Weekly S2 | 39,142.99 | 1,383.34 | |
| Monthly Pivot | 40,070.96 | 927.97 | |
| Weekly S1 | 40,180.91 | 109.95 | |
| Weekly Pivot | 40,783.55 | 602.64 | |
| Daily S2 | 40,860.26 | 76.71 | |
| Daily S1 | 41,039.54 | 179.29 | |
| Low | 41,063.44 | 23.90 | Yes! The Low is close to the Daily S1. |
| Open | 41,173.38 | 109.94 | |
| 61.8% Down from Intraday High | 41,209.54 | 36.16 | Yes! The 61.8% Down from Intraday High is close to the Open. |
| Close | 41,218.83 | 9.29 | Yes! The Close is close to the 61.8% Down from Intraday High. |
| Daily Pivot | 41,242.73 | 23.90 | Yes! The Daily Pivot is close to the Close. |
| 50% Down from Intraday High | 41,254.68 | 11.95 | Yes! The 50% Down from Intraday High is close to the Daily Pivot. |
| 38.2% Down from Intraday High | 41,299.80 | 45.13 | |
| Daily R1 | 41,422.01 | 122.21 | |
| High | 41,445.91 | 23.90 | Yes! The High is close to the Daily R1. |
| Daily R2 | 41,625.20 | 179.29 | |
| Weekly R1 | 41,821.47 | 196.27 | |
| Weekly R2 | 42,424.11 | 602.64 | |
| Monthly R1 | 43,530.14 | 1,106.03 | |
| Monthly R2 | 45,841.45 | 2,311.31 |

I show the Dow transports on the daily scale. Let's go through the patterns, starting from A.
At AB, I show a double top. It confirms as a valid chart pattern when the index closes below C. The drop down to the chart's low in April is a big dive.
Let's set D aside for a moment.
E is a flag. This one tilts against the prevailing trend, which flags do many times, but not all the time. They can slope in the direction of the trend or horizontally.
Flags can sometimes act as midway patterns, which this almost does in the run from peak B to valley in April.
F is a triple bottom if you want to group the spikes together. It might be better to call this a rectangle bottom. The rect sees price reverse and climb for a time.
Going back to D, it's a unformed rising wedge. Unformed? Yes. A true rising wedge needs more touches of each trendline. The last touch on the top, at D, price moves through the top trendline. It's not a minor high, so it really doesn't qualify as a touch. The bottom valleys have two touches when three is better.
I suppose this might qualify as a flag or pennant.
What does the pennant or flag or wedge mean? Breakouts from a rising wedge are downward 60% of the time. This might be one of the exceptions. I'm looking for the markets to continue their recovery, but it'll be interrupted by a downward retrace soon.
![]()
The following is a brief review of how the markets performed over time. The numbers refer to the close-to-close move in the Dow industrials.
No options expire this week.
![]()
The following is based on an SFO article in December 2004 by John Seekinger, titled, "Take a two-dimensional approach." He offers these tips.
| Index | S2 | S1 | Pivot | R1 | R2 |
| Dow Industrials (^DJI): Daily | 40,796 | 41,057 | 41,221 | 41,482 | 41,647 |
| Weekly | 39,176 | 40,247 | 40,816 | 41,887 | 42,457 |
| Monthly | 34,333 | 37,825 | 40,104 | 43,596 | 45,874 |
| S&P500 (^GSPC): Daily | 5,618 | 5,652 | 5,677 | 5,711 | 5,735 |
| Weekly | 5,339 | 5,513 | 5,607 | 5,781 | 5,874 |
| Monthly | 4,542 | 5,114 | 5,407 | 5,980 | 6,273 |
| Nasdaq (^IXIC): Daily | 17,709 | 17,844 | 17,946 | 18,080 | 18,183 |
| Weekly | 16,573 | 17,275 | 17,662 | 18,365 | 18,751 |
| Monthly | 13,672 | 15,825 | 16,937 | 19,090 | 20,202 |
Here are the formulas:
![]()
Earnings season is either underway or should be starting soon. The sessions could be more volatile.
Here's a symbol list of 178 chart and candlestick patterns (13 "investment grade" candle patterns) found in today's securities using my version of Patternz: ACN, ACIW, ALRM, ALK, AXP, APA, APOG, AMAT, ASH, BMI, BCPC, BZH, BSX, BRC, BBW, CNP, CDAY, CHKP, CIEN, CINF, CTAS, CSCO, DECK, DVN, FANG, DFS, DSGR, ^DJT, EXP, EME, EZPW, FIVN, FMC, IT, GD, GE, GILD, GFS, GS, HQY, HTLD, HOLX, HON, HUM, HUN, IBKR, ISRG, IRM, JAZZ, KELYA, KEYS, KLIC, LH, LRCX, LLY, LMT, L, MANH, MKTX, MAS, MA, MTDR, MDT, MRCY, META, MGEE, MCO, MS, MUR, NFG, NTAP, NEU, NUS, OXY, OLN, OMCL, ORCL, OR, PTEN, PAYX, PFG, PGR, PEG, QCOM, RJF, RTX, REGN, RCKY, ROG, ROP, RGLD, CRM, SLB, SCHW, SHW, SLGN, SKYW, SO, SWX, SXI, SRDX, TECH, TER, TSCO, UHAL, VFC, VMI, V, WLK, WPM, WMB, WSC, WOLF, ITA, IYM, IAI, IEZ, IHE, QTEC, FXL, FXI, BOTZ, IYH, IAT, IEV, MXI, IXN, SOXX, SLV, IEO, IYF, IHI, EWA, EWO, EWK, EWZ, EEM, EWQ, EWG, EWH, EIS, EWI, EWM, EPP, EWS, EZA, EWY, EWD, EWL, EWT, THD, EWU, PPA, PBE, PEJ, PHO, ROBO, XLF, XLV, XLI, XLB, XRT, XAR, SMH, VHT, VIS, VAW. Click this link for details (pattern type, start and end dates).
For a list of small patterns (those a few days wide) click this link.
The below industries were the best (rank 1) or worst performing of those I follow.
|
-- Thomas Bulkowski, author: Invest for Two-Comma Wealth and the novel (fiction), Orb Foresight (#Ad)
![]()
Here's a symbol list of 144 chart and candlestick patterns (13 "investment grade" candle patterns) found in today's securities using my version of Patternz: ACN, APD, ALRM, ALK, ALKS, APH, APA, ANET, ARW, BCPC, BAX, BOOT, BRC, CACI, CNP, CDAY, CHKP, CHD, CIEN, CINF, CTSH, GLW, CRH, CTS, DSGR, D, EXP, EBAY, EME, EQT, EZPW, FIVN, FTNT, FWRD, GAP, GILD, GL, HTLD, HWM, HUM, IEX, IDXX, ITW, ILMN, IPAR, TILE, LH, LEG, RAMP, LPLA, MTSI, MGY, MAS, META, MSFT, MLKN, MYGN, ^IXIC, NFG, NOV, NTGR, NUS, NTNX, OTEX, ORCL, PKE, PAYX, PFG, QTWO, RTX, RGS, RHI, RCKY, ROP, RGLD, ^GSPC, CRM, SMTC, SKX, SO, SPSC, SXI, SCS, TRGP, TECH, TDOC, TSCO, TWLO, VEEV, MDRX, VC, WMT, WU, WEX, WPM, WSM, WDAY, XEL, ITA, IEZ, IDU, FTEC, FDN, QTEC, FXL, BOTZ, QQQ, IYH, IHF, IYZ, IGV, IXN, ILF, SLV, EWZ, EIS, EWY, EWP, EWL, EWT, TUR, QLD, DBA, SSO, XLV, XLI, SPY, XLK, SMH, VHT, MGK, VONG. Click this link for details (pattern type, start and end dates).
For a list of small patterns (those a few days wide) click this link.
$ $ $
You can find setups based on a Fibonacci retrace by clicking on the link.
The following patterns were found manually, not using Patternz. Mr. Bulkowski has excluded any securities he owns from appearing in the list. However, he may add any of the securities listed to his portfolio at any time, just as you can.
In the table below, the red and green colors are based on the historical breakout direction for the associated chart pattern. If a high and tight flag appears, the start and end dates highlight the flagpole only and not the flag.
For details about the chart patterns, click here.
-- Thomas Bulkowski, author: Invest for Two-Comma Wealth and the novel (fiction), Foresight (#Ad)
![]()
| Symbol | Chart Pattern | Bullish Bearish | Start | End | Industry |
| ADBE | Double Bottom, Eve and Eve | 04/07/2025 | 04/21/2025 | Computer Software and Svcs | |
| AAPL | Ugly double bottom | 04/08/2025 | 04/21/2025 | Computers and Peripherals | |
| AMAT | Ugly double bottom | 04/07/2025 | 04/21/2025 | Semiconductor Cap Equip. | |
| ANET | Pipe bottom | 03/31/2025 | 04/07/2025 | E-Commerce | |
| AWI | Pipe bottom | 03/31/2025 | 04/07/2025 | Building Materials | |
| AIZ | Triangle, symmetrical | 04/04/2025 | 05/01/2025 | Insurance (Diversified) | |
| ADSK | Pipe bottom | 03/31/2025 | 04/07/2025 | Computer Software and Svcs | |
| BAH | Triple bottom | 03/03/2025 | 04/09/2025 | IT Services | |
| BSX | Ugly double bottom | 03/31/2025 | 04/07/2025 | Medical Services | |
| BRC | Ugly double bottom | 04/07/2025 | 04/21/2025 | Chemical (Diversified) | |
| CDNS | Pipe bottom | 03/31/2025 | 04/07/2025 | Computer Software and Svcs | |
| CX | Pipe bottom | 03/31/2025 | 04/07/2025 | Cement and Aggregates | |
| CNC | Pipe top | 03/31/2025 | 04/07/2025 | Medical Services | |
| CNP | Rising wedge | 04/09/2025 | 05/01/2025 | Electric Utility (Central) | |
| CIEN | Pipe bottom | 03/31/2025 | 04/07/2025 | Telecom. Equipment | |
| CINF | Pipe bottom | 04/07/2025 | 04/21/2025 | Insurance (Prop/Casualty) | |
| CNA | Triangle, symmetrical | 04/14/2025 | 05/01/2025 | Insurance (Prop/Casualty) | |
| CMTL | Rectangle bottom | 04/04/2025 | 05/01/2025 | Telecom. Equipment | |
| CR | Pipe bottom | 03/31/2025 | 04/07/2025 | Diversified Co. | |
| CRH | Pipe bottom | 03/31/2025 | 04/07/2025 | Cement and Aggregates | |
| CW | Pipe bottom | 03/31/2025 | 04/07/2025 | Machinery | |
| D | Ugly double bottom | 04/09/2025 | 04/21/2025 | Electric Utility (East) | |
| DTE | Diamond top | 02/27/2025 | 05/01/2025 | Electric Utility (Central) | |
| EBAY | Head-and-shoulders complex bottom | 03/13/2025 | 04/29/2025 | Internet | |
| EME | Pipe bottom | 03/31/2025 | 04/07/2025 | Industrial Services | |
| EG | Ugly double bottom | 04/07/2025 | 04/21/2025 | Insurance (Prop/Casualty) | |
| EVH | Double Top, Eve and Eve | 03/18/2025 | 04/09/2025 | Healthcare Information | |
| EXPD | Triangle, symmetrical | 04/09/2025 | 05/01/2025 | Air Transport | |
| FFIV | Ugly double bottom | 04/07/2025 | 04/21/2025 | Internet | |
| FARO | Pipe bottom | 03/31/2025 | 04/07/2025 | Precision Instrument | |
| FLEX | Pipe bottom | 03/31/2025 | 04/07/2025 | Electronics | |
| FTNT | Pipe bottom | 03/31/2025 | 04/07/2025 | Computer Software and Svcs | |
| GNW | Broadening bottom | 02/21/2025 | 04/09/2025 | Insurance (Life) | |
| GGG | Ugly double bottom | 04/07/2025 | 04/21/2025 | Machinery | |
| HON | Ugly double bottom | 04/09/2025 | 04/21/2025 | Aerospace/Defense | |
| HWM | Pipe bottom | 03/31/2025 | 04/07/2025 | Aerospace/Defense | |
| HUN | Triangle, symmetrical | 04/09/2025 | 05/01/2025 | Chemical (Specialty) | |
| NSP | Dead-cat bounce | 04/29/2025 | 04/29/2025 | Human Resources | |
| ITGR | Pipe bottom | 03/31/2025 | 04/07/2025 | Electronics | |
| IPG | Triangle, symmetrical | 04/03/2025 | 04/30/2025 | Advertising | |
| IPI | Pipe bottom | 03/31/2025 | 04/07/2025 | Chemical (Diversified) | |
| INTU | Pipe bottom | 03/31/2025 | 04/07/2025 | Computer Software and Svcs | |
| IRM | Pipe bottom | 03/31/2025 | 04/07/2025 | Industrial Services | |
| KALU | Pipe bottom | 03/31/2025 | 04/07/2025 | Metals and Mining (Div.) | |
| LH | Horn bottom | 04/07/2025 | 04/21/2025 | Medical Services | |
| RAMP | Pipe bottom | 03/31/2025 | 04/07/2025 | Computer Software and Svcs | |
| LOW | Triangle, ascending | 04/09/2025 | 05/01/2025 | Retail Building Supply | |
| LXU | Double Bottom, Eve and Adam | 04/09/2025 | 04/21/2025 | Building Materials | |
| MRK | Triple bottom | 04/09/2025 | 04/24/2025 | Drug | |
| MOS | Double Bottom, Adam and Eve | 03/04/2025 | 04/07/2025 | Chemical (Diversified) | |
| NUS | Pipe bottom | 04/14/2025 | 04/21/2025 | Toiletries/Cosmetics | |
| OMC | Triangle, symmetrical | 04/03/2025 | 05/01/2025 | Advertising | |
| OTEX | Pipe bottom | 03/31/2025 | 04/07/2025 | E-Commerce | |
| ORCL | Horn bottom | 04/07/2025 | 04/21/2025 | Computer Software and Svcs | |
| PKG | Triangle, symmetrical | 04/09/2025 | 05/01/2025 | Packaging and Container | |
| PANW | Pipe bottom | 03/31/2025 | 04/07/2025 | Computer Software and Svcs | |
| PCTY | Pipe bottom | 03/31/2025 | 04/07/2025 | E-Commerce | |
| PEN | Pipe bottom | 03/31/2025 | 04/07/2025 | Medical Supplies | |
| PFG | Triangle, symmetrical | 04/09/2025 | 05/01/2025 | Insurance (Diversified) | |
| KWR | Triangle, symmetrical | 04/08/2025 | 05/01/2025 | Chemical (Specialty) | |
| RTX | Horn bottom | 04/07/2025 | 04/21/2025 | Aerospace/Defense | |
| RLI | Pipe top | 03/24/2025 | 03/31/2025 | Insurance (Prop/Casualty) | |
| RCKY | Pipe bottom | 04/14/2025 | 04/21/2025 | Shoe | |
| SAIA | Horn top | 03/24/2025 | 04/07/2025 | Trucking/Transp. Leasing | |
| CRM | Double Bottom, Adam and Adam | 04/07/2025 | 04/21/2025 | E-Commerce | |
| SCHW | Pipe bottom | 03/31/2025 | 04/07/2025 | Securities Brokerage | |
| SEIC | Pipe bottom | 03/31/2025 | 04/07/2025 | IT Services | |
| NOW | Pipe bottom | 03/31/2025 | 04/07/2025 | IT Services | |
| SPSC | Pipe bottom | 03/31/2025 | 04/07/2025 | E-Commerce | |
| SRDX | Double Bottom, Eve and Adam | 04/09/2025 | 04/21/2025 | Medical Supplies | |
| SNPS | Pipe bottom | 03/31/2025 | 04/07/2025 | Computer Software and Svcs | |
| TDG | Ugly double bottom | 04/07/2025 | 04/22/2025 | Aerospace/Defense | |
| TZOO | Pipe bottom | 03/31/2025 | 04/07/2025 | Internet | |
| VRTX | Ugly double bottom | 04/07/2025 | 04/21/2025 | Biotechnology | |
| VMC | Double Bottom, Adam and Adam | 03/10/2025 | 04/09/2025 | Cement and Aggregates | |
| WDAY | Double Bottom, Eve and Adam | 04/07/2025 | 04/21/2025 | Computer Software and Svcs |
![]()
$ $ $
Here's the updated 2025 market forecast, presented in slider format.
$ $ $
Here's a symbol list of 89 chart and candlestick patterns (13 "investment grade" candle patterns) found in today's securities using my version of Patternz: ACN, AYI, AES, ALRM, ALK, AA, AFG, BCPC, BSET, BA, BR, BBW, CX, CHKP, CINF, CGNX, CAG, CR, EXP, EVRG, EXPI, FFIV, FIVN, FORM, FNV, FCX, GME, GILD, GFS, GFF, HIG, HTLD, HL, HUM, JBHT, IEX, NSP, KBH, LH, LEN, MTSI, MAS, META, NJR, NOVT, NUS, ON, ORCL, OMI, PANW, PKE, PAYX, PPG, PPL, PFG, RTX, RCKY, RGLD, CRM, SAND, SHW, SXI, TECH, TSCO, TRV, VFC, MDRX, WERN, WPM, WWD, IYK, IEZ, IYH, SLV, EWH, EWM, EWS, THD, TUR, DBA, PEJ, XLP, XLV, USO, VHT. Click this link for details (pattern type, start and end dates).
For a list of small patterns (those a few days wide) click this link.
$ $ $
The following table shows where Fibonacci retrace values of the day's high-low range are plus pivot points, calculated on the Nasdaq composite, sorted by value. When several are near each other (small differences), the area might act as support or resistance.
-- Thomas Bulkowski, author: Invest for Two-Comma Wealth and the novel (fiction), Orb Foresight (#Ad)
![]()
| © 2025 ThePatternSite.com Metric | Value | Diff | Close (within 10% of the high-low range for the day)? |
| Monthly S2 | 13,340.07 | ||
| Weekly S2 | 15,126.23 | 1,786.16 | |
| Monthly S1 | 15,393.20 | 266.98 | |
| Weekly S1 | 16,286.28 | 893.08 | |
| Daily S2 | 16,772.27 | 485.99 | |
| Monthly Pivot | 16,837.17 | 64.89 | |
| Weekly Pivot | 16,845.39 | 8.22 | Yes! The Weekly Pivot is close to the Monthly Pivot. |
| Low | 16,959.53 | 114.14 | |
| Open | 17,099.98 | 140.45 | |
| Daily S1 | 17,109.31 | 9.33 | Yes! The Daily S1 is close to the Open. |
| 61.8% Down from Intraday High | 17,159.81 | 50.50 | Yes! The 61.8% Down from Intraday High is close to the Daily S1. |
| 50% Down from Intraday High | 17,221.68 | 61.87 | |
| 38.2% Down from Intraday High | 17,283.54 | 61.87 | |
| Daily Pivot | 17,296.56 | 13.02 | Yes! The Daily Pivot is close to the 38.2% Down from Intraday High. |
| Close | 17,446.34 | 149.78 | |
| High | 17,483.82 | 37.48 | Yes! The High is close to the Close. |
| Daily R1 | 17,633.60 | 149.78 | |
| Daily R2 | 17,820.85 | 187.26 | |
| Weekly R1 | 18,005.44 | 184.59 | |
| Weekly R2 | 18,564.55 | 559.10 | |
| Monthly R1 | 18,890.30 | 325.76 | |
| Monthly R2 | 20,334.27 | 1,443.96 |
Support this site! Clicking any of the books (below) takes you to
Amazon.com If you buy ANYTHING while there, they pay for the referral.
Legal notice for paid links: "As an Amazon Associate I earn from qualifying purchases."
|
My Stock Market Books
|
My Novels
Orb Foresight Rewrite Coming!
|