
As of 04/21/2026
Indus: 49,149 -293.18 -0.6%
Trans: 23,933 +611.01 +2.6%
Utils: 1,134 -18.16 -1.6%
Nasdaq: 24,260 -144.42 -0.6%
S&P 500: 7,064 -45.13 -0.6%
|
YTD
+2.3%
+37.9%
+6.1%
+4.4%
+3.2%
|
|
As of 04/21/2026
Indus: 49,149 -293.18 -0.6%
Trans: 23,933 +611.01 +2.6%
Utils: 1,134 -18.16 -1.6%
Nasdaq: 24,260 -144.42 -0.6%
S&P 500: 7,064 -45.13 -0.6%
|
YTD
+2.3%
+37.9%
+6.1%
+4.4%
+3.2%
| |
|
| ||
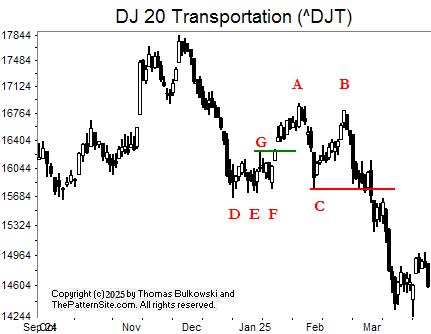
I show the Dow transports on the daily scale.
AB is a double top that confirms as a valid pattern when the index closes below the horizontal red line, C. The height of the pattern, from A (highest of two peaks) to C (valley between AB) subtracted from C gives a target. The index exceeds the target in this example.
Chart pattern DEF, which is a triple bottom, works the same way except with price rising. Valley E has multiple spikes that I group to suggest a single bottom. Line G confirms the pattern as valid. It comes close to meeting its price target at A (height of the pattern added to G gives a target).
Looking forward, I believe the indices will suffer as the Trump tariffs raise prices for consumers, making the US economy suffer, and pissing off most of the world.
There's a saying that trade prevents wars. What's the absence of trade do? Rhetorical question.
![]()
The following is a brief review of how the markets performed over time. The numbers refer to the close-to-close move in the Dow industrials.
No options expire this week.
![]()
The following is based on an SFO article in December 2004 by John Seekinger, titled, "Take a two-dimensional approach." He offers these tips.
| Index | S2 | S1 | Pivot | R1 | R2 |
| Dow Industrials (^DJI): Daily | 41,063 | 41,323 | 41,791 | 42,051 | 42,519 |
| Weekly | 40,687 | 41,135 | 41,979 | 42,427 | 43,270 |
| Monthly | 38,721 | 40,153 | 42,093 | 43,525 | 45,465 |
| S&P500 (^GSPC): Daily | 5,500 | 5,540 | 5,613 | 5,654 | 5,727 |
| Weekly | 5,432 | 5,507 | 5,647 | 5,721 | 5,861 |
| Monthly | 5,171 | 5,376 | 5,710 | 5,915 | 6,249 |
| Nasdaq (^IXIC): Daily | 16,976 | 17,150 | 17,456 | 17,630 | 17,937 |
| Weekly | 16,631 | 16,977 | 17,629 | 17,975 | 18,627 |
| Monthly | 15,662 | 16,493 | 18,068 | 18,899 | 20,474 |
Here are the formulas:
![]()
Earnings season is over.
Here's a symbol list of 194 chart and candlestick patterns (13 "investment grade" candle patterns) found in today's securities using my version of Patternz: DDD, AES, APD, AA, AMZN, AXP, AON, APOG, ACGL, ARW, AGO, ADP, AVY, BCPC, BZH, BKNG, BOOT, BR, BBW, CX, CENX, CHKP, CINF, CLNE, CLF, CNA, CL, CMTL, COST, CRH, CCRN, CSGS, CW, DFS, DSGR, EMN, EME, EMR, EPAM, EFX, EZPW, FFIV, FAST, FIS, FLEX, FLS, FTNT, FCX, GME, GIS, GFS, GL, GS, GOOGL, GPRO, HTLD, HL, HD, HON, DHI, HUN, IEX, IDXX, ITW, IIIN, IBKR, TILE, ISRG, JNJ, KELYA, KEYS, LZB, LANC, LDOS, LEN, RAMP, LMT, L, LPLA, LXU, MHO, MTSI, MKTX, MDT, NBR, NTAP, NWL, NEU, NKE, JWN, NVDA, ORI, ON, OTEX, OR, OMI, PANW, PATK, PYPL, PNW, PEG, PSTG, KWR, RL, RLI, ROL, ROST, R, ^GSPC, SAIA, SEIC, SMTC, NOW, SKX, SCS, SRDX, SNPS, TPR, TGT, TXN, TJX, TG, TWLO, UPS, VECO, VRTX, WRB, WAT, WERN, WU, WOLF, WWW, IYM, IAI, IYK, IYC, IHE, FDN, QTEC, FXL, FXI, BOTZ, IYH, IHF, IYZ, IGV, MXI, EWA, EWO, EEM, EWH, EIS, EWJ, EWS, EZA, EWT, THD, QLD, PBE, PHO, SSO, ROBO, XLY, GLD, XLB, SPY, USO. Click this link for details (pattern type, start and end dates).
For a list of small patterns (those a few days wide) click this link.
The below industries were the best (rank 1) or worst performing of those I follow.
|
-- Thomas Bulkowski
![]()
Here's a symbol list of 145 chart and candlestick patterns (13 "investment grade" candle patterns) found in today's securities using my version of Patternz: DDD, AEIS, AES, ATSG, ALK, ALB, AA, ALGT, DOX, AXP, AR, APOG, AAPL, ANET, AWI, BERY, BMRN, BKNG, BOOT, BSX, BCO, BR, CDNS, CPB, CLS, CLNE, CMTL, CAG, COST, CR, CTS, DFS, EIX, EQT, FFIV, FICO, FIS, FISV, FLEX, FTNT, FCX, GME, GE, GS, GPRO, HELE, HSY, HWM, HUM, HUN, IEX, ITW, IBKR, TILE, ISRG, JAZZ, JNJ, KEYS, KLIC, LAMR, LDOS, LNC, RAMP, LMT, MLKN, MCO, MS, MOS, MYGN, NFG, NI, JWN, NOC, NUS, ORI, ON, ORCL, OR, OMI, PATK, PLXS, PPG, PPL, PEG, PSTG, RL, RJF, RTX, R, SAIA, SBH, SCHW, SEIC, SKX, SGI, SCCO, SSYS, TPR, TTD, TJX, TWLO, UNM, V, WWW, WWD, WDAY, ITA, IAI, IYC, IHE, IYF, ECH, EWH, EIS, EWM, EWY, EWL, EWT, TUR, EWU, QLD, PPA, DBA, XLY, XLF, GLD, XHB, UNG, SMH. Click this link for details (pattern type, start and end dates).
For a list of small patterns (those a few days wide) click this link.
$ $ $
You can find setups based on a Fibonacci retrace by clicking on the link.
The following patterns were found manually, not using Patternz. Mr. Bulkowski has excluded any securities he owns from appearing in the list. However, he may add any of the securities listed to his portfolio at any time, just as you can.
In the table below, the red and green colors are based on the historical breakout direction for the associated chart pattern. If a high and tight flag appears, the start and end dates highlight the flagpole only and not the flag.
For details about the chart patterns, click here.
-- Thomas Bulkowski, author: Invest for Two-Comma Wealth and the novel (fiction), Foresight (#Ad)
![]()
| Symbol | Chart Pattern | Bullish Bearish | Start | End | Industry |
| DDD | Dead-cat bounce | 03/27/2025 | 03/27/2025 | Electronics | |
| ABT | Double Bottom, Eve and Adam | 03/14/2025 | 03/25/2025 | Medical Supplies | |
| ASH | Double Bottom, Adam and Eve | 03/13/2025 | 03/19/2025 | Chemical (Basic) | |
| BKNG | Pipe bottom | 03/10/2025 | 03/17/2025 | Internet | |
| BAH | Double Top, Adam and Adam | 03/10/2025 | 03/19/2025 | IT Services | |
| BRC | Triangle, ascending | 03/06/2025 | 03/27/2025 | Chemical (Diversified) | |
| BCO | Double Bottom, Adam and Adam | 03/13/2025 | 03/21/2025 | Industrial Services | |
| CALM | Pipe bottom | 03/03/2025 | 03/10/2025 | Food Processing | |
| CNC | Triangle, symmetrical | 02/25/2025 | 03/27/2025 | Medical Services | |
| CRL | Double Top, Adam and Eve | 03/10/2025 | 03/19/2025 | Biotechnology | |
| CTAS | Double Bottom, Eve and Adam | 03/13/2025 | 03/21/2025 | Industrial Services | |
| CSCO | Triple bottom | 03/13/2025 | 03/21/2025 | Computers and Peripherals | |
| CNO | Broadening top | 02/12/2025 | 03/26/2025 | Insurance (Diversified) | |
| CL | Triple bottom | 03/14/2025 | 03/25/2025 | Household Products | |
| COST | Double Bottom, Adam and Adam | 03/13/2025 | 03/21/2025 | Retail Store | |
| COTY | Triangle, descending | 03/04/2025 | 03/27/2025 | Toiletries/Cosmetics | |
| CRH | Head-and-shoulders top | 03/12/2025 | 03/25/2025 | Cement and Aggregates | |
| FANG | Pipe bottom | 03/03/2025 | 03/10/2025 | Petroleum (Producing) | |
| ^DJU | Double Top, Adam and Eve | 03/17/2025 | 03/24/2025 | None | |
| ^DJT | Double Bottom, Adam and Adam | 03/13/2025 | 03/21/2025 | None | |
| BOOM | Pipe bottom | 03/03/2025 | 03/10/2025 | Metal Fabricating | |
| EXP | Double Bottom, Adam and Adam | 03/07/2025 | 03/13/2025 | Cement and Aggregates | |
| EBAY | Triangle, symmetrical | 03/13/2025 | 03/27/2025 | Internet | |
| EMR | Double Bottom, Eve and Adam | 03/13/2025 | 03/20/2025 | Computers and Peripherals | |
| EG | Ugly double bottom | 02/11/2025 | 03/12/2025 | Insurance (Prop/Casualty) | |
| EXPD | Double Bottom, Adam and Adam | 03/14/2025 | 03/21/2025 | Air Transport | |
| FTNT | Pipe bottom | 03/10/2025 | 03/17/2025 | Computer Software and Svcs | |
| GME | Dead-cat bounce | 03/27/2025 | 03/27/2025 | Retail (Special Lines) | |
| HD | Triple bottom | 03/13/2025 | 03/21/2025 | Retail Building Supply | |
| HUN | Double Top, Eve and Adam | 03/06/2025 | 03/17/2025 | Chemical (Specialty) | |
| IPG | Diamond bottom | 03/14/2025 | 03/27/2025 | Advertising | |
| JKHY | Double Bottom, Adam and Eve | 03/12/2025 | 03/21/2025 | IT Services | |
| JAZZ | Pipe top | 02/24/2025 | 03/03/2025 | Biotechnology | |
| LOW | Double Bottom, Adam and Adam | 03/13/2025 | 03/21/2025 | Retail Building Supply | |
| MGEE | Triangle, symmetrical | 01/21/2025 | 03/27/2025 | Electric Utility (Central) | |
| NOV | Pipe bottom | 03/03/2025 | 03/10/2025 | Oilfield Svcs/Equipment | |
| NTGR | Rising wedge | 03/13/2025 | 03/27/2025 | Telecom. Equipment | |
| NOC | Ugly double bottom | 02/20/2025 | 03/13/2025 | Aerospace/Defense | |
| OXY | Pipe bottom | 03/03/2025 | 03/10/2025 | Petroleum (Producing) | |
| OMC | Triangle, symmetrical | 03/13/2025 | 03/27/2025 | Advertising | |
| ON | Pipe bottom | 03/10/2025 | 03/17/2025 | Semiconductor | |
| OTEX | Double Bottom, Adam and Eve | 03/04/2025 | 03/13/2025 | E-Commerce | |
| OR | Broadening top | 11/14/2024 | 03/27/2025 | Metals and Mining (Div.) | |
| PKG | Double Bottom, Adam and Adam | 03/14/2025 | 03/21/2025 | Packaging and Container | |
| PANW | Double Top, Adam and Adam | 03/19/2025 | 03/26/2025 | Computer Software and Svcs | |
| PAYX | Double Bottom, Eve and Eve | 03/13/2025 | 03/21/2025 | IT Services | |
| PINC | Head-and-shoulders bottom | 02/14/2025 | 03/14/2025 | Healthcare Information | |
| REGN | Triple top | 02/06/2025 | 03/10/2025 | Biotechnology | |
| RLI | Double Bottom, Adam and Adam | 02/20/2025 | 03/12/2025 | Insurance (Prop/Casualty) | |
| ROST | Triple bottom | 03/14/2025 | 03/21/2025 | Retail (Special Lines) | |
| SCHW | Pipe bottom | 03/03/2025 | 03/10/2025 | Securities Brokerage | |
| SKX | Double Bottom, Eve and Adam | 03/10/2025 | 03/21/2025 | Shoe | |
| TG | Pipe bottom | 03/03/2025 | 03/10/2025 | Chemical (Specialty) | |
| WEX | Triangle, symmetrical | 02/24/2025 | 03/27/2025 | Information Services |
![]()
$ $ $

I show a picture of the Nasdaq composite on the 5-minute scale.
At AB is a chart pattern called a double bottom. The first bottom is wide (Eve) and the second is more narrow with a downward spike (Adam), giving the pattern the name, Eve & Adam double bottom. Performance varies depending on the type of Adam and Eve combination.
At C, the pattern becomes real. By that, I mean it changes from squiggles to a defined pattern signaling upside potential. In this case, the upward move hasn't amounted to much . . . so far.
Compare AB with double bottom D (far left, bottom). It's a small Eve & Adam double bottom that packs a wallop. Price moved up more than the height of the double bottom (about 2.5 times the height). The AB pattern hasn't seen price climb 1x (one times) it's height.
What does this mean? The index is resting on support (green line), suggesting it'll move upward. Indeed, the CPI (chart pattern indicator) moved from 62 to 74 today. That transitions the indicator from neutral to bullish.
I have my doubts that this move will stick. I think we'll see the markets drop again as tariffs loom in early April.
$ $ $
Here's a symbol list of 159 chart and candlestick patterns (13 "investment grade" candle patterns) found in today's securities using my version of Patternz: AEIS, AES, AFL, A, ATSG, AKAM, ALK, AA, ALGT, AMZN, DOX, AEO, AXP, ATR, AWI, ASH, BMI, BKH, BKNG, BOOT, BSX, BR, CDNS, CPB, CHKP, CHD, CTAS, CMTL, CAG, CXW, COST, CR, CROX, CTS, DFS, EQT, EG, EXPI, EXPD, XOM, FFIV, FICO, FISV, FORM, FTNT, FWRD, FCX, GME, GD, GE, GILD, GS, GPRO, HLIT, HD, HWM, HUM, INCY, IBP, INTC, IBKR, ISRG, IRM, JBLU, JNJ, KEYS, KLIC, LLY, LNC, RAMP, MGY, MCO, MS, MUR, MYGN, JWN, ORI, ON, OMI, PATK, PTEN, PEN, PFE, PCG, PNW, PLXS, PFG, RL, RRC, RJF, RTX, RES, R, SAIA, SCHW, SKX, SCCO, LUV, SSYS, TPR, TECH, TTD, TJX, TWLO, UNM, VFC, MDRX, V, VMC, WAT, WSO, WPM, WWW, WWD, ITA, IAI, IYK, IYC, IHE, QTEC, IYH, ILF, SLV, IYF, EWZ, ECH, EWH, EIS, EWS, EWY, EWL, QLD, PPA, PBE, PJP, ROBO, XLY, XLP, XLF, XHB, VHT, VONG. Click this link for details (pattern type, start and end dates).
For a list of small patterns (those a few days wide) click this link.
$ $ $
The following table shows where Fibonacci retrace values of the day's high-low range are plus pivot points, calculated on the Nasdaq composite, sorted by value. When several are near each other (small differences), the area might act as support or resistance.
-- Thomas Bulkowski
![]()
| © 2025 ThePatternSite.com Metric | Value | Diff | Close (within 10% of the high-low range for the day)? |
| Monthly S2 | 15,543.92 | ||
| Monthly S1 | 16,721.46 | 1,177.55 | |
| Weekly S2 | 17,257.94 | 536.47 | |
| Weekly S1 | 17,578.47 | 320.54 | |
| Daily S2 | 17,591.65 | 13.18 | Yes! The Daily S2 is close to the Weekly S1. |
| Daily S1 | 17,745.33 | 153.68 | |
| Weekly Pivot | 17,752.21 | 6.88 | Yes! The Weekly Pivot is close to the Daily S1. |
| Low | 17,837.26 | 85.05 | |
| Close | 17,899.01 | 61.75 | |
| 61.8% Down from Intraday High | 17,989.79 | 90.78 | |
| Daily Pivot | 17,990.94 | 1.15 | Yes! The Daily Pivot is close to the 61.8% Down from Intraday High. |
| 50% Down from Intraday High | 18,036.90 | 45.96 | |
| Weekly R1 | 18,072.74 | 35.84 | Yes! The Weekly R1 is close to the 50% Down from Intraday High. |
| 38.2% Down from Intraday High | 18,084.02 | 11.28 | Yes! The 38.2% Down from Intraday High is close to the Weekly R1. |
| Daily R1 | 18,144.62 | 60.60 | |
| Open | 18,217.33 | 72.71 | |
| High | 18,236.55 | 19.22 | Yes! The High is close to the Open. |
| Weekly R2 | 18,246.48 | 9.93 | Yes! The Weekly R2 is close to the High. |
| Daily R2 | 18,390.23 | 143.75 | |
| Monthly Pivot | 18,415.79 | 25.56 | Yes! The Monthly Pivot is close to the Daily R2. |
| Monthly R1 | 19,593.33 | 1,177.55 | |
| Monthly R2 | 21,287.66 | 1,694.32 |
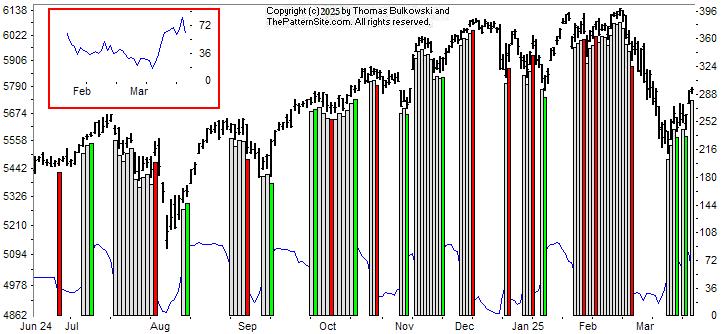
This is a picture of the chart pattern indicator on the daily scale. The indicator is the line chart below a chart of the S&P 500 composite.
The opposite of what happened in February with the bearish (red) and neutral (white) bars is happening now with bullish (green) and neutral bars.
The indicator is neutral with a reading of 62 (where 100 is highest, 0 is lowest).
It's possible that this is an upward retrace of a primary down move. That means the index could drop soon. The CPI says that's not the case, though.
The inset in the upper left of the chart shows how the CPI has rebounded from recent lows. Notice how today (Tuesday) was an up day (higher close) in the index, but the CPI turned lower.
$ $ $
Here's a symbol list of 165 chart and candlestick patterns (13 "investment grade" candle patterns) found in today's securities using my version of Patternz: ABT, AEIS, AES, AFL, A, ATSG, AKAM, ALK, ALGT, DOX, AEO, AMN, AR, ASH, BCPC, BAX, BIIB, BKH, BKNG, BOOT, BMY, BR, CNC, CRL, CI, CINF, CLX, CNX, CL, CMTL, CAG, COST, CCRN, CCK, DFS, DSGR, DTE, BOOM, EMN, EBAY, ELV, EQT, EVH, EZPW, FFIV, FARO, FMC, FTNT, FWRD, FDP, GIS, GPRO, GES, HSIC, HUBG, JBHT, HUN, IDA, INCY, IBP, IBKR, ISRG, IRM, JBLU, JNJ, KLIC, LH, LEG, LLY, LNC, RAMP, MAN, MDT, MGEE, MYGN, NFLX, NWL, JWN, NOC, ON, OR, OMI, PANW, PEN, PFE, PPG, PG, PRU, RL, RRC, REGN, RGS, ROP, R, SAIA, SAND, SLB, SEE, SEIC, SRE, NOW, SLGN, SKX, LUV, SWX, SSYS, SRDX, TPR, TECH, TEVA, TTD, TJX, RIG, TG, TWLO, UPS, UNH, UNM, VFC, WAT, WLK, WMB, WWW, WWD, ITA, IYK, IYC, IHE, IDU, FDN, ICF, IYH, EWA, EWC, EWH, EPP, EWS, EWP, QLD, IBB, PBE, PXJ, XLY, XLP, XLV, UNG, VHT. Click this link for details (pattern type, start and end dates).
For a list of small patterns (those a few days wide) click this link.
-- Thomas Bulkowski
![]()
$ $ $
I show another slider trading quiz featuring UIL Holdings: UIL stock.
$ $ $
Here's a symbol list of 183 chart and candlestick patterns (13 "investment grade" candle patterns) found in today's securities using my version of Patternz: ACIW, AMD, AES, AFL, ALB, AA, ALGT, AMZN, AEO, AXP, AFG, AR, APOG, AVNT, AXS, BMI, BIIB, BMRN, BKNG, BSX, BFH, BLDR, CDNS, CALM, CPB, CLS, CENX, CDAY, CLX, CNO, CL, CAG, COP, COST, CCRN, XRAY, FANG, DFS, ^DJI, DTE, BOOM, EXP, EIX, EME, EXPD, FARO, FAST, FIVN, FLEX, FORM, FCX, GME, GIS, GILD, GPN, GS, GPRO, GFF, GES, HBI, HLIT, HSII, HSY, HNI, HOLX, HOV, HWM, ITW, ILMN, IBP, PODD, INTC, TILE, IPG, JKHY, JNJ, KMT, LHX, LEG, LEN, MHO, MTSI, MGY, MAN, MLM, MA, MTDR, MTRX, MU, MLKN, MCO, MS, NBR, NOV, NFLX, NTGR, JWN, NTNX, NVDA, OXY, OLN, OTEX, ORCL, PKG, PANW, PDCO, PYPL, PEN, PLXS, POR, PFG, PRU, PEG, PSTG, QTWO, RMBS, RLI, SCHW, SMTC, SCI, NOW, SHOP, SKYW, LUV, SCS, SNPS, TRGP, TDOC, TEVA, TOL, RIG, TZOO, TG, TREX, VLO, VMC, WU, WMB, WOLF, WWD, ITA, IAI, IEZ, IHE, DDM, FDN, IAT, IXC, ILF, IYF, EWK, EWC, EWH, EWS, PBE, PEJ, XLF, XRT, UNG, VHT. Click this link for details (pattern type, start and end dates).
For a list of small patterns (those a few days wide) click this link.
$ $ $
The following table shows where Fibonacci retrace values of the day's high-low range are plus pivot points, calculated on the Dow industrials, sorted by value. When several are near each other (small differences), the area might act as support or resistance.
-- Thomas Bulkowski
![]()
| © 2025 ThePatternSite.com Metric | Value | Diff | Close (within 10% of the high-low range for the day)? |
| Monthly S2 | 38,652.67 | ||
| Monthly S1 | 40,618.00 | 1,965.32 | |
| Weekly S2 | 41,244.58 | 626.58 | |
| Weekly S1 | 41,913.95 | 669.37 | |
| Daily S2 | 42,008.73 | 94.78 | |
| Weekly Pivot | 42,082.12 | 73.39 | |
| Low | 42,180.14 | 98.02 | |
| Open | 42,180.14 | 0.00 | Yes! The Open is close to the Low. |
| Daily S1 | 42,296.02 | 115.88 | |
| 61.8% Down from Intraday High | 42,355.37 | 59.34 | |
| 50% Down from Intraday High | 42,409.50 | 54.13 | |
| 38.2% Down from Intraday High | 42,463.62 | 54.13 | |
| Daily Pivot | 42,467.44 | 3.82 | Yes! The Daily Pivot is close to the 38.2% Down from Intraday High. |
| Close | 42,583.32 | 115.88 | |
| Monthly Pivot | 42,627.09 | 43.77 | Yes! The Monthly Pivot is close to the Close. |
| High | 42,638.85 | 11.76 | Yes! The High is close to the Monthly Pivot. |
| Weekly R1 | 42,751.49 | 112.64 | |
| Daily R1 | 42,754.73 | 3.25 | Yes! The Daily R1 is close to the Weekly R1. |
| Weekly R2 | 42,919.66 | 164.93 | |
| Daily R2 | 42,926.15 | 6.49 | Yes! The Daily R2 is close to the Weekly R2. |
| Monthly R1 | 44,592.42 | 1,666.27 | |
| Monthly R2 | 46,601.51 | 2,009.09 |
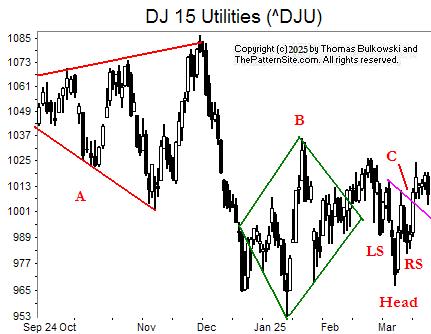
I show the Dow utilities on the daily scale.
At A, we have a chart pattern called a broadening pattern. From this view, I can't tell if it's a top or bottom (meaning I can't tell from which direction price entered the pattern).
The breakout is downward (a close below the lowest low in the pattern), but the index didn't drop much farther.
Pattern B is harder to spot if you remove my green lines. It's a diamond bottom. This one has an upward breakout when the index closes above the upper right diagonal. Price has moved sideways since then.
Along the way, it formed a head-and-shoulders bottom, shown with an upward breakout at the neckline at C. The index hasn't climbed much so far.
My guess is that the index will struggle to move in any direction. I suppose one can argue that we're overdue for a trend to start.
![]()
The following is a brief review of how the markets performed over time. The numbers refer to the close-to-close move in the Dow industrials.
No options expire this week.
![]()
The following is based on an SFO article in December 2004 by John Seekinger, titled, "Take a two-dimensional approach." He offers these tips.
| Index | S2 | S1 | Pivot | R1 | R2 |
| Dow Industrials (^DJI): Daily | 41,233 | 41,609 | 41,810 | 42,187 | 42,388 |
| Weekly | 41,045 | 41,515 | 41,883 | 42,353 | 42,720 |
| Monthly | 38,453 | 40,219 | 42,428 | 44,194 | 46,402 |
| S&P500 (^GSPC): Daily | 5,579 | 5,623 | 5,647 | 5,691 | 5,715 |
| Weekly | 5,543 | 5,605 | 5,660 | 5,723 | 5,778 |
| Monthly | 5,130 | 5,399 | 5,773 | 6,042 | 6,416 |
| Nasdaq (^IXIC): Daily | 17,362 | 17,573 | 17,686 | 17,896 | 18,009 |
| Weekly | 17,220 | 17,502 | 17,714 | 17,996 | 18,208 |
| Monthly | 15,506 | 16,645 | 18,377 | 19,517 | 21,249 |
Here are the formulas:
![]()
Earnings season is over.
Here's a symbol list of 153 chart and candlestick patterns (13 "investment grade" candle patterns) found in today's securities using my version of Patternz: ADTN, AES, ATSG, ALB, AA, ALKS, AR, ADSK, AVY, AVNT, AVA, BMI, BALL, BERY, BBY, BIIB, BKH, BMY, CDNS, CALM, CPB, CENX, CHD, CI, CTAS, CLNE, CLF, CL, CAG, COP, CXW, COTY, CCRN, FANG, BOOM, EMN, EME, EXPI, EXPD, EZPW, FAST, FDX, FCX, GIS, GILD, GPRO, GES, HSII, HELE, HSIC, HSY, HNI, IDA, IEX, ITW, INCY, INTC, IPAR, IBKR, JKHY, JNJ, KALU, KBH, KELYA, LAMR, LDOS, MTSI, MGY, MLM, MAS, MTDR, MTRX, META, MGEE, MU, MLKN, NBR, NOV, NFLX, NJR, NKE, NI, JWN, NTNX, NVDA, OXY, OLN, PKG, PANW, PKE, PAYX, PETS, PFE, PGR, PEG, PSTG, KWR, RMBS, REGN, RGS, ROG, SCHW, SMG, SMTC, LUV, SCS, TRGP, TEVA, TSCO, TDG, RIG, TG, UHAL, UPS, VLO, VMI, VECO, WU, WOLF, WWD, XEL, FXI, IYZ, IEV, MXI, ITB, EWQ, EWH, EZA, EWT, TUR, PBE, XRT, UNG, SMH. Click this link for details (pattern type, start and end dates).
For a list of small patterns (those a few days wide) click this link.
The below industries were the best (rank 1) or worst performing of those I follow.
|
-- Thomas Bulkowski
![]()
Here's a symbol list of 124 chart and candlestick patterns (13 "investment grade" candle patterns) found in today's securities using my version of Patternz: ACN, AES, AFL, ALB, AA, AMED, AEP, AR, BECN, BIIB, BMRN, BOOT, BMY, CBT, CDNS, CALM, CPB, CNC, CENX, CTSH, CL, CAG, COP, CCRN, FANG, BOOM, EMN, EIX, ELV, EME, EPAM, EVRG, EXPD, FARO, FAST, FISV, FNV, FCX, GME, GIS, GILD, GPRO, GES, HSII, HSY, HOLX, HUN, HURC, ITW, INTC, IPAR, JKHY, JNJ, KALU, LAMR, LLY, MTSI, MGY, MCHX, MKTX, MLM, MTDR, MTRN, MTRX, MU, MS, NBR, NOV, NFLX, JWN, NTNX, NVDA, OXY, OLN, PANW, PETS, PFE, PG, PEG, PHM, PSTG, DGX, RMBS, RLI, ROG, ROL, SBH, SCHW, SMTC, NOW, SGI, LUV, TRGP, TECH, TEVA, RIG, TG, VLO, VECO, VEEV, WU, WOLF, WWD, XEL, IYK, IDU, BOTZ, EWH, EWM, IBB, DBA, UNG, SMH. Click this link for details (pattern type, start and end dates).
For a list of small patterns (those a few days wide) click this link.
$ $ $
You can find setups based on a Fibonacci retrace by clicking on the link.
The following patterns were found manually, not using Patternz. Mr. Bulkowski has excluded any securities he owns from appearing in the list. However, he may add any of the securities listed to his portfolio at any time, just as you can.
In the table below, the red and green colors are based on the historical breakout direction for the associated chart pattern. If a high and tight flag appears, the start and end dates highlight the flagpole only and not the flag.
For details about the chart patterns, click here.
-- Thomas Bulkowski, author: Invest for Two-Comma Wealth and the novel (fiction), Foresight (#Ad)
![]()
| Symbol | Chart Pattern | Bullish Bearish | Start | End | Industry |
| AES | Head-and-shoulders bottom | 02/04/2025 | 02/27/2025 | Electric Utility (East) | |
| APD | Head-and-shoulders top | 02/25/2025 | 03/07/2025 | Chemical (Diversified) | |
| AA | Pipe bottom | 03/03/2025 | 03/10/2025 | Aerospace/Defense | |
| AR | Pipe bottom | 03/03/2025 | 03/10/2025 | Natural Gas (Diversified) | |
| AIZ | Double Bottom, Eve and Eve | 02/21/2025 | 03/12/2025 | Insurance (Diversified) | |
| ATO | Triangle, symmetrical | 03/04/2025 | 03/20/2025 | Natural Gas (Diversified) | |
| AVA | Triangle, ascending | 02/26/2025 | 03/20/2025 | Electric Utility (West) | |
| BG | Diamond top | 02/24/2025 | 03/20/2025 | Food Processing | |
| CDNS | Pipe bottom | 03/03/2025 | 03/10/2025 | Computer Software and Svcs | |
| CALM | Double Bottom, Adam and Adam | 03/06/2025 | 03/13/2025 | Food Processing | |
| CE | Pipe bottom | 02/24/2025 | 03/03/2025 | Chemical (Basic) | |
| CRL | Pipe bottom | 02/10/2025 | 02/18/2025 | Biotechnology | |
| CVX | Double Bottom, Eve and Adam | 02/03/2025 | 03/05/2025 | Petroleum (Integrated) | |
| COP | Pipe bottom | 03/03/2025 | 03/10/2025 | Petroleum (Integrated) | |
| CXW | Double Bottom, Adam and Adam | 02/21/2025 | 03/04/2025 | Industrial Services | |
| CR | Diamond bottom | 03/04/2025 | 03/20/2025 | Diversified Co. | |
| EL | Double Top, Eve and Eve | 02/26/2025 | 03/10/2025 | Toiletries/Cosmetics | |
| XOM | Head-and-shoulders bottom | 02/13/2025 | 03/13/2025 | Petroleum (Integrated) | |
| FCX | Pipe bottom | 03/03/2025 | 03/10/2025 | Metals and Mining (Div.) | |
| FRD | Double Bottom, Adam and Eve | 02/24/2025 | 03/12/2025 | Building Materials | |
| GILD | Pipe top | 03/03/2025 | 03/10/2025 | Biotechnology | |
| GPRO | Pipe bottom | 03/03/2025 | 03/10/2025 | Electronics | |
| GFF | Double Bottom, Adam and Eve | 03/04/2025 | 03/13/2025 | Building Materials | |
| GES | Double Bottom, Eve and Adam | 03/04/2025 | 03/13/2025 | Apparel | |
| HQY | Dead-cat bounce | 03/19/2025 | 03/19/2025 | Healthcare Information | |
| HL | Head-and-shoulders bottom | 12/19/2024 | 01/13/2025 | Metals and Mining (Div.) | |
| HSY | Pipe top | 03/03/2025 | 03/10/2025 | Food Processing | |
| INCY | Double Top, Adam and Adam | 02/07/2025 | 02/25/2025 | Drug | |
| IIIN | Double Bottom, Eve and Adam | 03/05/2025 | 03/14/2025 | Building Materials | |
| MGY | Pipe bottom | 03/03/2025 | 03/10/2025 | Petroleum (Producing) | |
| MLM | Pipe bottom | 03/03/2025 | 03/10/2025 | Cement and Aggregates | |
| MTRX | Pipe bottom | 03/03/2025 | 03/10/2025 | Oilfield Svcs/Equipment | |
| MOS | Pipe bottom | 02/24/2025 | 03/03/2025 | Chemical (Diversified) | |
| POR | Triangle, symmetrical | 03/04/2025 | 03/20/2025 | Electric Utility (West) | |
| PEG | Pipe bottom | 03/03/2025 | 03/10/2025 | Electric Utility (East) | |
| RMBS | Pipe bottom | 03/03/2025 | 03/10/2025 | Semiconductor Cap Equip. | |
| SIGI | Pipe bottom | 02/18/2025 | 02/24/2025 | Insurance (Prop/Casualty) | |
| SMTC | Pipe bottom | 03/03/2025 | 03/10/2025 | Semiconductor Cap Equip. | |
| STR | Double Bottom, Eve and Adam | 03/05/2025 | 03/14/2025 | Natural Gas (Diversified) | |
| LUV | Pipe bottom | 03/03/2025 | 03/10/2025 | Air Transport | |
| TDG | Triangle, ascending | 01/23/2025 | 03/20/2025 | Aerospace/Defense | |
| RIG | Pipe bottom | 03/03/2025 | 03/10/2025 | Oilfield Svcs/Equipment | |
| UNH | Ugly double bottom | 02/21/2025 | 03/13/2025 | Medical Services | |
| VLO | Pipe bottom | 03/03/2025 | 03/10/2025 | Petroleum (Integrated) | |
| WOLF | Triangle, ascending | 03/03/2025 | 03/20/2025 | Semiconductor |
![]()
$ $ $
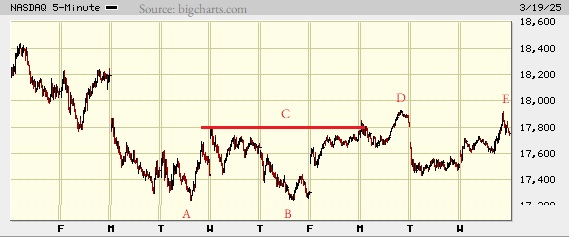
I show a picture of the Nasdaq composite on the 5-minute scale.
At AB, we see a double bottom that confirms as a valid chart pattern when the index rises above the horizontal red line, at C.
However, the index only climbed to D (so far) which is well below what the measure rule (the height of the pattern added to the price of the top of it) suggests (but doesn't guarantee). Are you sick of (parentheses)?
![]()
At E, we see a peak that matches the one at D. The prior peak (D) has setup overhead resistance and the index failed to push through it today. It might try for a new high tomorrow.
$ $ $
Here's a symbol list of 174 chart and candlestick patterns (13 "investment grade" candle patterns) found in today's securities using my version of Patternz: AES, ATSG, ALB, AA, AMED, AEE, AIG, APH, AR, AMAT, ATO, ADSK, BAX, BIIB, BA, BKNG, BMY, CBT, CDNS, CALM, CPB, CX, CENX, CHKP, CINF, CLF, CLX, CNO, CL, CAG, COP, CSGP, CROX, CW, DECK, DVN, FANG, DDS, BOOM, EME, EOG, EVRG, EXPD, EZPW, FAST, FLS, FCX, FRD, GIS, GILD, GPRO, GFF, GES, HQY, HTLD, HSII, HSY, HOLX, IDXX, ITW, ILMN, INTC, JKHY, JNJ, KALU, KLAC, KSS, MTSI, MGY, MCHX, MLM, MAS, MTDR, MTRN, MTRX, MDT, MU, MOS, NBR, NOV, NFLX, NTNX, NVDA, OXY, ORI, OLN, OMC, OMI, PANW, PKE, PFE, PNW, PLXS, PPG, PFG, PEG, PSTG, RL, RMBS, RJF, RTX, RCKY, ROG, RES, R, SCHW, SIGI, SMTC, STR, SGI, LUV, SWX, SXI, SNPS, TRGP, TECH, TEVA, TDG, RIG, TG, VLO, VMI, VECO, MDRX, VC, WERN, WU, WSM, WOLF, WWD, ITA, ILF, IEO, EWH, EIS, EZA, THD, EWU, PPA, PBE, PEJ, PXJ, PJP, ROBO, XAR, UNG, SMH, VAW. Click this link for details (pattern type, start and end dates).
For a list of small patterns (those a few days wide) click this link.
$ $ $
The following table shows where Fibonacci retrace values of the day's high-low range are plus pivot points, calculated on the Nasdaq composite, sorted by value. When several are near each other (small differences), the area might act as support or resistance.
-- Thomas Bulkowski
![]()
| © 2025 ThePatternSite.com Metric | Value | Diff | Close (within 10% of the high-low range for the day)? |
| Monthly S2 | 15,494.51 | ||
| Monthly S1 | 16,622.65 | 1,128.14 | |
| Weekly S2 | 16,989.20 | 366.55 | |
| Daily S2 | 17,350.49 | 361.29 | |
| Weekly S1 | 17,370.00 | 19.51 | Yes! The Weekly S1 is close to the Daily S2. |
| Low | 17,533.94 | 163.94 | |
| Daily S1 | 17,550.64 | 16.70 | Yes! The Daily S1 is close to the Low. |
| Open | 17,590.12 | 39.48 | |
| Weekly Pivot | 17,619.03 | 28.91 | Yes! The Weekly Pivot is close to the Open. |
| 61.8% Down from Intraday High | 17,680.47 | 61.44 | |
| 50% Down from Intraday High | 17,725.74 | 45.27 | |
| Daily Pivot | 17,734.09 | 8.35 | Yes! The Daily Pivot is close to the 50% Down from Intraday High. |
| Close | 17,750.79 | 16.70 | Yes! The Close is close to the Daily Pivot. |
| 38.2% Down from Intraday High | 17,771.00 | 20.21 | Yes! The 38.2% Down from Intraday High is close to the Close. |
| High | 17,917.54 | 146.54 | |
| Daily R1 | 17,934.24 | 16.70 | Yes! The Daily R1 is close to the High. |
| Weekly R1 | 17,999.83 | 65.59 | |
| Daily R2 | 18,117.69 | 117.86 | |
| Weekly R2 | 18,248.86 | 131.17 | |
| Monthly Pivot | 18,366.38 | 117.52 | |
| Monthly R1 | 19,494.52 | 1,128.14 | |
| Monthly R2 | 21,238.25 | 1,743.73 |
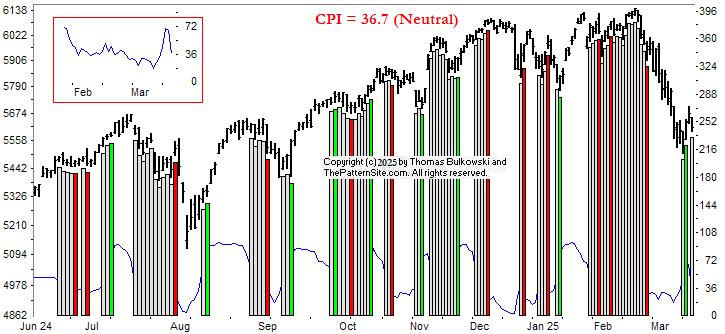
This is a picture of the chart pattern indicator on the daily scale. The indicator is the line chart below a chart of the S&P 500 composite.
Three trading day ago the CPI turned bullish (green vertical bar on far right of chart), but couldn't hold it. The indicator is neutral now. I show that with a white bar.
The inset (upper left) shows how the indicator progressed over time, going back to January. The blue line shows a distinct hump a few days ago when the markets soared, but has since returned to earth. The most recent reading of 36.7, is less than 2 points above bearish territory.
The index looks like it's forming a measured move down pattern. The pause we see is part of the corrective phase and it represents indecision. I expect the downtrend to continue.
$ $ $
Here's a symbol list of 129 chart and candlestick patterns (13 "investment grade" candle patterns) found in today's securities using my version of Patternz: ABT, AXDX, AES, AFL, ALB, AA, AMZN, AMED, AIG, ANIK, AR, AAPL, ASH, AGO, BAX, BECN, BIIB, BMY, CBT, CDNS, CALM, CPB, CENX, CF, CLNE, CLF, CNX, CL, CAG, COP, CRH, FANG, DFS, BOOM, ECL, EME, EQT, EXPD, FAST, FORM, FCX, GIS, GILD, GPRO, GES, HSII, HSY, JBHT, ITW, ILMN, INTC, JKHY, JBLU, JNJ, KALU, KELYA, KFRC, MTSI, MGY, MANH, MCHX, MLM, MTDR, MTRX, MDT, MU, MUR, NBR, NOV, NFLX, NTNX, NVDA, OXY, ORI, OLN, OR, PANW, PG, PEG, PSTG, RMBS, RRC, RCKY, ROG, RGLD, SCHW, SMTC, LUV, SR, SXI, SCS, TRGP, TECH, TFX, TEVA, RIG, TZOO, TG, VLO, VECO, WU, WLK, WMB, WOLF, WWD, IXC, MXI, EWZ, EWH, EWI, EZA, EWP, TUR, PXJ, XLY, XLE, GLD, XLV, UNG, SMH. Click this link for details (pattern type, start and end dates).
For a list of small patterns (those a few days wide) click this link.
-- Thomas Bulkowski
![]()
$ $ $
I show another slider trading quiz featuring United Online: UNTD stock.
$ $ $
Here's a symbol list of 85 chart and candlestick patterns (13 "investment grade" candle patterns) found in today's securities using my version of Patternz: AXDX, ACIW, AES, ALK, ALB, AA, AMZN, AMGN, AIZ, ATO, AXS, BAH, CACI, CE, CIEN, CI, CTAS, CTS, DVN, EL, EVRG, EVH, FICO, FARO, FCX, HL, HSII, HNI, HOLX, HUBG, INCY, IPAR, JAZZ, JNJ, K, LH, LLY, LNC, MTDR, MOS, MUR, NEU, NOC, NTNX, PDCO, PAYX, RLI, SBH, STR, SCCO, TEVA, UNM, MDRX, V, XEL, ZBRA, IHE, ICF, IEV, MXI, ILF, IEO, EWA, EWO, EWK, EWZ, ECH, EEM, EWQ, EWH, EWI, EWJ, EWM, EWW, EWY, EWP, EWL, TUR, IBB. Click this link for details (pattern type, start and end dates).
For a list of small patterns (those a few days wide) click this link.
$ $ $
The following table shows where Fibonacci retrace values of the day's high-low range are plus pivot points, calculated on the Dow industrials, sorted by value. When several are near each other (small differences), the area might act as support or resistance.
-- Thomas Bulkowski
![]()
| © 2025 ThePatternSite.com Metric | Value | Diff | Close (within 10% of the high-low range for the day)? |
| Monthly S2 | 38,316.87 | ||
| Weekly S2 | 39,802.00 | 1,485.13 | |
| Monthly S1 | 40,079.25 | 277.25 | |
| Weekly S1 | 40,821.81 | 742.56 | |
| Daily S2 | 41,155.48 | 333.66 | |
| Low | 41,412.75 | 257.27 | |
| Open | 41,460.22 | 47.47 | Yes! The Open is close to the Low. |
| Daily S1 | 41,498.55 | 38.34 | Yes! The Daily S1 is close to the Open. |
| 61.8% Down from Intraday High | 41,642.08 | 143.53 | |
| Weekly Pivot | 41,681.59 | 39.50 | Yes! The Weekly Pivot is close to the 61.8% Down from Intraday High. |
| 50% Down from Intraday High | 41,712.93 | 31.34 | Yes! The 50% Down from Intraday High is close to the Weekly Pivot. |
| Daily Pivot | 41,755.83 | 42.90 | Yes! The Daily Pivot is close to the 50% Down from Intraday High. |
| 38.2% Down from Intraday High | 41,783.77 | 27.94 | Yes! The 38.2% Down from Intraday High is close to the Daily Pivot. |
| Close | 41,841.63 | 57.86 | Yes! The Close is close to the 38.2% Down from Intraday High. |
| High | 42,013.10 | 171.47 | |
| Daily R1 | 42,098.90 | 85.80 | |
| Daily R2 | 42,356.18 | 257.27 | |
| Monthly Pivot | 42,424.15 | 67.97 | |
| Weekly R1 | 42,701.40 | 277.25 | |
| Weekly R2 | 43,561.18 | 859.77 | |
| Monthly R1 | 44,186.53 | 625.36 | |
| Monthly R2 | 46,531.43 | 2,344.90 |
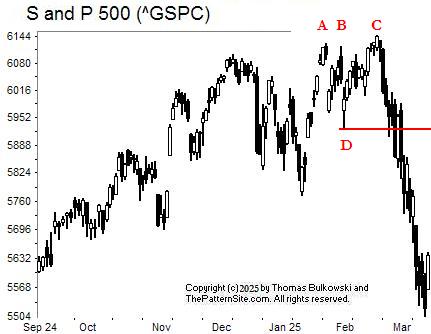
This is a chart of the S&P 500 index. Not much appears on the chart in terms of chart patterns.
ABC is a triple top. It confirms as a valid chart pattern when the index drops below the lowest valley between the three peaks
I show that price at D with a horizontal red line.
After confirmation, the index makes a startling drop to the recent low.
What comes next? That's impossible to predict with any certainty. Political moves are throwing the markets around.
![]()
The following is a brief review of how the markets performed over time. The numbers refer to the close-to-close move in the Dow industrials.
Many options expire this week, so traders will be looking to close out their positions, and that suggests increased volatility (large daily price swings).
![]()
The following is based on an SFO article in December 2004 by John Seekinger, titled, "Take a two-dimensional approach." He offers these tips.
| Index | S2 | S1 | Pivot | R1 | R2 |
| Dow Industrials (^DJI): Daily | 40,717 | 41,102 | 41,315 | 41,701 | 41,914 |
| Weekly | 39,684 | 40,586 | 41,564 | 42,466 | 43,443 |
| Monthly | 38,199 | 39,844 | 42,306 | 43,951 | 46,414 |
| S&P500 (^GSPC): Daily | 5,535 | 5,587 | 5,616 | 5,668 | 5,697 |
| Weekly | 5,416 | 5,527 | 5,616 | 5,728 | 5,817 |
| Monthly | 5,121 | 5,380 | 5,764 | 6,023 | 6,406 |
| Nasdaq (^IXIC): Daily | 17,390 | 17,572 | 17,673 | 17,855 | 17,955 |
| Weekly | 16,990 | 17,372 | 17,620 | 18,002 | 18,250 |
| Monthly | 15,496 | 16,625 | 18,367 | 19,497 | 21,239 |
Here are the formulas:
![]()
Earnings season is over.
Here's a symbol list of 133 chart and candlestick patterns (13 "investment grade" candle patterns) found in today's securities using my version of Patternz: ABT, AXDX, ACIW, AYI, AMD, ALRM, AMZN, AXP, AME, AMN, APH, ACGL, ADSK, AXS, BZH, BKNG, BRC, BFH, CE, CF, CINF, CNO, CMCO, CTS, CMI, ^DJI, DOV, EME, EVH, EXPI, FICO, FARO, FLS, FTV, HL, HWM, HUM, IEX, IIIN, IPAR, IPI, JAZZ, JNJ, LLY, LNC, RAMP, MKTX, MTRN, MU, MS, MOS, ^IXIC, JWN, NTNX, NVDA, ORI, PATK, PYPL, PLXS, PPL, PHM, KWR, RJF, RGA, RNG, ROK, ROG, ^GSPC, SAND, SEE, NOW, SHOP, SPSC, SNPS, TRGP, TDG, RIG, UIS, UNM, VMI, MDRX, VRSN, WMB, ZBRA, IAI, IYC, IEZ, FTEC, FDN, QTEC, FXL, BOTZ, QQQ, IAT, IGV, IXN, ILF, IYF, EWO, EWK, EWZ, EWC, ECH, EWG, EWH, EIS, EWJ, EWM, EWW, EWY, EWP, EWD, THD, TUR, QLD, DBA, PBE, PXJ, SSO, XLY, XLF, XRT, SPY, XLK, MGK, VONG. Click this link for details (pattern type, start and end dates).
For a list of small patterns (those a few days wide) click this link.
The below industries were the best (rank 1) or worst performing of those I follow.
|
-- Thomas Bulkowski
![]()
Here's a symbol list of 89 chart and candlestick patterns (13 "investment grade" candle patterns) found in today's securities using my version of Patternz: DDD, MMM, AXDX, ACIW, ADBE, ATSG, ALKS, AR, ACGL, ARW, AXS, CPB, CE, CDAY, CINF, CL, CMTL, CAG, CR, DFS, BOOM, EPAM, EL, EXPD, FICO, FARO, FCX, FRD, GIS, HL, HSII, HP, HNI, HOLX, INTC, IPAR, JAZZ, JNJ, LLY, M, MRCY, MOS, MLI, NFG, NI, NTNX, ORI, PKE, PTEN, PFG, RCKY, SBH, SAND, SCHW, SCCO, SWX, SXI, SCS, SRDX, TRGP, RIG, UNM, WAT, WU, WSC, IYK, IHE, FXI, BOTZ, ILF, ITB, ECH, EWH, EWM, EWD, EWT, PBE, PXJ, PJP, ROBO, XLP, GLD, SMH. Click this link for details (pattern type, start and end dates).
For a list of small patterns (those a few days wide) click this link.
$ $ $
You can find setups based on a Fibonacci retrace by clicking on the link.
The following patterns were found manually, not using Patternz. Mr. Bulkowski has excluded any securities he owns from appearing in the list. However, he may add any of the securities listed to his portfolio at any time, just as you can.
In the table below, the red and green colors are based on the historical breakout direction for the associated chart pattern. If a high and tight flag appears, the start and end dates highlight the flagpole only and not the flag.
For details about the chart patterns, click here.
-- Thomas Bulkowski, author: Invest for Two-Comma Wealth and the novel (fiction), Foresight (#Ad)
![]()
| Symbol | Chart Pattern | Bullish Bearish | Start | End | Industry |
| AME | Double Top, Adam and Adam | 01/23/2025 | 03/03/2025 | Industrial Services | |
| AAPL | Double Top, Adam and Eve | 01/31/2025 | 02/25/2025 | Computers and Peripherals | |
| ADM | Double Bottom, Eve and Adam | 02/13/2025 | 03/05/2025 | Food Processing | |
| AVY | Double Top, Adam and Adam | 03/03/2025 | 03/10/2025 | Packaging and Container | |
| AVNT | Double Top, Adam and Eve | 01/30/2025 | 02/13/2025 | Chemical (Specialty) | |
| BERY | Broadening top | 02/21/2025 | 03/13/2025 | Packaging and Container | |
| BKNG | Double Top, Eve and Adam | 12/06/2024 | 02/21/2025 | Internet | |
| BRKR | Triple top | 11/06/2024 | 01/13/2025 | Precision Instrument | |
| CRL | Ugly double bottom | 02/12/2025 | 03/04/2025 | Biotechnology | |
| CNA | Diamond top | 01/27/2025 | 02/21/2025 | Insurance (Prop/Casualty) | |
| CNO | Double Top, Eve and Adam | 02/14/2025 | 03/03/2025 | Insurance (Diversified) | |
| CMTL | Dead-cat bounce | 03/13/2025 | 03/13/2025 | Telecom. Equipment | |
| CMI | Double Top, Eve and Eve | 12/09/2024 | 02/19/2025 | Machinery | |
| EVH | Double Bottom, Adam and Eve | 02/27/2025 | 03/05/2025 | Healthcare Information | |
| FDP | Broadening bottom | 02/26/2025 | 03/12/2025 | Food Processing | |
| GGG | Double Top, Eve and Adam | 02/21/2025 | 03/10/2025 | Machinery | |
| IBP | Double Bottom, Adam and Adam | 02/24/2025 | 03/04/2025 | Retail Building Supply | |
| IPAR | Pipe top | 02/24/2025 | 03/03/2025 | Toiletries/Cosmetics | |
| JNJ | Double Top, Adam and Adam | 03/04/2025 | 03/10/2025 | Medical Supplies | |
| KALU | Triple top | 01/21/2025 | 02/20/2025 | Metals and Mining (Div.) | |
| KELYA | Triple top | 01/06/2025 | 02/13/2025 | Human Resources | |
| KLAC | Double Top, Eve and Adam | 01/22/2025 | 02/20/2025 | Semiconductor Cap Equip. | |
| KSS | Dead-cat bounce | 03/11/2025 | 03/11/2025 | Retail Store | |
| LH | Double Top, Adam and Adam | 01/30/2025 | 03/05/2025 | Medical Services | |
| LAMR | Triangle, symmetrical | 02/20/2025 | 03/06/2025 | Advertising | |
| LANC | Head-and-shoulders top | 02/14/2025 | 03/10/2025 | Food Processing | |
| LLY | Pipe top | 02/24/2025 | 03/03/2025 | Drug | |
| LXU | Double Top, Adam and Adam | 01/15/2025 | 01/21/2025 | Building Materials | |
| MAN | Double Bottom, Adam and Eve | 01/10/2025 | 02/24/2025 | Human Resources | |
| MKTX | Head-and-shoulders bottom | 02/12/2025 | 02/28/2025 | Securities Brokerage | |
| MRCY | Double Bottom, Eve and Eve | 02/24/2025 | 03/11/2025 | Computers and Peripherals | |
| MOS | Triple top | 01/24/2025 | 02/05/2025 | Chemical (Diversified) | |
| ORI | Pipe top | 02/24/2025 | 03/03/2025 | Insurance (Prop/Casualty) | |
| OR | Double Bottom, Eve and Adam | 02/28/2025 | 03/10/2025 | Metals and Mining (Div.) | |
| OUT | Double Top, Adam and Eve | 01/21/2025 | 02/18/2025 | Advertising | |
| PKG | Roof, inverted | 02/03/2025 | 03/03/2025 | Packaging and Container | |
| PFE | Triple top | 02/25/2025 | 03/10/2025 | Drug | |
| PG | Double Top, Adam and Adam | 03/04/2025 | 03/10/2025 | Household Products | |
| KWR | Head-and-shoulders top | 01/27/2025 | 03/10/2025 | Chemical (Specialty) | |
| DGX | Broadening top | 02/25/2025 | 03/10/2025 | Medical Services | |
| ROP | Double Top, Adam and Eve | 02/25/2025 | 03/05/2025 | Industrial Services | |
| SAIC | Double Bottom, Adam and Adam | 02/24/2025 | 03/03/2025 | IT Services | |
| SEE | Double Top, Eve and Eve | 01/27/2025 | 02/25/2025 | Packaging and Container | |
| SEIC | Double Top, Adam and Eve | 12/13/2024 | 01/30/2025 | IT Services | |
| SCI | Ugly double bottom | 02/11/2025 | 03/05/2025 | Industrial Services | |
| NOW | Double Top, Eve and Adam | 12/11/2024 | 01/28/2025 | IT Services | |
| SGI | Double Top, Adam and Eve | 02/03/2025 | 02/18/2025 | Furn/Home Furnishings | |
| TDY | Triple top | 01/23/2025 | 03/03/2025 | Aerospace/Defense | |
| TER | Dead-cat bounce | 03/11/2025 | 03/11/2025 | Semiconductor Cap Equip. | |
| TSCO | Triple top | 01/28/2025 | 03/10/2025 | Retail Building Supply | |
| UHAL | Double Top, Eve and Adam | 01/31/2025 | 02/18/2025 | Trucking/Transp. Leasing | |
| WLK | Double Top, Eve and Adam | 01/28/2025 | 02/18/2025 | Chemical (Basic) | |
| WMB | Double Top, Eve and Adam | 02/19/2025 | 03/03/2025 | Natural Gas (Distributor) | |
| WDAY | Double Top, Adam and Adam | 02/06/2025 | 02/26/2025 | Computer Software and Svcs |
![]()
$ $ $
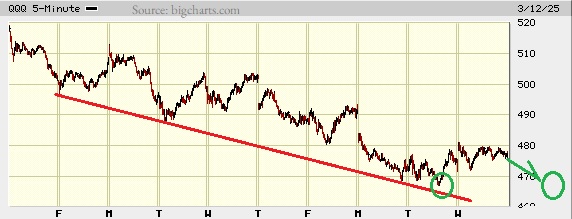
I show a picture of the Nasdaq composite on the 5-minute scale.
I drew a red trendline downward, connecting the bottoms. It looked like the valleys aligned, so that's why I drew the line. It acts as support, as the chart shows where it bounced off the line.
I've never been able to rationalize why trends form, why price bounces off a trendline that really isn't there. But it does.
Anyway, the trendline was a sideshow. I wanted to show what I think will happen with the index. That is, it'll form a second bottom (right green circle), similar to the first green circle (left one).
It'll form an unconfirmed double bottom, which are two valleys near the same price. Of course, political events can change the landscape, so this is just a guess.
$ $ $
Here's a symbol list of 125 chart and candlestick patterns (13 "investment grade" candle patterns) found in today's securities using my version of Patternz: DDD, MMM, ANF, AXDX, ACIW, AYI, ALKS, ALGT, AMZN, AMED, AEP, AMGN, AMN, ACGL, ADM, ARW, AVY, AVNT, AXS, BMI, BIIB, BA, BRC, CALM, CE, CX, CVX, CI, CINF, CLX, CNO, CNX, CL, COTY, CROX, CCK, XRAY, D, EIX, EPAM, EG, EXPI, XOM, FICO, FARO, FRD, GME, GIS, GNW, GL, THG, HL, HSII, HNI, HOLX, HUBG, HUN, IPAR, IRM, JAZZ, JBLU, JNJ, KALU, KSS, LLY, LNC, MTSI, MRCY, MOS, MLI, NBR, NTGR, JWN, NUS, NTNX, OXY, ORI, OLN, OXM, PANW, PDCO, PCG, POR, PPG, PFG, QTWO, ROG, SHW, SXI, SCS, SSYS, TER, TKR, UPS, UNM, VECO, VEEV, WRB, WMT, WAT, WERN, WSC, WOLF, IYM, IYZ, IEV, ITB, EWK, EWH, EWM, EWD, EWL, TUR, PJP, PHO. Click this link for details (pattern type, start and end dates).
For a list of small patterns (those a few days wide) click this link.
$ $ $
The following table shows where Fibonacci retrace values of the day's high-low range are plus pivot points, calculated on the Nasdaq composite, sorted by value. When several are near each other (small differences), the area might act as support or resistance.
-- Thomas Bulkowski
![]()
| © 2025 ThePatternSite.com Metric | Value | Diff | Close (within 10% of the high-low range for the day)? |
| Monthly S2 | 16,167.53 | ||
| Monthly S1 | 16,907.99 | 740.46 | |
| Weekly S2 | 16,912.74 | 4.75 | Yes! The Weekly S2 is close to the Monthly S1. |
| Daily S2 | 17,264.44 | 351.71 | |
| Weekly S1 | 17,280.59 | 16.15 | Yes! The Weekly S1 is close to the Daily S2. |
| Low | 17,436.27 | 155.68 | |
| Daily S1 | 17,456.45 | 20.18 | Yes! The Daily S1 is close to the Low. |
| 61.8% Down from Intraday High | 17,575.25 | 118.81 | |
| 50% Down from Intraday High | 17,618.19 | 42.93 | |
| Daily Pivot | 17,628.27 | 10.09 | Yes! The Daily Pivot is close to the 50% Down from Intraday High. |
| Close | 17,648.45 | 20.18 | Yes! The Close is close to the Daily Pivot. |
| 38.2% Down from Intraday High | 17,661.12 | 12.67 | Yes! The 38.2% Down from Intraday High is close to the Close. |
| Open | 17,711.41 | 50.29 | |
| High | 17,800.10 | 88.69 | |
| Daily R1 | 17,820.28 | 20.18 | Yes! The Daily R1 is close to the High. |
| Daily R2 | 17,992.10 | 171.83 | |
| Weekly Pivot | 18,136.45 | 144.34 | |
| Weekly R1 | 18,504.30 | 367.86 | |
| Monthly Pivot | 18,509.05 | 4.75 | Yes! The Monthly Pivot is close to the Weekly R1. |
| Monthly R1 | 19,249.51 | 740.46 | |
| Weekly R2 | 19,360.16 | 110.65 | |
| Monthly R2 | 20,850.57 | 1,490.41 |
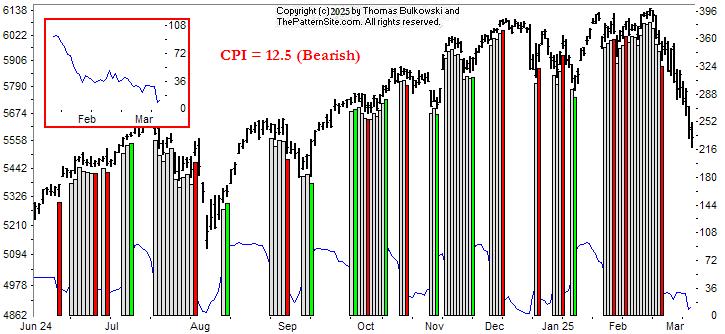
This is a picture of the chart pattern indicator on the daily scale. The indicator is the line chart below a chart of the S&P 500 composite.
As one might have guessed, the CPI is bearish. It turned bearish a few weeks ago. I show that on the chart with a vertical red bar on the far right of the chart.
Because of the market decline, the CPI has remained bearish. It has a reading of 12.5, which is bearish as I said.
The inset in the upper left shows the indicator over the last few months. It's been moving lower. Usually when the indicator nears or hits 0, we see a fast bounce up. You can see that in August and against in September.
This time appears to be different. I'm looking for a continued downtrend in the markets.
$ $ $
Here's a symbol list of 141 chart and candlestick patterns (13 "investment grade" candle patterns) found in today's securities using my version of Patternz: DDD, MMM, ABT, AXDX, ACIW, ALB, AEP, AMGN, AMN, ACGL, ADM, AWI, AVY, AXS, AZTA, BMI, BIIB, BKNG, BRC, CBT, CAL, CE, CVX, CI, CINF, CNO, CNX, CAG, COTY, CCK, D, EBAY, EIX, EG, XOM, EZPW, FICO, FARO, FISV, FDP, GNW, GOOGL, GFF, GES, HBI, HL, HELE, HNI, HOLX, HOV, HUBG, HURC, IEX, IDXX, NSP, IBP, IIIN, IPAR, TILE, JAZZ, JBLU, JNJ, KMB, KSS, LRCX, LLY, RAMP, MTSI, MGY, MRTN, MTDR, MRCY, MOS, NWL, NUS, NTNX, OXY, ORI, ORCL, OR, OXM, POR, PPG, PFG, DGX, RLI, RES, SRE, SHW, LUV, SWX, TER, TXN, TSCO, TG, UIS, UPS, UNM, WRB, WAT, WLK, IYM, IYK, IYE, IYZ, IEV, IXC, SLV, ITB, EWG, EWH, EWJ, EWM, EWS, EZA, EWY, EWP, EWL, PJP, XLE, GLD. Click this link for details (pattern type, start and end dates).
For a list of small patterns (those a few days wide) click this link.
-- Thomas Bulkowski
![]()
$ $ $
If the Nasdaq continues to decline at the same rate as it did today (down 4%), it'll reach single digits (that is, below 10 from the 18,196 it hit Friday) in 185 days or about 6 months. That doesn't account for days it spurts upward and it assumes we trade on the weekends. In trading days, that's about 9 months. Add in the up-days and we can reach it in, oh, maybe 2 years (as a guess, I didn't calculate this). In two years, we have the opportunity to kick out many in congress during the mid-terms. Think about it.
Good news, bad news. First the good news. This is a terrific time to buy. The markets are down. You can buy quality at an affordable price. Stocks will recover. The bad news is it will likely be a better time to buy tomorrow, and the day after that, and ....
$ $ $
I show another slider trading quiz featuring Universal American Financial: UHCO stock.
$ $ $
Here's a symbol list of 75 chart and candlestick patterns (13 "investment grade" candle patterns) found in today's securities using my version of Patternz: DDD, ABT, ADTN, ALK, ALKS, ALGT, AXP, APA, APOG, ATO, BIIB, BKNG, BFH, CNP, CENX, CLX, CNO, CL, CAG, COST, CCK, DFS, DUK, EME, EVRG, EZPW, GNW, GOOGL, HELE, HUBG, IPAR, ISRG, JNJ, LNC, RAMP, NEE, OMCL, ORCL, PAYX, PFG, PG, RL, REGN, RGS, RHI, SBH, SLB, SMG, SIGI, NOW, SGI, SWX, SR, TDOC, TDC, UGI, VFC, VRTX, WRB, WMT, WSO, IEV, IHI, EWH, EWM, EWY, EWL, TUR, PJP, XLB, UNG. Click this link for details (pattern type, start and end dates).
For a list of small patterns (those a few days wide) click this link.
$ $ $
The following table shows where Fibonacci retrace values of the day's high-low range are plus pivot points, calculated on the Dow industrials, sorted by value. When several are near each other (small differences), the area might act as support or resistance.
-- Thomas Bulkowski
![]()
| © 2025 ThePatternSite.com Metric | Value | Diff | Close (within 10% of the high-low range for the day)? |
| Monthly S2 | 40,206.98 | ||
| Weekly S2 | 40,848.88 | 641.90 | |
| Monthly S1 | 41,059.34 | 210.47 | |
| Daily S2 | 41,093.56 | 34.21 | Yes! The Daily S2 is close to the Monthly S1. |
| Weekly S1 | 41,380.29 | 286.73 | |
| Daily S1 | 41,502.63 | 122.34 | |
| Low | 41,612.92 | 110.29 | |
| Close | 41,911.71 | 298.79 | |
| 61.8% Down from Intraday High | 41,967.59 | 55.88 | Yes! The 61.8% Down from Intraday High is close to the Close. |
| Daily Pivot | 42,022.00 | 54.41 | Yes! The Daily Pivot is close to the 61.8% Down from Intraday High. |
| 50% Down from Intraday High | 42,077.14 | 55.14 | Yes! The 50% Down from Intraday High is close to the Daily Pivot. |
| 38.2% Down from Intraday High | 42,186.70 | 109.55 | |
| Daily R1 | 42,431.07 | 244.38 | |
| Open | 42,507.65 | 76.57 | Yes! The Open is close to the Daily R1. |
| High | 42,541.36 | 33.71 | Yes! The High is close to the Open. |
| Weekly Pivot | 42,707.04 | 165.68 | |
| Daily R2 | 42,950.44 | 243.40 | |
| Monthly Pivot | 43,027.99 | 77.55 | Yes! The Monthly Pivot is close to the Daily R2. |
| Weekly R1 | 43,238.45 | 210.46 | |
| Monthly R1 | 43,880.35 | 641.90 | |
| Weekly R2 | 44,565.20 | 684.84 | |
| Monthly R2 | 45,849.00 | 1,283.80 |
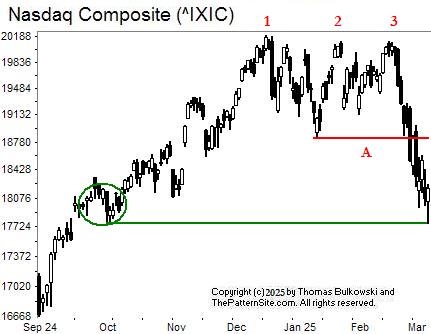
This is the Nasdaq composite on the daily scale.
The three peaks are a chart pattern called a triple top. It confirms as a valid chart pattern when the index closes below red line A. That line connects the lowest valley in the pattern.
As you can see, the composite has continued below line A.
To determine a price target, use the measure rule.
The measure rule isn't a rule at all, but a guideline that indicates how often a security will meet a target. In this case, subtract the height of the pattern, from tallest peak to lowest valley between the two outer peaks, from the red line. The result becomes the target. If the computed value is below 0 or unusually large (like over 20%), then ignore it.
Triple tops in stocks meet the target 49% of the time but if you use half the height, the hit rate climbs to 72%. In this case, the composite hasn't declined far enough to reach the full-height target yet, but it's close.
I drew the green line from today's (Friday's) low to the left and circled what I view as support. The index might turn upward on Monday after bouncing off support today. However, I'm assuming that it'll continue to drop (for the Target at page top).
Why?
Often trends last longer than most people expect. I want to see more evidence of a turn before changing the target.
![]()
The following is a brief review of how the markets performed over time. The numbers refer to the close-to-close move in the Dow industrials.
No options expire this week.
![]()
The following is based on an SFO article in December 2004 by John Seekinger, titled, "Take a two-dimensional approach." He offers these tips.
| Index | S2 | S1 | Pivot | R1 | R2 |
| Dow Industrials (^DJI): Daily | 41,902 | 42,352 | 42,625 | 43,075 | 43,348 |
| Weekly | 41,146 | 41,974 | 43,004 | 43,832 | 44,862 |
| Monthly | 40,504 | 41,653 | 43,325 | 44,474 | 46,146 |
| S&P500 (^GSPC): Daily | 5,623 | 5,697 | 5,740 | 5,813 | 5,857 |
| Weekly | 5,488 | 5,629 | 5,808 | 5,949 | 6,127 |
| Monthly | 5,380 | 5,575 | 5,861 | 6,056 | 6,342 |
| Nasdaq (^IXIC): Daily | 17,594 | 17,895 | 18,069 | 18,370 | 18,544 |
| Weekly | 17,095 | 17,646 | 18,319 | 18,869 | 19,543 |
| Monthly | 16,350 | 17,273 | 18,692 | 19,615 | 21,033 |
Here are the formulas:
![]()
Earnings season is over.
Here's a symbol list of 88 chart and candlestick patterns (13 "investment grade" candle patterns) found in today's securities using my version of Patternz: DDD, ABM, AXDX, ADTN, ALK, AXP, AMN, APH, ANIK, AON, ANET, ADP, AXS, BSET, BIO, BRKR, CACI, COR, CINF, CNO, CSGP, COST, CR, CCK, DFS, EXP, EBAY, ECL, EME, XOM, FIS, GES, HBI, HD, ISRG, JBLU, JNJ, LNC, RAMP, MTSI, MCHX, MTRX, MYGN, NBR, NOC, OMCL, ASGN, ORCL, PATK, PETS, PINC, QCOM, RL, RCKY, SIGI, SGI, RIG, VFC, VLO, VRSN, VRTX, WMT, WEX, WSM, IYM, IYE, IEV, MXI, IHI, EWA, EWO, EWQ, EWG, EWH, EWM, EWL, TUR, PEJ, PJP, XLE, XLB. Click this link for details (pattern type, start and end dates).
For a list of small patterns (those a few days wide) click this link.
The below industries were the best (rank 1) or worst performing of those I follow.
|
-- Thomas Bulkowski
![]()
Here's a symbol list of 54 chart and candlestick patterns (13 "investment grade" candle patterns) found in today's securities using my version of Patternz: A, AEO, AMWD, AXS, BOOT, BMY, BLDR, CALM, CPB, CLS, CHD, CINF, CNA, CNO, CCRN, EME, EFX, EVRG, GMS, HBI, HNI, HUBG, IRM, JNJ, KBH, MHO, MTSI, M, MKTX, MTDR, MTRX, ORCL, PDCO, PEG, RRC, SIGI, TMO, VRTX, V, WAT, WU, WOLF, IEV, IHI, EWO, EWH, EZA, TUR, PJP, XLF. Click this link for details (pattern type, start and end dates).
For a list of small patterns (those a few days wide) click this link.
$ $ $
You can find setups based on a Fibonacci retrace by clicking on the link.
The following patterns were found manually, not using Patternz. Mr. Bulkowski has excluded any securities he owns from appearing in the list. However, he may add any of the securities listed to his portfolio at any time, just as you can.
In the table below, the red and green colors are based on the historical breakout direction for the associated chart pattern. If a high and tight flag appears, the start and end dates highlight the flagpole only and not the flag.
For details about the chart patterns, click here.
-- Thomas Bulkowski, author: Invest for Two-Comma Wealth and the novel (fiction), Foresight (#Ad)
![]()
| Symbol | Chart Pattern | Bullish Bearish | Start | End | Industry |
| ADTN | Double Top, Eve and Adam | 02/14/2025 | 02/27/2025 | Telecom. Equipment | |
| AES | Pipe bottom | 02/10/2025 | 02/18/2025 | Electric Utility (East) | |
| ANIK | Double Top, Adam and Eve | 02/05/2025 | 02/18/2025 | Biotechnology | |
| ANET | Head-and-shoulders top | 01/07/2025 | 02/10/2025 | E-Commerce | |
| BA | Double Top, Adam and Eve | 01/28/2025 | 02/18/2025 | Aerospace/Defense | |
| CBT | Double Top, Eve and Eve | 02/04/2025 | 02/18/2025 | Chemical (Diversified) | |
| CPB | Double Top, Adam and Adam | 02/25/2025 | 03/04/2025 | Food Processing | |
| CINF | Diamond bottom | 02/03/2025 | 02/20/2025 | Insurance (Prop/Casualty) | |
| CLF | Pipe top | 02/10/2025 | 02/18/2025 | Metals and Mining (Div.) | |
| CLX | Double Top, Adam and Adam | 02/25/2025 | 03/04/2025 | Household Products | |
| GLW | Head-and-shoulders top | 01/23/2025 | 02/06/2025 | Telecom. Equipment | |
| CRH | Head-and-shoulders top | 02/06/2025 | 03/03/2025 | Cement and Aggregates | |
| ^DJI | Broadening bottom | 02/24/2025 | 03/03/2025 | None | |
| D | Head-and-shoulders top | 02/13/2025 | 03/04/2025 | Electric Utility (East) | |
| DOV | Pipe top | 01/27/2025 | 02/03/2025 | Machinery | |
| EBAY | Double Top, Adam and Eve | 01/08/2025 | 02/26/2025 | Internet | |
| FDS | Double Top, Eve and Adam | 02/19/2025 | 03/03/2025 | Information Services | |
| FAST | Broadening top | 02/14/2025 | 03/05/2025 | Retail Building Supply | |
| FISV | Double Top, Eve and Adam | 02/20/2025 | 03/03/2025 | IT Services | |
| FTNT | Head-and-shoulders top | 02/10/2025 | 02/27/2025 | Computer Software and Svcs | |
| GAP | Double Top, Adam and Eve | 02/18/2025 | 02/27/2025 | Apparel | |
| GPRO | Horn top | 01/21/2025 | 02/03/2025 | Electronics | |
| DHI | Double Bottom, Eve and Eve | 02/19/2025 | 03/04/2025 | Homebuilding | |
| HWM | Double Top, Eve and Adam | 02/19/2025 | 03/03/2025 | Aerospace/Defense | |
| HUN | Broadening bottom | 01/10/2025 | 03/04/2025 | Chemical (Specialty) | |
| IIIN | Pipe top | 02/10/2025 | 02/18/2025 | Building Materials | |
| KBH | Double Bottom, Adam and Eve | 02/24/2025 | 03/04/2025 | Homebuilding | |
| LZB | Double Top, Adam and Adam | 01/30/2025 | 02/19/2025 | Furn/Home Furnishings | |
| LDOS | Double Bottom, Adam and Adam | 02/21/2025 | 02/28/2025 | IT Services | |
| LEN | Triple bottom | 02/19/2025 | 03/04/2025 | Homebuilding | |
| LNC | Double Top, Eve and Adam | 02/14/2025 | 03/03/2025 | Insurance (Life) | |
| LMT | Pipe bottom | 02/10/2025 | 02/18/2025 | Aerospace/Defense | |
| LPLA | Head-and-shoulders top | 02/07/2025 | 03/03/2025 | Securities Brokerage | |
| MRK | Pipe bottom | 02/10/2025 | 02/18/2025 | Drug | |
| MLKN | Head-and-shoulders top | 01/02/2025 | 02/14/2025 | Furn/Home Furnishings | |
| MYGN | Double Top, Eve and Eve | 01/10/2025 | 02/19/2025 | Biotechnology | |
| NTGR | Double Top, Adam and Eve | 12/18/2024 | 02/11/2025 | Telecom. Equipment | |
| NTAP | Triple top | 01/22/2025 | 02/26/2025 | Computers and Peripherals | |
| NJR | Head-and-shoulders bottom | 12/18/2024 | 01/31/2025 | Natural Gas (Distributor) | |
| OXY | Double Top, Adam and Eve | 01/13/2025 | 02/20/2025 | Petroleum (Producing) | |
| ASGN | Double Top, Eve and Eve | 11/27/2024 | 01/28/2025 | Human Resources | |
| ORCL | Double Top, Eve and Eve | 02/10/2025 | 02/18/2025 | Computer Software and Svcs | |
| PHM | Triple bottom | 02/19/2025 | 03/04/2025 | Homebuilding | |
| QTWO | Double Top, Adam and Adam | 01/30/2025 | 02/13/2025 | E-Commerce | |
| QCOM | Triple top | 01/24/2025 | 02/19/2025 | Telecom. Equipment | |
| RL | Double Top, Adam and Eve | 02/06/2025 | 02/20/2025 | Apparel | |
| RJF | Double Top, Adam and Eve | 11/29/2024 | 01/29/2025 | Securities Brokerage | |
| RTX | Ugly double bottom | 01/06/2025 | 02/14/2025 | Aerospace/Defense | |
| RGS | Triple top | 12/24/2024 | 02/11/2025 | Toiletries/Cosmetics | |
| R | Head-and-shoulders top | 01/23/2025 | 03/03/2025 | Trucking/Transp. Leasing | |
| SRE | Double Top, Adam and Adam | 01/21/2025 | 02/24/2025 | Electric Utility (West) | |
| SCCO | Triple top | 01/17/2025 | 02/14/2025 | Metals and Mining (Div.) | |
| SCS | Pipe bottom | 01/06/2025 | 01/13/2025 | Furn/Home Furnishings | |
| TPR | Head-and-shoulders top | 02/06/2025 | 02/26/2025 | Apparel | |
| TGT | Double Top, Eve and Adam | 01/10/2025 | 01/28/2025 | Retail Store | |
| TDOC | Double Top, Adam and Adam | 02/10/2025 | 02/14/2025 | Healthcare Information | |
| TDY | Double Bottom, Adam and Adam | 02/14/2025 | 02/24/2025 | Aerospace/Defense | |
| WWD | Head-and-shoulders top | 01/22/2025 | 03/03/2025 | Precision Instrument |
![]()
$ $ $

I show a picture of the Nasdaq composite on the 5-minute scale.
I drew a down-sloping trendline, shown in red, along the price peaks over the 10-days the chart covers.
The index peaked above the line today (Wednesday), about midday.
I also drew a horizontal green line which is important to the 12 pattern. Pattern 12 is an ugly double bottom. It's supposed to confirm as a valid pattern once the index closes above the green line. However, on this scale, with this chart, I can't tell if it did or not.
If it confirms, it suggests the market will recover. If unconfirmed, then the markets might still be nervous and subject to drop again.
$ $ $
I released a new version of Patternz. Mostly it's bug fixed but I added some small chart patterns.
$ $ $
Here's a symbol list of 115 chart and candlestick patterns (13 "investment grade" candle patterns) found in today's securities using my version of Patternz: ANF, AEE, AEP, AMGN, APOG, AWI, ASH, ATO, ADP, BCPC, BMRN, BKH, BSX, CAL, CE, COR, CDAY, CHD, CSCO, CLX, CNA, CAG, COST, CROX, FANG, DUK, EMN, EFX, EQT, EVRG, EXC, FCX, GAP, THG, HNI, HUBG, IDA, ISRG, JNJ, LHX, LZB, LAMR, LEG, LDOS, LLY, LPLA, M, MTRX, NWL, NEU, NI, NUS, OUT, PETS, PNW, POR, PPL, QTWO, RGS, ROP, SAND, SLB, SIGI, STR, TRGP, TXT, TJX, TDG, TG, VLO, VRSN, VRTX, WAT, XEL, IYM, IYE, IHE, IYH, IAT, IEV, IXC, MXI, ILF, IGE, IEO, ITB, EWO, EWK, EWC, EWQ, EWG, EWH, EWI, EWS, EZA, EWP, EWD, TUR, EWU, PJP, XLE, XLF, XLU, UNG, USO, VHT, VAW. Click this link for details (pattern type, start and end dates).
For a list of small patterns (those a few days wide) click this link.
$ $ $
The following table shows where Fibonacci retrace values of the day's high-low range are plus pivot points, calculated on the Nasdaq composite, sorted by value. When several are near each other (small differences), the area might act as support or resistance.
-- Thomas Bulkowski
![]()
| © 2025 ThePatternSite.com Metric | Value | Diff | Close (within 10% of the high-low range for the day)? |
| Monthly S2 | 17,269.16 | ||
| Weekly S2 | 17,585.41 | 316.25 | |
| Monthly S1 | 17,910.94 | 325.53 | |
| Daily S2 | 17,974.24 | 63.29 | |
| Weekly S1 | 18,069.07 | 94.83 | |
| Low | 18,144.73 | 75.66 | |
| Daily S1 | 18,263.48 | 118.75 | |
| Open | 18,312.97 | 49.49 | |
| 61.8% Down from Intraday High | 18,320.35 | 7.38 | Yes! The 61.8% Down from Intraday High is close to the Open. |
| 50% Down from Intraday High | 18,374.60 | 54.25 | |
| 38.2% Down from Intraday High | 18,428.85 | 54.25 | |
| Daily Pivot | 18,433.98 | 5.13 | Yes! The Daily Pivot is close to the 38.2% Down from Intraday High. |
| Close | 18,552.73 | 118.75 | |
| High | 18,604.47 | 51.74 | |
| Daily R1 | 18,723.22 | 118.75 | |
| Weekly Pivot | 18,856.65 | 133.43 | |
| Daily R2 | 18,893.72 | 37.07 | Yes! The Daily R2 is close to the Weekly Pivot. |
| Monthly Pivot | 19,014.78 | 121.06 | |
| Weekly R1 | 19,340.31 | 325.53 | |
| Monthly R1 | 19,656.56 | 316.25 | |
| Weekly R2 | 20,127.89 | 471.33 | |
| Monthly R2 | 20,760.40 | 632.51 |
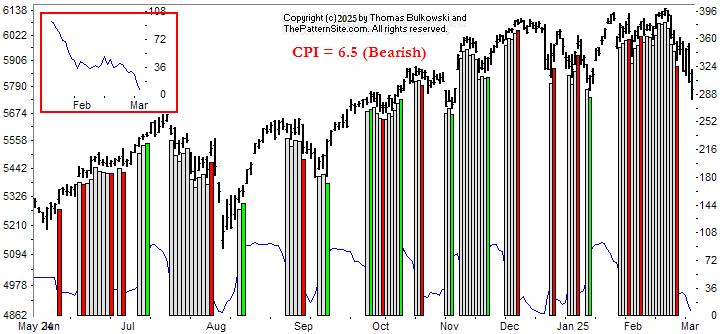
This is a picture of the chart pattern indicator on the daily scale. The indicator is the line chart below a chart of the S&P 500 composite.
The CPI turned bearish as the red bar on the far right of the chart shows. It's been cycling between neutral and bearish for a while now, but it started dropping when Trump took over.
I'm not kidding.
The inset shows the last trading day, Friday, January 17, before Trump was inaugurated. Since then, the CPI has dropped. Today, it hit 6.5 where 0 is the lowest it can go.
$ $ $
Here's a symbol list of 227 chart and candlestick patterns (13 "investment grade" candle patterns) found in today's securities using my version of Patternz: DDD, ABT, AXDX, AES, APD, AKAM, ALK, ALB, ALGT, ALL, AEE, AEO, AEP, AXP, AME, AMN, APH, AR, ARW, ASH, ATO, ADP, AVY, BZH, BBY, BIO, BIIB, BKH, BA, BOOT, BCO, BMY, BG, COR, CNP, CDAY, CF, CRL, CVX, CHD, CTAS, CSCO, CLF, CLX, CNA, CAG, GLW, CR, CRH, CMI, FANG, DDS, DFS, ^DJU, D, DOV, DTE, DUK, EXP, EME, EVRG, EXC, XOM, EZPW, FDX, FLS, GILD, GPN, HBI, THG, HE, HSII, HNI, HWM, HUBG, IDA, IIIN, IBKR, IPG, IPI, JAZZ, JBLU, JNJ, KEYS, KMB, LZB, LEG, LNC, LMT, LPLA, LXU, MTSI, M, MGY, MCHX, MTDR, MTRN, MTRX, MRK, META, MS, NOV, NFLX, NEU, NI, OXY, OMCL, ORCL, OMI, PKG, PATK, PTEN, PCTY, PYPL, PETS, PNW, POR, PPL, PG, QTWO, RJF, RGS, RGA, ROK, ROST, SEIC, SIGI, SCI, SHW, SHOP, SLGN, STR, SKYW, LUV, SCS, SSYS, TPR, TRGP, TGT, TDOC, TKR, TRV, TG, TREX, VFC, VLO, VRSN, VRTX, VC, WRB, WU, WPM, WSC, WWD, XEL, ZBRA, IYM, IAI, IYK, IYE, IDU, ICF, IYH, IAT, IXC, IGE, IEO, ITB, EWA, EWK, ECH, EWQ, EWH, EIS, EWM, EZA, EWT, TUR, DBA, PBE, PEJ, PJP, XLP, XLE, GLD, XLV, XLI, XLB, XLU, VIS, VAW. Click this link for details (pattern type, start and end dates).
For a list of small patterns (those a few days wide) click this link.
-- Thomas Bulkowski
![]()
$ $ $
I show another slider trading quiz featuring UNUM Provident: UNUM stock.
$ $ $
Here's a symbol list of 328 chart and candlestick patterns (13 "investment grade" candle patterns) found in today's securities using my version of Patternz: DDD, ANF, AMD, AES, APD, ALK, ALB, AA, AMZN, AEP, AXP, AME, AMGN, APH, ANIK, APA, APOG, AMAT, ACGL, ADM, ANET, ARW, AVY, AVNT, BZH, BKH, BA, BOOT, BAH, BSX, BFH, BCO, BMY, BG, CBT, CDNS, CAL, CE, CLS, CDAY, CF, CRL, CVX, CSCO, CLNE, CLF, CGNX, CMCO, ED, COP, GLW, CR, CRH, CROX, CTS, CMI, CW, DHR, DECK, DVN, FANG, DDS, DFS, ^DJT, ^DJI, DOV, EXP, EMN, EBAY, EME, EMR, EOG, EVRG, EXC, XOM, EZPW, FFIV, FARO, FAST, FDX, FLEX, FLS, FORM, FTNT, FCX, IT, GIS, GNW, GPN, GFS, GMS, GS, GOOGL, GGG, GFF, HQY, HSII, HELE, HP, HSIC, HNI, HD, DHI, HOV, HWM, HUBG, JBHT, HUN, ITW, IIIN, INTC, IBKR, IPG, IPI, JAZZ, JNJ, KMT, KEYS, KLAC, KSS, KLIC, LZB, LAMR, LEG, LNC, LMT, LOW, LPLA, LXU, MTSI, M, MGY, MANH, MCHX, MRTN, MAS, MTDR, MTRN, MTRX, MRK, META, MGEE, MU, MSFT, MLKN, MS, MUR, NBR, ^IXIC, NOV, NFLX, NTGR, NTAP, NWL, NEU, NKE, NUS, OXY, ORI, OLN, OMC, ORCL, PKG, PANW, PATK, PTEN, PYPL, PETS, PLXS, PSTG, QTWO, QCOM, RL, RMBS, RJF, RGS, RGA, RHI, ROK, ROST, RES, R, ^GSPC, SAIA, CRM, SBH, SLB, SCHW, SAIC, SMG, SEE, SEIC, SCI, NOW, SHW, SHOP, STR, SKX, SKYW, SCCO, SPSC, SSYS, TGT, TDOC, TDC, TER, TMO, TKR, TOL, TSCO, TDG, TREX, TWLO, VLO, VMI, VECO, VEEV, VRTX, WAT, WERN, WU, WLK, WPM, WSC, WWW, WWD, WDAY, ZBRA, IYM, IYC, IYE, IEZ, DDM, FTEC, FDN, QTEC, FXL, BOTZ, QQQ, IYH, IAT, IGV, IXC, MXI, IXN, SOXX, IGE, IEO, ITB, EWO, EWK, EWC, EEM, EWI, EWM, EPP, EWY, EWL, EWT, TUR, EWU, QLD, IBB, DBA, PBE, PEJ, PXJ, PJP, PHO, SSO, ROBO, XLY, XLE, XLV, XHB, XLI, XLB, XRT, SPY, XLK, USO, SMH, VHT, VIS, VAW, MGK, VONG. Click this link for details (pattern type, start and end dates).
For a list of small patterns (those a few days wide) click this link.
$ $ $
The following table shows where Fibonacci retrace values of the day's high-low range are plus pivot points, calculated on the Dow industrials, sorted by value. When several are near each other (small differences), the area might act as support or resistance.
-- Thomas Bulkowski
![]()
| © 2025 ThePatternSite.com Metric | Value | Diff | Close (within 10% of the high-low range for the day)? |
| Monthly S2 | 41,828.67 | ||
| Daily S2 | 42,266.97 | 438.30 | |
| Monthly S1 | 42,509.95 | 242.98 | |
| Weekly S2 | 42,608.78 | 98.83 | Yes! The Weekly S2 is close to the Monthly S1. |
| Daily S1 | 42,729.11 | 120.32 | |
| Weekly S1 | 42,900.01 | 170.91 | |
| Low | 42,919.31 | 19.30 | Yes! The Low is close to the Weekly S1. |
| Close | 43,191.24 | 271.93 | |
| 61.8% Down from Intraday High | 43,345.04 | 153.80 | |
| Daily Pivot | 43,381.44 | 36.40 | Yes! The Daily Pivot is close to the 61.8% Down from Intraday High. |
| Weekly Pivot | 43,392.10 | 10.66 | Yes! The Weekly Pivot is close to the Daily Pivot. |
| 50% Down from Intraday High | 43,476.55 | 84.45 | Yes! The 50% Down from Intraday High is close to the Weekly Pivot. |
| 38.2% Down from Intraday High | 43,608.05 | 131.50 | |
| Weekly R1 | 43,683.33 | 75.28 | Yes! The Weekly R1 is close to the 38.2% Down from Intraday High. |
| Monthly Pivot | 43,782.16 | 98.83 | Yes! The Monthly Pivot is close to the Weekly R1. |
| Daily R1 | 43,843.58 | 61.42 | Yes! The Daily R1 is close to the Monthly Pivot. |
| Open | 43,900.49 | 56.91 | Yes! The Open is close to the Daily R1. |
| High | 44,033.78 | 133.29 | |
| Weekly R2 | 44,175.42 | 141.64 | |
| Monthly R1 | 44,463.45 | 288.02 | |
| Daily R2 | 44,495.91 | 32.47 | Yes! The Daily R2 is close to the Monthly R1. |
| Monthly R2 | 45,735.65 | 1,239.73 |
Here's the updated 2025 market forecast, presented in slider format.
![]()
The following is a brief review of how the markets performed over time. The numbers refer to the close-to-close move in the Dow industrials.
No options expire this week.
![]()
The following is based on an SFO article in December 2004 by John Seekinger, titled, "Take a two-dimensional approach." He offers these tips.
| Index | S2 | S1 | Pivot | R1 | R2 |
| Dow Industrials (^DJI): Daily | 42,832 | 43,337 | 43,605 | 44,109 | 44,378 |
| Weekly | 42,825 | 43,333 | 43,609 | 44,116 | 44,392 |
| Monthly | 42,045 | 42,943 | 43,999 | 44,897 | 45,952 |
| S&P500 (^GSPC): Daily | 5,795 | 5,875 | 5,917 | 5,997 | 6,039 |
| Weekly | 5,739 | 5,847 | 5,945 | 6,053 | 6,151 |
| Monthly | 5,670 | 5,812 | 5,980 | 6,122 | 6,290 |
| Nasdaq (^IXIC): Daily | 18,206 | 18,526 | 18,694 | 19,015 | 19,182 |
| Weekly | 17,684 | 18,265 | 18,955 | 19,537 | 20,226 |
| Monthly | 17,367 | 18,107 | 19,113 | 19,853 | 20,859 |
Here are the formulas:
![]()
Earnings season is either underway or should be starting soon. The sessions could be more volatile.
Here's a symbol list of 130 chart and candlestick patterns (13 "investment grade" candle patterns) found in today's securities using my version of Patternz: AXDX, AYI, AEIS, AES, A, AA, AEP, AMWD, ANIK, AR, ASH, AGO, BZH, BKH, BAH, BMY, BBW, CRL, CINF, CLF, CTSH, CSGP, CR, CROX, DHR, DDS, DOV, ECL, EOG, EPAM, EFX, EQT, EZPW, FICO, FIS, FIVN, GAP, GNW, GES, HL, HSIC, HWM, IIIN, JNJ, KEYS, LLY, LNC, LMT, MTSI, M, MAN, MRTN, MRK, MLKN, MCO, MOS, NFLX, NEU, OXY, ORI, OMCL, ORCL, PDCO, PTEN, PCTY, RCKY, SAIC, SIGI, SHOP, SCCO, LUV, TRGP, TDOC, TFX, TDG, VMI, MDRX, VRSN, VRTX, VMC, WSC, WWD, XEL, ITA, IEZ, BOTZ, IHF, ILF, IGE, IEO, EWA, EWZ, EEM, EWQ, EWG, EWI, EWM, EWW, EPP, EZA, EWY, EWP, THD, PPA, DBA, PBE, PEJ, PXJ, PJP, ROBO, GLD, XLV, XAR. Click this link for details (pattern type, start and end dates).
For a list of small patterns (those a few days wide) click this link.
The below industries were the best (rank 1) or worst performing of those I follow.
|
-- Thomas Bulkowski
![]()
Support this site! Clicking any of the books (below) takes you to
Amazon.com If you buy ANYTHING while there, they pay for the referral.
Legal notice for paid links: "As an Amazon Associate I earn from qualifying purchases."
|
My Stock Market Books
|
My Novels
Orb Foresight Rewrite Coming!
|