
As of 04/17/2026
Indus: 49,447 +868.71 +1.8%
Trans: 22,422 +609.39 +2.8%
Utils: 1,158 -6.73 -0.6%
Nasdaq: 24,468 +365.78 +1.5%
S&P 500: 7,126 +84.78 +1.2%
|
YTD
+2.9%
+29.2%
+8.4%
+5.3%
+4.1%
|
|
As of 04/17/2026
Indus: 49,447 +868.71 +1.8%
Trans: 22,422 +609.39 +2.8%
Utils: 1,158 -6.73 -0.6%
Nasdaq: 24,468 +365.78 +1.5%
S&P 500: 7,126 +84.78 +1.2%
|
YTD
+2.9%
+29.2%
+8.4%
+5.3%
+4.1%
| |
|
| ||
Here's a symbol list of 159 chart and candlestick patterns (13 "investment grade" candle patterns) found in today's securities using my version of Patternz: DDD, ANF, AYI, AEIS, AES, A, AKAM, ALK, AA, DOX, AMWD, AME, APH, ANIK, AR, AMAT, ANET, ADSK, BECN, BZH, BOOT, BMY, BBW, CACI, CDNS, CPB, COR, CRL, CHKP, CTAS, CSCO, CLF, CNA, CNO, CSGP, CROX, DECK, DDS, EBAY, ECL, EPAM, EQT, EZPW, FFIV, FLEX, FLS, FORM, FTNT, FWRD, FDP, GME, GAP, GNW, GILD, GES, HL, HSIC, INFN, NSP, IIIN, INTC, IBKR, ISRG, IRM, JBLU, JNJ, KEYS, KFRC, KLAC, LAMR, LANC, LEG, LNC, LMT, LXU, MTSI, M, MAN, MKTX, MRK, MRCY, META, MU, MSFT, MLKN, MS, NFLX, NVDA, ORI, OLN, OMCL, ORCL, OR, PKG, PANW, PDCO, PTEN, PSTG, QTWO, QCOM, RL, RRC, RCKY, R, CRM, SIGI, SMTC, NOW, SHOP, SKYW, SWX, SRDX, SNPS, TRGP, TDOC, TFX, TER, UNM, VFC, VRTX, WMB, WSC, IAI, IDU, FTEC, FDN, QTEC, FXL, BOTZ, IYZ, IGV, IXN, ILF, SOXX, SLV, EWA, EWI, EWM, EWW, EPP, EWS, TUR, PEJ, PJP, XLK, SMH. Click this link for details (pattern type, start and end dates).
For a list of small patterns (those a few days wide) click this link.
$ $ $
You can find setups based on a Fibonacci retrace by clicking on the link.
The following patterns were found manually, not using Patternz. Mr. Bulkowski has excluded any securities he owns from appearing in the list. However, he may add any of the securities listed to his portfolio at any time, just as you can.
In the table below, the red and green colors are based on the historical breakout direction for the associated chart pattern. If a high and tight flag appears, the start and end dates highlight the flagpole only and not the flag.
For details about the chart patterns, click here.
-- Thomas Bulkowski, author: Invest for Two-Comma Wealth and the novel (fiction), Foresight (#Ad)
![]()
| Symbol | Chart Pattern | Bullish Bearish | Start | End | Industry |
| DDD | Double Top, Eve and Eve | 02/05/2025 | 02/14/2025 | Electronics | |
| ACIW | Triple top | 01/17/2025 | 02/06/2025 | IT Services | |
| AFL | Triple bottom | 02/06/2025 | 02/21/2025 | Insurance (Diversified) | |
| AKAM | Dead-cat bounce | 02/21/2025 | 02/21/2025 | E-Commerce | |
| AR | Double Top, Eve and Eve | 01/23/2025 | 02/19/2025 | Natural Gas (Diversified) | |
| AWI | Broadening top | 01/21/2025 | 02/25/2025 | Building Materials | |
| BMI | Triple top | 01/31/2025 | 02/19/2025 | Precision Instrument | |
| BALL | Double Bottom, Adam and Adam | 02/13/2025 | 02/19/2025 | Packaging and Container | |
| BECN | Head-and-shoulders top | 01/27/2025 | 02/21/2025 | Retail Building Supply | |
| BKH | Triangle, ascending | 01/21/2025 | 02/27/2025 | Electric Utility (West) | |
| BCO | Triple bottom | 02/03/2025 | 02/21/2025 | Industrial Services | |
| BMY | Pipe bottom | 02/10/2025 | 02/18/2025 | Drug | |
| CX | Triple top | 02/07/2025 | 02/21/2025 | Cement and Aggregates | |
| CIEN | Diamond top | 12/16/2024 | 02/18/2025 | Telecom. Equipment | |
| CLNE | Dead-cat bounce | 02/25/2025 | 02/25/2025 | Natural Gas (Distributor) | |
| CMTL | Double Top, Adam and Adam | 02/07/2025 | 02/19/2025 | Telecom. Equipment | |
| ED | Ugly double bottom | 01/13/2025 | 02/12/2025 | Electric Utility (East) | |
| CR | Double Top, Eve and Eve | 02/05/2025 | 02/19/2025 | Diversified Co. | |
| CW | Triple top | 11/11/2024 | 01/22/2025 | Machinery | |
| XRAY | Double Top, Eve and Adam | 12/16/2024 | 01/30/2025 | Medical Supplies | |
| DDS | Pipe top | 02/10/2025 | 02/18/2025 | Retail Store | |
| ^DJT | Double Top, Eve and Adam | 01/27/2025 | 02/18/2025 | None | |
| DUK | Ugly double bottom | 01/13/2025 | 02/18/2025 | Electric Utility (East) | |
| EMN | Double Top, Eve and Adam | 02/04/2025 | 02/18/2025 | Chemical (Diversified) | |
| EIX | Triangle, symmetrical | 02/05/2025 | 02/26/2025 | Electric Utility (West) | |
| ELV | Triple bottom | 02/12/2025 | 02/21/2025 | Medical Services | |
| EMR | Double Top, Eve and Adam | 01/23/2025 | 01/30/2025 | Computers and Peripherals | |
| EVH | Broadening bottom | 01/16/2025 | 02/21/2025 | Healthcare Information | |
| FLEX | Double Top, Adam and Adam | 01/22/2025 | 02/07/2025 | Electronics | |
| HIG | Head-and-shoulders bottom | 12/20/2024 | 01/31/2025 | Insurance (Prop/Casualty) | |
| HSII | Horn top | 11/11/2024 | 11/25/2024 | Human Resources | |
| HOV | Three Falling Peaks | 01/17/2025 | 02/14/2025 | Homebuilding | |
| HUN | Double Bottom, Adam and Adam | 01/10/2025 | 02/03/2025 | Chemical (Specialty) | |
| IDA | Head-and-shoulders bottom | 12/23/2024 | 01/23/2025 | Electric Utility (West) | |
| PODD | Double Top, Eve and Eve | 02/07/2025 | 02/19/2025 | Medical Supplies | |
| ITGR | Double Top, Eve and Adam | 01/30/2025 | 02/20/2025 | Electronics | |
| IBKR | Double Top, Adam and Eve | 02/06/2025 | 02/14/2025 | Securities Brokerage | |
| ISRG | Double Top, Adam and Eve | 01/23/2025 | 02/19/2025 | Medical Supplies | |
| KBH | Triangle, symmetrical | 01/14/2025 | 01/31/2025 | Homebuilding | |
| KEYS | Pipe top | 02/10/2025 | 02/18/2025 | Precision Instrument | |
| LEG | Horn top | 01/27/2025 | 02/10/2025 | Furn/Home Furnishings | |
| M | Double Top, Eve and Adam | 01/31/2025 | 02/21/2025 | Retail Store | |
| MTRN | Triple top | 01/21/2025 | 02/19/2025 | Metals and Mining (Div.) | |
| MGEE | Double Bottom, Adam and Adam | 01/27/2025 | 02/03/2025 | Electric Utility (Central) | |
| MYGN | Dead-cat bounce | 02/25/2025 | 02/25/2025 | Biotechnology | |
| ^IXIC | Triple top | 12/16/2024 | 02/18/2025 | None | |
| NFLX | Pipe top | 02/10/2025 | 02/18/2025 | Internet | |
| NWPX | Double Top, Eve and Adam | 02/07/2025 | 02/18/2025 | Building Materials | |
| NTNX | Broadening top | 02/05/2025 | 02/19/2025 | E-Commerce | |
| ORI | Ugly double bottom | 01/13/2025 | 02/03/2025 | Insurance (Prop/Casualty) | |
| PTEN | Pipe top | 02/10/2025 | 02/18/2025 | Oilfield Svcs/Equipment | |
| QTWO | Horn top | 01/27/2025 | 02/10/2025 | E-Commerce | |
| RMBS | Double Top, Eve and Adam | 02/06/2025 | 02/19/2025 | Semiconductor Cap Equip. | |
| RRC | Double Top, Adam and Adam | 01/16/2025 | 01/22/2025 | Petroleum (Producing) | |
| ^GSPC | Triple top | 01/24/2025 | 02/19/2025 | None | |
| CRM | Double Top, Eve and Adam | 12/04/2024 | 01/28/2025 | E-Commerce | |
| SRE | Dead-cat bounce | 02/25/2025 | 02/25/2025 | Electric Utility (West) | |
| SHOP | Pipe top | 02/10/2025 | 02/18/2025 | E-Commerce | |
| TDOC | Pipe top | 02/10/2025 | 02/18/2025 | Healthcare Information | |
| TFX | Dead-cat bounce | 02/27/2025 | 02/27/2025 | Diversified Co. | |
| TZOO | Dead-cat bounce | 02/25/2025 | 02/25/2025 | Internet | |
| WSM | Double Top, Adam and Adam | 01/30/2025 | 02/18/2025 | Retail (Special Lines) | |
| WSC | Double Top, Eve and Eve | 01/22/2025 | 02/20/2025 | Industrial Services | |
| WWW | Double Top, Adam and Adam | 12/11/2024 | 01/30/2025 | Shoe | |
| MGK | Triple top | 12/16/2024 | 02/18/2025 | None |
![]()
$ $ $
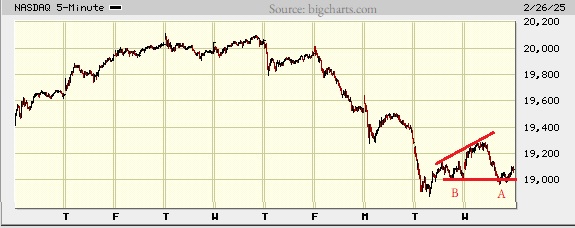
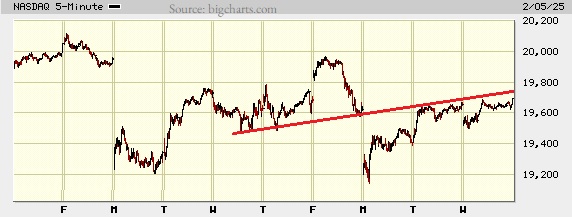
I show a picture of the Nasdaq composite on the 5-minute scale.
At A and B, we see small double bottoms that confirmed as valid chart patterns. The rise after B meets the measure rule target, which is the height of the pattern added to the price of the top of the pattern.
The two red lines highlight a chart pattern called a broadening formation, right-angled and ascending. It's not ideal because of the white space in the middle of the pattern (between A and B). The breakout from this pattern is upward 55% of the time, so that's close to random. And that's in a bull market (which we are in).
The pattern suggests a move higher in the index.
$ $ $
Here's a symbol list of 99 chart and candlestick patterns (13 "investment grade" candle patterns) found in today's securities using my version of Patternz: AXDX, AES, ATSG, AKAM, AA, DOX, ANIK, BSET, BMRN, BKH, BOOT, BMY, BBW, CE, CRL, CHKP, CVX, CINF, CLNE, CLF, COP, CSGP, XRAY, FANG, DDS, ^DJI, EMN, EBAY, XOM, EZPW, FICO, GNW, GOOGL, HSIC, HOV, HUN, IIIN, INTU, JNJ, KEYS, KSS, LAMR, LANC, LEG, LNC, LMT, MTSI, MKTX, MRK, MLI, NFLX, NJR, NI, JWN, OGE, OXM, PTEN, SBH, SHOP, SPSC, TGT, TDOC, TER, TTD, TMO, TZOO, TWLO, UHAL, VRTX, XEL, IYM, IYK, IDU, DDM, QTEC, FXI, SOXX, IEO, EWO, EWK, EWH, EWI, EWW, THD, PBE, PXJ, PJP, SMH, VHT. Click this link for details (pattern type, start and end dates).
For a list of small patterns (those a few days wide) click this link.
$ $ $
The following table shows where Fibonacci retrace values of the day's high-low range are plus pivot points, calculated on the Nasdaq composite, sorted by value. When several are near each other (small differences), the area might act as support or resistance.
-- Thomas Bulkowski
![]()
| © 2025 ThePatternSite.com Metric | Value | Diff | Close (within 10% of the high-low range for the day)? |
| Monthly S2 | 18,467.55 | ||
| Monthly S1 | 18,771.40 | 303.86 | |
| Daily S2 | 18,789.67 | 18.27 | Yes! The Daily S2 is close to the Monthly S1. |
| Daily S1 | 18,932.47 | 142.79 | |
| Weekly S2 | 18,966.23 | 33.76 | |
| Low | 18,966.45 | 0.22 | Yes! The Low is close to the Weekly S2. |
| Weekly S1 | 19,020.74 | 54.29 | |
| Close | 19,075.26 | 54.52 | |
| 61.8% Down from Intraday High | 19,088.53 | 13.27 | Yes! The 61.8% Down from Intraday High is close to the Close. |
| Daily Pivot | 19,109.24 | 20.72 | Yes! The Daily Pivot is close to the 61.8% Down from Intraday High. |
| Open | 19,109.32 | 0.08 | Yes! The Open is close to the Daily Pivot. |
| 50% Down from Intraday High | 19,126.23 | 16.91 | Yes! The 50% Down from Intraday High is close to the Open. |
| 38.2% Down from Intraday High | 19,163.94 | 37.71 | |
| Daily R1 | 19,252.04 | 88.09 | |
| High | 19,286.02 | 33.98 | |
| Daily R2 | 19,428.81 | 142.79 | |
| Monthly Pivot | 19,445.01 | 16.19 | Yes! The Monthly Pivot is close to the Daily R2. |
| Weekly Pivot | 19,565.43 | 120.42 | |
| Weekly R1 | 19,619.94 | 54.52 | |
| Monthly R1 | 19,748.86 | 128.92 | |
| Weekly R2 | 20,164.63 | 415.76 | |
| Monthly R2 | 20,422.47 | 257.84 |
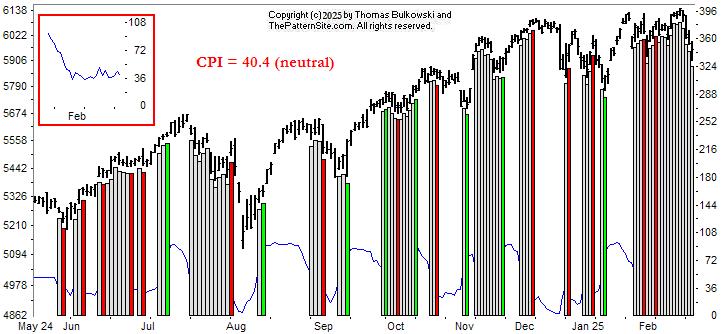
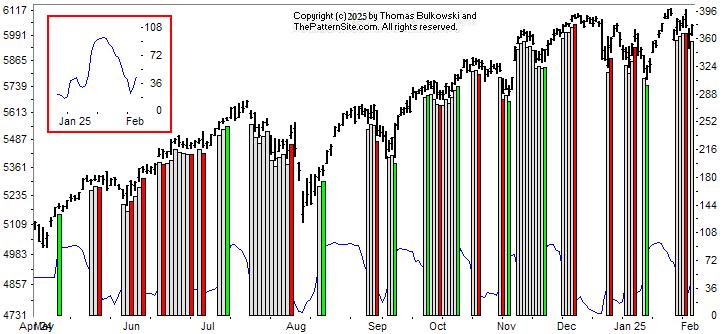
This is a picture of the chart pattern indicator on the daily scale. The indicator is the line chart below a chart of the S&P 500 composite.
The white vertical bars on the far right of the chart means the indicator value is neutral.
That may seem odd given that the major indices have been dropping for the last several days. I think that suggests underlying strength.
The red inset (box) in the upper left shows the CPI has flat lined.
With the CPI in neutral, I don't know which way the indicator will go. My guess is that the markets will rise.
$ $ $
Here's a symbol list of 139 chart and candlestick patterns (13 "investment grade" candle patterns) found in today's securities using my version of Patternz: DDD, AES, APD, AA, AEO, AEP, AIG, AME, APH, ANIK, APA, ANET, ADP, AVA, AXS, AZTA, BSET, BIIB, BKH, BRC, BMY, BR, CRL, CVX, CTAS, CSCO, CLNE, CLF, COP, CSGP, CR, XRAY, FANG, DDS, DSGR, BOOM, ECL, EME, XOM, EZPW, FLEX, GAP, GMS, GOOGL, HBI, HQY, HELE, HSIC, HSY, IIIN, INTC, TILE, INTU, JNJ, KMT, KEYS, KSS, LNC, LMT, L, MHO, MTSI, MGY, MRK, MOS, MYGN, NBR, ^IXIC, NFLX, NTGR, NWL, NEU, NOVT, ORI, OTEX, OR, OXM, PKE, PATK, PDCO, PTEN, PYPL, PFE, PPG, PEG, PSTG, KWR, REGN, RGS, ROP, RES, SRE, SHOP, SLGN, TRGP, TECH, TDOC, TEVA, TZOO, TG, VLO, MDRX, VRTX, WU, XEL, IYK, IHE, FXI, QQQ, IEV, ITB, EWO, EWK, EEM, EWI, EWW, EWP, EWL, THD, TUR, QLD, PPA, PEJ, PXJ, PJP, XLY, XLV, XLU, VHT, VIS, MGK. Click this link for details (pattern type, start and end dates).
For a list of small patterns (those a few days wide) click this link.
-- Thomas Bulkowski
![]()
$ $ $
I show another slider trading quiz featuring United Parcel Service: UPS stock.
$ $ $
Here's a symbol list of 130 chart and candlestick patterns (13 "investment grade" candle patterns) found in today's securities using my version of Patternz: ABT, ACN, AKAM, ALRM, ALB, AEP, AMWD, APH, ANIK, AAPL, AMAT, ANET, AGO, AVNT, AVA, BECN, BZH, BBY, CALM, CX, CENX, CRL, CLNE, CNX, CMTL, CR, CCRN, DHR, ^DJU, DOV, DUK, EXP, ECL, EME, EXPI, FARO, FLEX, GILD, GPN, GFS, HLIT, HL, HOV, HUBG, IPI, IRM, KSS, LEG, LDOS, MTSI, M, MGY, MAS, MSFT, MLKN, MOS, MYGN, NFG, NKE, JWN, ORI, PKE, PATK, PFE, PPL, PSTG, QTWO, KWR, RRC, REGN, RGS, ROK, ROP, SAIC, SRE, SMTC, SR, SXI, TRGP, TER, TKR, RIG, TRV, TZOO, TG, UNM, VFC, VECO, VRTX, WSO, WMB, IYK, IDU, DDM, IYZ, MXI, ILF, IHI, EWA, EWO, EWK, EWZ, EEM, EWQ, EWW, EPP, EWP, EWD, EWL, THD, TUR, IBB, PPA, DBA, PXJ, PJP, PHO, XLY, XLV, XAR, XLU, VHT, VIS. Click this link for details (pattern type, start and end dates).
For a list of small patterns (those a few days wide) click this link.
$ $ $
The following table shows where Fibonacci retrace values of the day's high-low range are plus pivot points, calculated on the Dow industrials, sorted by value. When several are near each other (small differences), the area might act as support or resistance.
-- Thomas Bulkowski
![]()
| © 2025 ThePatternSite.com Metric | Value | Diff | Close (within 10% of the high-low range for the day)? |
| Monthly S2 | 42,200.90 | ||
| Weekly S2 | 42,528.71 | 327.82 | |
| Monthly S1 | 42,831.05 | 302.34 | |
| Weekly S1 | 42,994.96 | 163.91 | |
| Daily S2 | 43,145.86 | 150.90 | |
| Daily S1 | 43,303.54 | 157.67 | |
| Low | 43,343.67 | 40.14 | |
| Close | 43,461.21 | 117.54 | |
| 61.8% Down from Intraday High | 43,479.46 | 18.25 | Yes! The 61.8% Down from Intraday High is close to the Close. |
| Open | 43,493.12 | 13.66 | Yes! The Open is close to the 61.8% Down from Intraday High. |
| Daily Pivot | 43,501.34 | 8.22 | Yes! The Daily Pivot is close to the Open. |
| 50% Down from Intraday High | 43,521.41 | 20.07 | Yes! The 50% Down from Intraday High is close to the Daily Pivot. |
| 38.2% Down from Intraday High | 43,563.36 | 41.95 | |
| Daily R1 | 43,659.02 | 95.66 | |
| High | 43,699.15 | 40.13 | |
| Weekly Pivot | 43,815.58 | 116.43 | |
| Daily R2 | 43,856.82 | 41.25 | |
| Monthly Pivot | 43,942.71 | 85.88 | |
| Weekly R1 | 44,281.82 | 339.12 | |
| Monthly R1 | 44,572.86 | 291.04 | |
| Weekly R2 | 45,102.44 | 529.57 | |
| Monthly R2 | 45,684.52 | 582.08 |
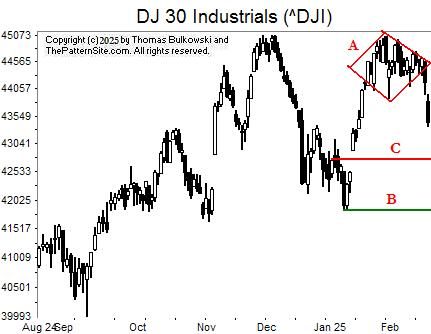
As the chart shows (daily scale), the Dow industrials tumbled a bit on Friday, 748 points or 1.7%. Two of three services I checked blamed economic numbers. One said it was Trump's policies beginning to effect the economy.
On the chart, I show a diamond top at A. That has a downward breakout, which happens 54% of the time (in stocks, bull market).
How far will it drop? Line C is the near target. I put it there because it's in the middle of the price congestion to the left.
Point B is another target. If the Dow blows through C, it might stop at B. I drew that line to match the recent low (which is a known support level because it already bottomed there).
Alternatively, we might get a nice bounce upward. Today's drop was overblown, I think, so a snapback rally is possible, if not likely. However, I think C is the best target of the three.
![]()
The following is a brief review of how the markets performed over time. The numbers refer to the close-to-close move in the Dow industrials.
No options expire this week.
![]()
The following is based on an SFO article in December 2004 by John Seekinger, titled, "Take a two-dimensional approach." He offers these tips.
| Index | S2 | S1 | Pivot | R1 | R2 |
| Dow Industrials (^DJI): Daily | 42,969 | 43,198 | 43,579 | 43,809 | 44,189 |
| Weekly | 42,518 | 42,973 | 43,805 | 44,260 | 45,091 |
| Monthly | 42,190 | 42,809 | 43,932 | 44,551 | 45,673 |
| S&P500 (^GSPC): Daily | 5,939 | 5,976 | 6,046 | 6,082 | 6,152 |
| Weekly | 5,918 | 5,965 | 6,056 | 6,104 | 6,195 |
| Monthly | 5,805 | 5,909 | 6,028 | 6,132 | 6,252 |
| Nasdaq (^IXIC): Daily | 19,178 | 19,351 | 19,684 | 19,857 | 20,190 |
| Weekly | 19,116 | 19,320 | 19,715 | 19,919 | 20,314 |
| Monthly | 18,617 | 19,071 | 19,595 | 20,048 | 20,572 |
Here are the formulas:
![]()
Earnings season is either underway or should be starting soon. The sessions could be more volatile.
Here's a symbol list of 243 chart and candlestick patterns (13 "investment grade" candle patterns) found in today's securities using my version of Patternz: AXDX, AEIS, AMD, ATSG, AKAM, ALRM, ALB, AA, ALGT, DOX, AEE, AEO, AEP, AMWD, APH, ANIK, APA, APOG, AMAT, ARCB, ANET, ARW, AGO, AVNT, AVA, BMI, BECN, BZH, BBY, BAH, CBT, CX, CENX, CHD, GLW, COTY, CR, CTS, XRAY, DDS, DSGR, ^DJU, ^DJT, D, DOV, EXP, EBAY, ECL, EME, EMR, EPAM, EQT, EXPI, FICO, FARO, FISV, FLEX, FORM, FTV, FWRD, FCX, GNW, GPN, GFS, GL, GMS, GGG, THG, HLIT, HE, HL, HELE, HP, HSIC, HNI, HD, HON, DHI, IDA, NSP, IBP, TILE, IPI, IRM, JKHY, KBH, KMT, KMB, LHX, LAMR, LEG, LEN, L, LOW, MTSI, M, MGY, MAN, MAS, MSFT, MLKN, MOS, MLI, MYGN, NBR, NOV, NKE, JWN, NOC, NTNX, OUT, PKE, PCTY, PFE, PPL, PFG, PHM, PSTG, QTWO, KWR, QCOM, RRC, RJF, RGS, RNG, ROK, RCKY, ROG, ROP, RES, SAIA, SAIC, SMG, SMTC, SLGN, SKYW, SCCO, LUV, SWX, SR, TRGP, TGT, TDY, TER, TTD, TMO, TKR, TJX, RIG, TZOO, UIS, UNH, UNM, VFC, VMI, VECO, VRTX, WMT, WAT, WSO, WERN, WPM, WMB, WSM, WWW, IYM, IYK, IYC, IHE, IDU, DDM, FXL, BOTZ, IYZ, IGV, IXC, MXI, ITB, EWA, EWC, ECH, EEM, EWH, EIS, EWI, EWW, EPP, EWD, EWL, TUR, IBB, PPA, DBA, PXJ, PJP, PHO, ROBO, XLY, XHB, XLB, XLU, UNG, VIS. Click this link for details (pattern type, start and end dates).
For a list of small patterns (those a few days wide) click this link.
The below industries were the best (rank 1) or worst performing of those I follow.
|
-- Thomas Bulkowski
![]()
Here's a symbol list of 114 chart and candlestick patterns (13 "investment grade" candle patterns) found in today's securities using my version of Patternz: AXDX, AMD, AKAM, ALB, AEP, AMN, ANIK, APA, ARCB, ANET, ARW, AVA, BMI, BAX, BMRN, BAH, BRKR, CBT, CDNS, CE, CHD, CNX, CMTL, CRH, CCK, CSGS, DVN, ^DJU, EXP, ECL, EME, EOG, EVH, FICO, FARO, FISV, FLS, GNW, GPN, GFS, HTLD, HELE, INTC, IRM, LANC, LEG, L, MTSI, M, MTRN, MOS, OXY, PAYX, PCTY, QTWO, KWR, QCOM, RJF, RGS, ROK, ROL, ROP, SLB, SMG, SEE, TRGP, TTD, TKR, TJX, TOL, TZOO, UIS, UNM, VFC, VLO, VMI, VECO, VRTX, VMC, WSO, WMB, WSM, IYK, IDU, SLV, EWO, EEM, EWM, EWW, EWP, THD, TUR, PPA, PXJ, PJP, ROBO, XLE, XRT, VIS. Click this link for details (pattern type, start and end dates).
For a list of small patterns (those a few days wide) click this link.
$ $ $
You can find setups based on a Fibonacci retrace by clicking on the link.
The following patterns were found manually, not using Patternz. Mr. Bulkowski has excluded any securities he owns from appearing in the list. However, he may add any of the securities listed to his portfolio at any time, just as you can.
In the table below, the red and green colors are based on the historical breakout direction for the associated chart pattern. If a high and tight flag appears, the start and end dates highlight the flagpole only and not the flag.
For details about the chart patterns, click here.
-- Thomas Bulkowski, author: Invest for Two-Comma Wealth and the novel (fiction), Foresight (#Ad)
![]()
| Symbol | Chart Pattern | Bullish Bearish | Start | End | Industry |
| A | Triple top | 01/22/2025 | 01/31/2025 | Precision Instrument | |
| ALB | Pipe bottom | 02/03/2025 | 02/10/2025 | Chemical (Diversified) | |
| AMZN | Double Top, Eve and Adam | 01/28/2025 | 02/04/2025 | Internet | |
| AMED | Triple top | 01/27/2025 | 02/19/2025 | Medical Services | |
| AEP | Ugly double bottom | 01/08/2025 | 02/03/2025 | Electric Utility (Central) | |
| AXP | Triple top | 01/23/2025 | 02/06/2025 | Financial Services | |
| AMN | Double Top, Adam and Eve | 01/14/2025 | 01/27/2025 | Human Resources | |
| ARCB | Triple top | 01/15/2025 | 01/31/2025 | Trucking/Transp. Leasing | |
| ARW | Double Bottom, Adam and Adam | 02/06/2025 | 02/13/2025 | Electronics | |
| AVNT | Ugly double bottom | 01/10/2025 | 02/03/2025 | Chemical (Specialty) | |
| CDNS | Diamond top | 12/27/2024 | 02/11/2025 | Computer Software and Svcs | |
| CALM | Triple top | 01/21/2025 | 02/12/2025 | Food Processing | |
| CE | Dead-cat bounce | 02/19/2025 | 02/19/2025 | Chemical (Basic) | |
| CDAY | Double Bottom, Adam and Adam | 02/05/2025 | 02/12/2025 | Information Services | |
| CCK | Diamond top | 01/28/2025 | 02/20/2025 | Packaging and Container | |
| CMI | Pipe bottom | 01/27/2025 | 02/03/2025 | Machinery | |
| ^DJI | Diamond top | 01/23/2025 | 02/18/2025 | None | |
| EPAM | Double Top, Adam and Eve | 02/07/2025 | 02/13/2025 | IT Services | |
| EFX | Double Top, Adam and Eve | 12/18/2024 | 01/27/2025 | Information Services | |
| GNW | Head-and-shoulders top | 01/30/2025 | 02/18/2025 | Insurance (Life) | |
| GPN | Double Top, Adam and Adam | 01/06/2025 | 01/31/2025 | Computer Software and Svcs | |
| GFS | Pipe bottom | 02/03/2025 | 02/10/2025 | Semiconductor | |
| GGG | Pipe bottom | 01/27/2025 | 02/03/2025 | Machinery | |
| HD | Head-and-shoulders top | 01/21/2025 | 02/06/2025 | Retail Building Supply | |
| L | Broadening top | 01/15/2025 | 02/20/2025 | Insurance (Prop/Casualty) | |
| MGY | Double Bottom, Adam and Adam | 02/07/2025 | 02/13/2025 | Petroleum (Producing) | |
| MTRN | Double Bottom, Adam and Eve | 02/03/2025 | 02/14/2025 | Metals and Mining (Div.) | |
| MDT | Double Top, Eve and Adam | 01/28/2025 | 02/14/2025 | Medical Supplies | |
| MU | Triple bottom | 01/29/2025 | 02/12/2025 | Semiconductor | |
| MS | Head-and-shoulders top | 01/29/2025 | 02/20/2025 | Securities Brokerage | |
| ORI | Triangle, symmetrical | 01/23/2025 | 02/13/2025 | Insurance (Prop/Casualty) | |
| PTEN | Pipe bottom | 01/27/2025 | 02/03/2025 | Oilfield Svcs/Equipment | |
| POR | Triple bottom | 01/13/2025 | 02/10/2025 | Electric Utility (West) | |
| PSTG | Triangle, symmetrical | 01/22/2025 | 02/19/2025 | Computers and Peripherals | |
| KWR | Ugly double bottom | 01/13/2025 | 02/03/2025 | Chemical (Specialty) | |
| RGA | Double Top, Eve and Adam | 01/30/2025 | 02/06/2025 | Insurance (Life) | |
| R | Double Bottom, Adam and Adam | 02/03/2025 | 02/12/2025 | Trucking/Transp. Leasing | |
| ^GSPC | Diamond top | 01/21/2025 | 02/12/2025 | None | |
| SAIA | Diamond top | 01/15/2025 | 02/11/2025 | Trucking/Transp. Leasing | |
| SCCO | Roof, inverted | 01/17/2025 | 02/20/2025 | Metals and Mining (Div.) | |
| SPSC | Double Top, Eve and Eve | 12/18/2024 | 01/23/2025 | E-Commerce | |
| TDY | Double Top, Eve and Eve | 01/23/2025 | 01/31/2025 | Aerospace/Defense | |
| TXN | Double Bottom, Adam and Eve | 02/05/2025 | 02/12/2025 | Semiconductor | |
| TJX | Head-and-shoulders top | 01/30/2025 | 02/14/2025 | Retail Store | |
| TRV | Falling wedge | 01/21/2025 | 02/20/2025 | Insurance (Prop/Casualty) | |
| TZOO | Triple bottom | 12/30/2024 | 02/03/2025 | Internet | |
| UHAL | Ugly double bottom | 01/13/2025 | 02/06/2025 | Trucking/Transp. Leasing | |
| UIS | Dead-cat bounce | 02/20/2025 | 02/20/2025 | Computers and Peripherals | |
| UNH | Head-and-shoulders complex top | 01/13/2025 | 02/11/2025 | Medical Services | |
| VFC | Pipe bottom | 02/03/2025 | 02/10/2025 | Apparel | |
| WSO | Double Bottom, Eve and Eve | 01/10/2025 | 02/10/2025 | Retail Building Supply | |
| WMB | Double Bottom, Adam and Adam | 01/28/2025 | 02/13/2025 | Natural Gas (Distributor) | |
| WWW | Dead-cat bounce | 02/19/2025 | 02/19/2025 | Shoe | |
| XEL | Head-and-shoulders bottom | 12/19/2024 | 02/10/2025 | Electric Utility (West) |
![]()
$ $ $
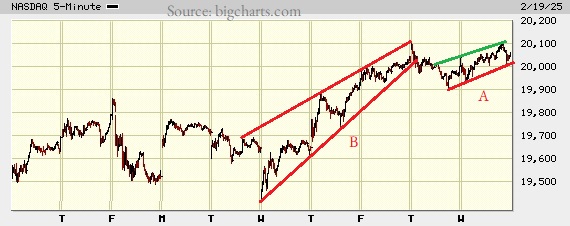
I show a picture of the Nasdaq composite on the 5-minute scale.
At B, we see the index making a chart pattern called a rising wedge. Those breakout downward 60% of the time in bull markets. This one broke out downward at the right tip.
At A, we see the index in a channel marked by the green line on top and the red trendline on the bottom.
Notice how the slopes of the lower lines on B and A have gentled, for lack of a better word. When a trendline goes from steep to shallow, it's a loss of momentum. It might indicate a trend change.
$ $ $
Here's a symbol list of 128 chart and candlestick patterns (13 "investment grade" candle patterns) found in today's securities using my version of Patternz: MMM, ANF, AXDX, ADBE, AKAM, ALB, DOX, AEP, ANIK, ANET, ADP, BSET, BBY, BMRN, BCO, BLDR, CDNS, CE, CF, CNX, CMTL, COP, CROX, CSGS, DVN, ^DJU, ^DJT, ^DJI, DTE, EXP, EOG, EXPD, FICO, FARO, FAST, FLS, FTNT, GFS, HSIC, HOLX, DHI, HUM, HURC, INFN, TILE, IRM, KEYS, KFRC, KMB, LAMR, LANC, LEG, RAMP, MTSI, M, MAN, MAS, NEU, OXY, PATK, PDCO, PAYX, PEN, QTWO, KWR, QCOM, RRC, REGN, RGS, RNG, ROP, ^GSPC, CRM, SMG, SCI, SGI, SCS, TRGP, TFX, TXN, TOL, TDG, TZOO, VFC, VECO, VRTX, WSO, WLK, WMB, WSM, WWW, IYK, IHE, IDU, FDN, FXL, IYH, IHF, IEO, IYF, ITB, EWA, EWW, EZA, EWY, TUR, PBE, PXJ, PJP, SSO, XLE, XHB, XLU, UNG, USO, VHT. Click this link for details (pattern type, start and end dates).
For a list of small patterns (those a few days wide) click this link.
$ $ $
The following table shows where Fibonacci retrace values of the day's high-low range are plus pivot points, calculated on the Nasdaq composite, sorted by value. When several are near each other (small differences), the area might act as support or resistance.
-- Thomas Bulkowski
![]()
| © 2025 ThePatternSite.com Metric | Value | Diff | Close (within 10% of the high-low range for the day)? |
| Monthly S2 | 18,381.22 | ||
| Weekly S2 | 19,207.88 | 826.66 | |
| Monthly S1 | 19,217.24 | 9.35 | Yes! The Monthly S1 is close to the Weekly S2. |
| Weekly S1 | 19,630.57 | 413.33 | |
| Monthly Pivot | 19,667.92 | 37.36 | |
| Weekly Pivot | 19,838.16 | 170.24 | |
| Daily S2 | 19,856.68 | 18.51 | |
| Low | 19,928.89 | 72.21 | |
| Daily S1 | 19,954.96 | 26.07 | |
| 61.8% Down from Intraday High | 19,994.02 | 39.06 | |
| Open | 19,994.50 | 0.48 | Yes! The Open is close to the 61.8% Down from Intraday High. |
| 50% Down from Intraday High | 20,014.14 | 19.64 | |
| Daily Pivot | 20,027.18 | 13.04 | Yes! The Daily Pivot is close to the 50% Down from Intraday High. |
| 38.2% Down from Intraday High | 20,034.26 | 7.08 | Yes! The 38.2% Down from Intraday High is close to the Daily Pivot. |
| Close | 20,053.25 | 18.99 | |
| High | 20,099.39 | 46.14 | |
| Daily R1 | 20,125.46 | 26.07 | |
| Daily R2 | 20,197.68 | 72.21 | |
| Weekly R1 | 20,260.85 | 63.17 | |
| Weekly R2 | 20,468.44 | 207.60 | |
| Monthly R1 | 20,503.94 | 35.49 | |
| Monthly R2 | 20,954.62 | 450.69 |
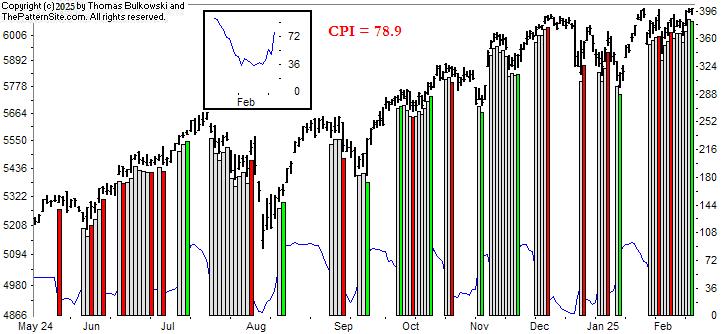
This is a picture of the chart pattern indicator on the daily scale. The indicator is the line chart below a chart of the S&P 500 composite.
The most recent signal is bullish with a reading of 78.9 out of 100, where below 35 is bearish and above 65 is bullish. I show that with the vertical green bar on the far right of the chart.
If the market were to make a big move down, the green bar could change to red for up to a week. So the green bar might not be as bullish as it appears.
The inset in the far upper center of the chart shows the CPI made a U-shaped turn. Such a gentle turn is unusual. Normally, it's a sharper turn.
If the market were to drop just a bit, we could see the bullish signal change to neutral (white).
My guess as to direction? I thought that overhead resistance would stop an upward advance and it has, with several attempts to rise above the December peak not making much headway. We'll have to see what happens next because I don't have a good feeling as to what will happen.
$ $ $
With cold snap approaching, I came up with a new idea. I've doors that leak air into the house. They have seals which came with the door but with foundation shifting, gaps have appeared.
As a bicycle rider, I took a bad inner tube (it sprung a leak) and cut off the valve. Then I nailed it to the door jam, right over the old seal (the tube is almost as tall as the door. Yippee!). I did that for the top and door knob edges (not bottom or hinge side) of the door.
Worked great! The existing strip was glued or somehow fastened to the door frame, so it would have been tough to remove.
One lesson I learned. Nail on the surface that the door will not press against. If you nail it on the same side as the door presses against, it'll depress the tire enough to allow air infiltration. So nail it on the adjacent side to hold the tire in place.
$ $ $
Here's a symbol list of 139 chart and candlestick patterns (13 "investment grade" candle patterns) found in today's securities using my version of Patternz: ABT, ANF, AXDX, ACN, APD, ATSG, AEP, AXP, ANIK, AON, ANET, AZTA, BSET, BAX, BZH, BA, BAH, BRC, CHD, CTAS, CAG, CXW, CRH, CCK, CSGS, CTS, FANG, ^DJU, ELV, EVRG, FDS, FARO, FLS, FTNT, GIS, GL, GOOGL, HE, HSIC, HSY, HUN, ITW, TILE, INTU, IRM, JBLU, KMB, LAMR, LANC, LMT, L, M, MCHX, MAS, MU, MS, NFG, NFLX, NJR, NEU, ORI, ON, ORCL, OUT, OXM, PATK, PNW, POR, PPG, PINC, QTWO, KWR, QCOM, DGX, ROP, R, SAND, SCHW, SHOP, SKYW, SGI, LUV, SR, SSYS, TPR, TRGP, TDOC, TEVA, TJX, RIG, TWLO, UGI, UNH, UNM, VMI, MDRX, VRTX, V, WSO, WEX, WMB, WDAY, XEL, ITA, FDN, QTEC, BOTZ, IXN, EWO, EWK, EEM, EWG, EIS, EWI, EWJ, EWW, EWS, EWY, EWP, EWT, EWU, PPA, PJP, ROBO, USO, SMH. Click this link for details (pattern type, start and end dates).
For a list of small patterns (those a few days wide) click this link.
-- Thomas Bulkowski
![]()
$ $ $
I show another slider trading quiz featuring United Parcel Service 2: UPS stock.
$ $ $
Here's a symbol list of 157 chart and candlestick patterns (13 "investment grade" candle patterns) found in today's securities using my version of Patternz: ABT, ACN, AA, AEP, AMN, ANIK, AMAT, ARCB, ACGL, ADM, ADP, AVY, AVA, BSET, BKH, BG, CAL, CE, CLS, COR, CENX, CVX, CTAS, CLF, CNX, CGNX, COTY, CR, CRH, CCRN, CMI, FANG, DDS, DFS, ^DJU, D, DOV, EOG, EL, EXPD, FLEX, FTNT, FNV, FDP, GME, GPRO, GGG, GFF, HBI, HL, HP, HUBG, JBHT, IDA, IDXX, INTC, IPAR, IPI, KALU, KFRC, LZB, LAMR, LANC, MTRN, NTGR, NJR, NI, NUS, NVDA, OLN, OTEX, OUT, OXM, PTEN, PLXS, POR, PPL, PINC, KWR, QCOM, ROP, ROST, RGLD, SAND, SHW, STR, SWX, SR, SXI, TRGP, TTD, TMO, TJX, TDG, RIG, TREX, TWLO, VRTX, WPM, WMB, XEL, ZBRA, ITA, IYK, IHE, IDU, FTEC, QTEC, FXI, ICF, IYH, IXN, ILF, SOXX, EWO, EWK, EEM, EWQ, EWH, EWI, EWW, EZA, EWY, EWP, EWU, QLD, PJP, PHO, XLV, XHB, XLI, XLK, XLU, UNG, SMH, VHT. Click this link for details (pattern type, start and end dates).
For a list of small patterns (those a few days wide) click this link.
$ $ $
The following table shows where Fibonacci retrace values of the day's high-low range are plus pivot points, calculated on the Dow industrials, sorted by value. When several are near each other (small differences), the area might act as support or resistance.
-- Thomas Bulkowski
![]()
| © 2025 ThePatternSite.com Metric | Value | Diff | Close (within 10% of the high-low range for the day)? |
| Monthly S2 | 40,605.64 | ||
| Monthly S1 | 42,575.86 | 1,970.22 | |
| Weekly S2 | 43,808.63 | 1,232.77 | |
| Monthly Pivot | 43,815.11 | 6.48 | Yes! The Monthly Pivot is close to the Weekly S2. |
| Weekly S1 | 44,177.36 | 362.25 | |
| Daily S2 | 44,334.61 | 157.25 | |
| Daily S1 | 44,440.34 | 105.74 | |
| Weekly Pivot | 44,473.20 | 32.86 | |
| Low | 44,498.96 | 25.76 | Yes! The Low is close to the Weekly Pivot. |
| Close | 44,546.08 | 47.12 | |
| 61.8% Down from Intraday High | 44,602.13 | 56.05 | |
| Daily Pivot | 44,604.70 | 2.56 | Yes! The Daily Pivot is close to the 61.8% Down from Intraday High. |
| 50% Down from Intraday High | 44,634.00 | 29.31 | |
| 38.2% Down from Intraday High | 44,665.88 | 31.87 | |
| Daily R1 | 44,710.43 | 44.56 | |
| Open | 44,720.99 | 10.55 | Yes! The Open is close to the Daily R1. |
| High | 44,769.05 | 48.06 | |
| Weekly R1 | 44,841.93 | 72.88 | |
| Daily R2 | 44,874.79 | 32.86 | |
| Weekly R2 | 45,137.77 | 262.99 | |
| Monthly R1 | 45,785.33 | 647.55 | |
| Monthly R2 | 47,024.58 | 1,239.25 |
Here's a symbol list of 149 chart and candlestick patterns (13 "investment grade" candle patterns) found in today's securities using my version of Patternz: DDD, AXDX, A, ATSG, ALK, AA, ALGT, AMED, AEP, AMN, ANIK, AR, AON, AGO, ADP, AVY, AVA, BIO, BIIB, BCO, CE, COR, CNC, CENX, CVX, CSCO, CLNE, CNX, CSGP, CR, CCRN, CMI, FANG, ^DJU, D, DOV, EXPD, FARO, FIVN, FLEX, FORM, FCX, GME, GNW, GPN, GPRO, GGG, GFF, HBI, THG, HSII, HNI, HUM, ITW, INCY, INTC, IPI, JBLU, JNJ, KMT, KMB, LHX, LZB, LAMR, RAMP, MGY, NBR, NFG, NTGR, NUS, NVDA, OMCL, OR, PTEN, PAYX, KWR, QCOM, DGX, RMBS, RGS, ROP, RGLD, SAND, SAIC, SR, SPSC, SXI, TPR, TRGP, TXN, TTD, TMO, TDG, TWLO, UGI, VRTX, WMB, WWW, ZBRA, ITA, IAI, IYK, IDU, FTEC, FDN, QTEC, FXL, IYZ, IEV, MXI, IXN, ILF, EWO, EWK, EWQ, EWG, EWW, EWY, EWD, EWL, QLD, IBB, PPA, DBA, PBE, PEJ, PJP, XLK, XLU, UNG, SMH, VAW. Click this link for details (pattern type, start and end dates).
For a list of small patterns (those a few days wide) click this link.
$ $ $
You can find setups based on a Fibonacci retrace by clicking on the link.
The following patterns were found manually, not using Patternz. Mr. Bulkowski has excluded any securities he owns from appearing in the list. However, he may add any of the securities listed to his portfolio at any time, just as you can.
In the table below, the red and green colors are based on the historical breakout direction for the associated chart pattern. If a high and tight flag appears, the start and end dates highlight the flagpole only and not the flag.
For details about the chart patterns, click here.
-- Thomas Bulkowski, author: Invest for Two-Comma Wealth and the novel (fiction), Foresight (#Ad)
![]()
| Symbol | Chart Pattern | Bullish Bearish | Start | End | Industry |
| ABM | Double Bottom, Eve and Adam | 01/24/2025 | 02/03/2025 | Industrial Services | |
| ADBE | Head-and-shoulders bottom | 12/20/2024 | 01/27/2025 | Computer Software and Svcs | |
| ACGL | Double Top, Adam and Adam | 01/17/2025 | 01/28/2025 | Insurance (Prop/Casualty) | |
| ARW | Double Top, Eve and Adam | 12/09/2024 | 01/22/2025 | Electronics | |
| ADSK | Head-and-shoulders bottom | 12/20/2024 | 01/27/2025 | Computer Software and Svcs | |
| AZTA | Double Top, Eve and Adam | 01/30/2025 | 02/06/2025 | Semiconductor Cap Equip. | |
| BECN | Triangle, ascending | 01/15/2025 | 02/13/2025 | Retail Building Supply | |
| BKNG | Double Bottom, Eve and Adam | 01/22/2025 | 02/03/2025 | Internet | |
| BRC | Triangle, symmetrical | 11/11/2024 | 02/11/2025 | Chemical (Diversified) | |
| CPB | Double Bottom, Adam and Adam | 02/05/2025 | 02/10/2025 | Food Processing | |
| COR | Double Top, Adam and Adam | 01/30/2025 | 02/05/2025 | Biotechnology | |
| CENX | Pipe bottom | 01/27/2025 | 02/03/2025 | Metals and Mining (Div.) | |
| CDAY | Double Top, Adam and Adam | 01/06/2025 | 01/28/2025 | Information Services | |
| CF | Head-and-shoulders top | 12/04/2024 | 02/04/2025 | Chemical (Basic) | |
| CNX | Pipe bottom | 01/27/2025 | 02/03/2025 | Natural Gas (Diversified) | |
| CGNX | Three Falling Peaks | 01/21/2025 | 02/11/2025 | Precision Instrument | |
| CMCO | Dead-cat bounce | 02/11/2025 | 02/11/2025 | Machinery | |
| DFS | Double Top, Adam and Adam | 01/23/2025 | 01/30/2025 | Financial Services | |
| ^DJU | Diamond bottom | 12/24/2024 | 02/10/2025 | None | |
| D | Triple bottom | 01/13/2025 | 02/04/2025 | Electric Utility (East) | |
| DTE | Triple bottom | 12/19/2024 | 01/23/2025 | Electric Utility (Central) | |
| EXP | Double Top, Eve and Adam | 01/27/2025 | 02/06/2025 | Cement and Aggregates | |
| ECL | Ugly double bottom | 01/13/2025 | 02/10/2025 | Chemical (Specialty) | |
| EL | Ugly double bottom | 11/12/2024 | 01/03/2025 | Toiletries/Cosmetics | |
| EXPI | Double Top, Eve and Eve | 01/17/2025 | 01/28/2025 | E-Commerce | |
| EZPW | Pipe bottom | 12/16/2024 | 12/23/2024 | Financial Services | |
| FLEX | Double Bottom, Adam and Adam | 01/28/2025 | 02/03/2025 | Electronics | |
| GMS | Double Top, Eve and Eve | 01/21/2025 | 01/30/2025 | Cement and Aggregates | |
| GPRO | Dead-cat bounce | 02/07/2025 | 02/07/2025 | Electronics | |
| GGG | Double Bottom, Adam and Adam | 01/28/2025 | 02/03/2025 | Machinery | |
| HBI | Dead-cat bounce | 02/13/2025 | 02/13/2025 | Apparel | |
| HLIT | Dead-cat bounce | 02/11/2025 | 02/11/2025 | Telecom. Equipment | |
| HE | Ugly double bottom | 01/13/2025 | 01/29/2025 | Electric Utility (West) | |
| HSIC | Double Top, Adam and Adam | 01/29/2025 | 02/05/2025 | Medical Supplies | |
| HOLX | Double Top, Eve and Adam | 01/28/2025 | 02/05/2025 | Medical Supplies | |
| INTC | Triple bottom | 12/20/2024 | 02/03/2025 | Semiconductor | |
| IPG | Double Top, Adam and Eve | 01/27/2025 | 02/04/2025 | Advertising | |
| ISRG | Double Bottom, Eve and Adam | 01/27/2025 | 02/03/2025 | Medical Supplies | |
| KFRC | Double Top, Eve and Eve | 01/02/2025 | 01/15/2025 | Human Resources | |
| KLIC | Head-and-shoulders top | 12/26/2024 | 01/21/2025 | Semiconductor Cap Equip. | |
| LAMR | Roof, inverted | 01/21/2025 | 02/13/2025 | Advertising | |
| LNC | Ugly double bottom | 01/10/2025 | 02/05/2025 | Insurance (Life) | |
| MTRN | Double Top, Adam and Adam | 01/21/2025 | 01/31/2025 | Metals and Mining (Div.) | |
| MDT | Triple bottom | 02/03/2025 | 02/12/2025 | Medical Supplies | |
| MYGN | Triple bottom | 01/23/2025 | 02/10/2025 | Biotechnology | |
| ^IXIC | Diamond bottom | 12/19/2024 | 02/12/2025 | None | |
| NTGR | Triple bottom | 01/13/2025 | 02/06/2025 | Telecom. Equipment | |
| NTAP | Double Top, Eve and Eve | 01/22/2025 | 02/07/2025 | Computers and Peripherals | |
| NWL | Dead-cat bounce | 02/07/2025 | 02/07/2025 | Household Products | |
| NWPX | Pipe bottom | 01/06/2025 | 01/13/2025 | Building Materials | |
| NVDA | Pipe bottom | 01/27/2025 | 02/03/2025 | Semiconductor | |
| OGE | Ugly double bottom | 01/13/2025 | 01/27/2025 | Electric Utility (Central) | |
| OR | Head-and-shoulders complex bottom | 01/06/2025 | 02/03/2025 | Metals and Mining (Div.) | |
| PANW | Ugly double bottom | 01/13/2025 | 02/03/2025 | Computer Software and Svcs | |
| PETS | Dead-cat bounce | 02/11/2025 | 02/11/2025 | Medical Services | |
| PNW | Head-and-shoulders bottom | 12/18/2024 | 01/27/2025 | Electric Utility (West) | |
| POR | Double Bottom, Adam and Adam | 02/04/2025 | 02/10/2025 | Electric Utility (West) | |
| DGX | Ugly double bottom | 01/16/2025 | 02/10/2025 | Medical Services | |
| RGS | Dead-cat bounce | 02/12/2025 | 02/12/2025 | Toiletries/Cosmetics | |
| ROST | Three Falling Peaks | 12/09/2024 | 01/31/2025 | Retail (Special Lines) | |
| SMTC | Dead-cat bounce | 02/10/2025 | 02/10/2025 | Semiconductor Cap Equip. | |
| SHW | Diamond top | 01/21/2025 | 02/11/2025 | Chemical (Basic) | |
| SCS | Double Bottom, Eve and Adam | 01/13/2025 | 02/04/2025 | Furn/Home Furnishings | |
| TECH | Double Top, Eve and Adam | 01/22/2025 | 02/05/2025 | Biotechnology | |
| TFX | Double Top, Adam and Eve | 01/06/2025 | 01/27/2025 | Diversified Co. | |
| TDC | Dead-cat bounce | 02/12/2025 | 02/12/2025 | Computer Software and Svcs | |
| TTD | Dead-cat bounce | 02/13/2025 | 02/13/2025 | Advertising | |
| TMO | Pipe top | 01/27/2025 | 02/03/2025 | Precision Instrument | |
| TSCO | Pipe top | 01/21/2025 | 01/27/2025 | Retail Building Supply | |
| VMC | Triple top | 01/21/2025 | 02/06/2025 | Cement and Aggregates |
![]()
$ $ $
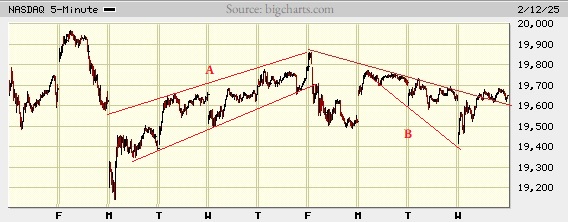
I show a picture of the Nasdaq composite on the 5-minute scale.
Two chart patterns come to mind when I drew trendlines. The first, at A, is a up-sloping channel. Because they are sloping upward, they breakout downward most often (because it takes extra thrust to push the index above the top of the channel and it's easier to drop).
The second pattern is at B and it's called a descending broadening wedge. Those are rare but also harder to spot. They breakout upward 72% of the time, just as this one did.
Price has been sliding along the top trendline for about two weeks now. The chart pattern indicator has turned bearish and remains so. That suggests the market is weak and is going to fall. That notion is probably right for the daily charts. I don't know about intraday, though. This looks like it is going to rise tomorrow. That's a guess...
$ $ $
Here's a symbol list of 172 chart and candlestick patterns (13 "investment grade" candle patterns) found in today's securities using my version of Patternz: AXDX, AYI, AEIS, A, APD, AA, AEO, AEP, ANIK, AMAT, AGO, ATO, AZTA, BALL, BAX, BZH, BERY, BIO, BIIB, BR, BLDR, CDNS, CPB, CLS, COR, CNP, CENX, CF, CVX, CHD, CNX, CMCO, CMTL, CSGP, COST, COTY, CCRN, CTS, CMI, ^DJU, DOV, EXP, EME, EXPI, FLEX, FNV, GAP, IT, GILD, GPN, GFS, GPRO, GGG, HBI, HE, HSII, HSIC, DHI, IBP, TILE, IPG, IPI, INTU, IRM, KFRC, KMB, LHX, LZB, LDOS, LLY, L, LOW, MTSI, MAS, MTRN, MU, MYGN, NFLX, NTGR, NTAP, NVDA, OMCL, OTEX, OR, PKG, PTEN, PCTY, PLXS, PEG, PSTG, KWR, QCOM, DGX, RGS, RNG, ROL, ROP, RGLD, SAND, NOW, SHW, SXI, TPR, TRGP, TGT, TDC, TER, TEVA, TTD, TMO, TOL, TREX, VRTX, WMT, WAT, WPM, WMB, WSM, WWW, WDAY, IYK, IYC, IHE, IDU, FTEC, FXL, FXI, BOTZ, IYZ, IXN, SOXX, ITB, EWO, EWK, ECH, EIS, EWM, EWW, EWP, EWT, TUR, EWU, QLD, PBE, PEJ, PJP, PHO, XLY, XHB, XLK, XLU, SMH. Click this link for details (pattern type, start and end dates).
For a list of small patterns (those a few days wide) click this link.
$ $ $
The following table shows where Fibonacci retrace values of the day's high-low range are plus pivot points, calculated on the Nasdaq composite, sorted by value. When several are near each other (small differences), the area might act as support or resistance.
-- Thomas Bulkowski
![]()
| © 2025 ThePatternSite.com Metric | Value | Diff | Close (within 10% of the high-low range for the day)? |
| Monthly S2 | 18,246.79 | ||
| Weekly S2 | 18,829.82 | 583.03 | |
| Monthly S1 | 18,948.37 | 118.55 | |
| Weekly S1 | 19,239.88 | 291.51 | |
| Daily S2 | 19,315.62 | 75.73 | |
| Low | 19,415.48 | 99.86 | |
| Open | 19,436.51 | 21.03 | Yes! The Open is close to the Low. |
| Daily S1 | 19,482.78 | 46.27 | |
| 61.8% Down from Intraday High | 19,517.49 | 34.70 | |
| Monthly Pivot | 19,533.49 | 16.00 | Yes! The Monthly Pivot is close to the 61.8% Down from Intraday High. |
| 50% Down from Intraday High | 19,548.99 | 15.50 | Yes! The 50% Down from Intraday High is close to the Monthly Pivot. |
| Weekly Pivot | 19,551.22 | 2.22 | Yes! The Weekly Pivot is close to the 50% Down from Intraday High. |
| 38.2% Down from Intraday High | 19,580.50 | 29.29 | |
| Daily Pivot | 19,582.65 | 2.14 | Yes! The Daily Pivot is close to the 38.2% Down from Intraday High. |
| Close | 19,649.95 | 67.30 | |
| High | 19,682.51 | 32.56 | |
| Daily R1 | 19,749.81 | 67.30 | |
| Daily R2 | 19,849.68 | 99.86 | |
| Weekly R1 | 19,961.28 | 111.61 | |
| Monthly R1 | 20,235.07 | 273.79 | |
| Weekly R2 | 20,272.62 | 37.55 | |
| Monthly R2 | 20,820.19 | 547.57 |
This is a picture of the chart pattern indicator on the daily scale. The indicator is the line chart below a chart of the S&P 500 composite.
After hovering in the neutral zone (white bars) for four times as long as in the bearish bars (red), the CPI turned to red again. That's the red bar on the far right of the chart.
Hidden beneath the bars is the signal line. That's the thin blue one at the bottom of the chart. I pasted an inset of the CPI on the top left of the chart for your viewing pleasure.
![]()
The indicator dropped to 29.3, which is bearish (below 35 is bearish). This reading suggests the index is going down, but it's not known for how long it might drop or even if it'll drop. Signals can change for up to a week, but it suggests weakness.
$ $ $
Here's a symbol list of 135 chart and candlestick patterns (13 "investment grade" candle patterns) found in today's securities using my version of Patternz: AES, ALRM, ALB, AA, ALKS, AEP, ANIK, APA, AMAT, ARCB, ACGL, AWI, AVA, AZTA, CACI, CDNS, CALM, COR, CENX, CVX, CHD, CINF, CNX, CTSH, CMCO, CMTL, CXW, CCRN, CMI, CW, DOV, ELV, EME, EPAM, EVH, EXC, EXPI, FIS, FLEX, FLS, FNV, GE, GPN, GPRO, GGG, GFF, HLIT, HQY, HSY, JBHT, IDA, ILMN, INCY, INFN, IBKR, IPG, IPI, IRM, LZB, LANC, LDOS, LEN, MRTN, META, MU, MUR, NFG, NTGR, NVDA, OMC, OR, PTEN, PETS, PSTG, QCOM, DGX, REGN, ROP, SAIA, CRM, SAIC, SEIC, SRE, SCI, SPSC, SXI, SNPS, TRGP, TDY, TEVA, TMO, TZOO, UNM, VRTX, VC, WDAY, XEL, ITA, IYK, IDU, DDM, FTEC, ICF, IEV, IXN, SOXX, EWO, EWK, EWQ, EWG, EWH, EWI, EWP, EWT, EWU, QLD, IBB, PBE, PJP, XLY, XLK, XLU, UNG, USO, SMH. Click this link for details (pattern type, start and end dates).
For a list of small patterns (those a few days wide) click this link.
-- Thomas Bulkowski
![]()
$ $ $
I show another slider trading quiz featuring United Technologies: UTX stock.
$ $ $
Here's a symbol list of 103 chart and candlestick patterns (13 "investment grade" candle patterns) found in today's securities using my version of Patternz: ALB, ALKS, AEE, AEP, ANIK, APOG, AIZ, BSET, BAX, BBY, BMRN, BKH, BA, BMY, CE, CENX, CMCO, COP, CSGP, COTY, EG, XOM, FDS, FIS, FLEX, FTNT, FTV, FNV, GAP, GIS, GPRO, GES, HBI, HUM, JBHT, HURC, ILMN, IBKR, INTU, KMB, KSS, LANC, LOW, MANH, MLM, MTRX, MS, NWL, NI, NWPX, OR, OMI, PKG, PETS, PGR, KWR, QCOM, DGX, REGN, RGA, ROK, ROP, ROST, SAND, SLB, SMTC, STR, SKX, SKYW, SO, TRGP, TDY, TTD, TMO, TSCO, TZOO, UGI, UNM, VRTX, WU, WWW, WWD, WDAY, XEL, IAI, IYK, IYE, IDU, FXI, IAT, IXC, IGE, IYF, EIS, PPA, PBE, PJP, PHO, XLF, GLD, XLU. Click this link for details (pattern type, start and end dates).
For a list of small patterns (those a few days wide) click this link.
$ $ $
The following table shows where Fibonacci retrace values of the day's high-low range are plus pivot points, calculated on the Dow industrials, sorted by value. When several are near each other (small differences), the area might act as support or resistance.
-- Thomas Bulkowski
![]()
| © 2025 ThePatternSite.com Metric | Value | Diff | Close (within 10% of the high-low range for the day)? |
| Monthly S2 | 40,580.42 | ||
| Monthly S1 | 42,525.41 | 1,945.00 | |
| Weekly S2 | 43,331.13 | 805.71 | |
| Monthly Pivot | 43,789.89 | 458.76 | |
| Weekly S1 | 43,900.77 | 110.88 | |
| Daily S2 | 44,143.90 | 243.13 | |
| Low | 44,301.42 | 157.52 | |
| Daily S1 | 44,307.16 | 5.73 | Yes! The Daily S1 is close to the Low. |
| Open | 44,396.92 | 89.77 | |
| 61.8% Down from Intraday High | 44,423.95 | 27.03 | Yes! The 61.8% Down from Intraday High is close to the Open. |
| Weekly Pivot | 44,448.70 | 24.75 | Yes! The Weekly Pivot is close to the 61.8% Down from Intraday High. |
| 50% Down from Intraday High | 44,461.80 | 13.11 | Yes! The 50% Down from Intraday High is close to the Weekly Pivot. |
| Daily Pivot | 44,464.67 | 2.87 | Yes! The Daily Pivot is close to the 50% Down from Intraday High. |
| Close | 44,470.41 | 5.74 | Yes! The Close is close to the Daily Pivot. |
| 38.2% Down from Intraday High | 44,499.66 | 29.25 | Yes! The 38.2% Down from Intraday High is close to the Close. |
| High | 44,622.19 | 122.54 | |
| Daily R1 | 44,627.93 | 5.73 | Yes! The Daily R1 is close to the High. |
| Daily R2 | 44,785.44 | 157.52 | |
| Weekly R1 | 45,018.34 | 232.90 | |
| Weekly R2 | 45,566.27 | 547.93 | |
| Monthly R1 | 45,734.88 | 168.61 | |
| Monthly R2 | 46,999.36 | 1,264.47 |
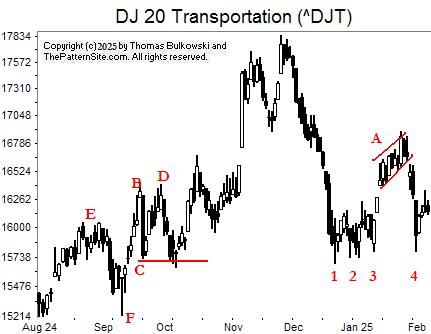
This is a chart of the Dow transports. It's busy, so let's go through it by the numbers and the letters.
123 is a confirmed triple bottom chart pattern. You might consider this a three rising valleys chart pattern. Whichever you pick, it's a bullish pattern.
The index climbed to form a flag at A. This pattern broke out downward to make a fourth bottom at, well, 4.
Looking ahead, I'd anticipate 4 finding a bottom right where it is. There's support setup by bottoms 123. Indeed, the index bounced off 4 and climbed.
Looking back, we see a unconfirmed double top at BD. I write unconfirmed because the index didn't close below horizontal red line C.
What does that mean? The twin peak pattern is just squiggles on a price chart. The index climbed from the low near the red line to the highest peak on the chart. The rise is a warning about waiting for confirmation.
E is another double top, which did confirm as a valid chart pattern. The index dropped to F before recovering. Twin peak E is how a double top is supposed to act (meaning price drops after confirmation).
![]()
The following is a brief review of how the markets performed over time. The numbers refer to the close-to-close move in the Dow industrials.
No options expire this week.
![]()
The following is based on an SFO article in December 2004 by John Seekinger, titled, "Take a two-dimensional approach." He offers these tips.
| Index | S2 | S1 | Pivot | R1 | R2 |
| Dow Industrials (^DJI): Daily | 43,903 | 44,103 | 44,480 | 44,680 | 45,057 |
| Weekly | 43,275 | 43,789 | 44,393 | 44,907 | 45,511 |
| Monthly | 40,525 | 42,414 | 43,734 | 45,624 | 46,944 |
| S&P500 (^GSPC): Daily | 5,968 | 5,997 | 6,049 | 6,078 | 6,130 |
| Weekly | 5,840 | 5,933 | 6,017 | 6,110 | 6,194 |
| Monthly | 5,621 | 5,823 | 5,976 | 6,178 | 6,331 |
| Nasdaq (^IXIC): Daily | 19,252 | 19,388 | 19,625 | 19,761 | 19,998 |
| Weekly | 18,788 | 19,156 | 19,509 | 19,877 | 20,230 |
| Monthly | 18,205 | 18,864 | 19,491 | 20,151 | 20,778 |
Here are the formulas:
![]()
Earnings season is either underway or should be starting soon. The sessions could be more volatile.
Here's a symbol list of 185 chart and candlestick patterns (13 "investment grade" candle patterns) found in today's securities using my version of Patternz: ACIW, ADTN, A, ALB, ALKS, AEP, ANIK, ATR, ASH, BMI, BZH, BMRN, BA, BKNG, BMY, CBT, CDNS, CNC, CINF, CTAS, CLF, CMCO, COP, CXW, CSGP, COTY, EMN, EMR, EPAM, EFX, EVH, EXC, FIS, FIVN, FLEX, FLS, FMC, FTNT, FTV, FNV, FCX, GAP, GPRO, HBI, HL, HP, HSIC, HNI, HOLX, HON, DHI, HWM, IEX, ILMN, IIIN, PODD, INTU, JNJ, KALU, KBH, KSS, MGY, MCHX, MRTN, MLM, MA, MTRN, MSFT, MS, NTGR, NWL, NKE, NWPX, NUS, NTNX, OR, OMI, PKG, PANW, PKE, PCTY, PETS, PNW, POR, PFG, PGR, PEG, QTWO, QCOM, DGX, RMBS, REGN, RLI, RCKY, ROP, ROST, RGLD, RES, SAIA, CRM, SAND, SEIC, SMTC, NOW, SHOP, SLGN, LUV, SWX, SXI, SNPS, TRGP, TXN, TXT, TSCO, RIG, TZOO, UIS, UNM, VMI, VEEV, VRSN, VRTX, WMT, WU, WWW, WWD, WDAY, XEL, IEZ, IHE, FTEC, FDN, QTEC, FXI, QQQ, ICF, IAT, IEV, IGV, MXI, IXN, SOXX, SLV, IGE, IEO, IYF, ITB, EWZ, EEM, EWQ, EWH, EPP, EWS, EWP, EWD, EWT, QLD, PXJ, PJP, SSO, XLE, XLF, XLI, SPY, XLK, SMH, VIS, VAW, MGK, VONG. Click this link for details (pattern type, start and end dates).
For a list of small patterns (those a few days wide) click this link.
The below industries were the best (rank 1) or worst performing of those I follow.
|
-- Thomas Bulkowski
![]()
Here's a symbol list of 167 chart and candlestick patterns (13 "investment grade" candle patterns) found in today's securities using my version of Patternz: ATSG, AKAM, ALRM, ALB, AEP, AMGN, ANIK, AR, AON, ATR, ARW, AVY, BMI, BKH, BA, BRKR, CX, CNC, CDAY, CHKP, CHD, CLF, ED, CXW, COST, CRH, CSGS, DSGR, EMN, EIX, EMR, EFX, EQT, EVH, XOM, EZPW, FFIV, FICO, FARO, FIVN, FLS, FORM, FTNT, FNV, GME, GAP, GL, GPRO, HBI, THG, HE, HSIC, JBHT, IIIN, JKHY, JNJ, KLAC, LANC, LEG, MGY, MANH, MTRX, MSFT, MUR, NOV, NTGR, NEU, NTNX, NVDA, OLN, ON, OMI, PKE, PCTY, PNW, POR, PRU, PEG, QCOM, DGX, RRC, RJF, ROP, ROST, RES, SBH, SCHW, SAIC, SMG, SEE, SRE, SHOP, SLGN, STR, SCCO, SWX, SR, SPSC, SXI, SCS, TPR, TRGP, TGT, TDY, TPX, TTD, TJX, TSCO, UHAL, UNM, VRTX, WRB, WAT, WERN, WU, WEX, WMB, WSC, WWW, ZBRA, IAI, IYE, IEZ, IDU, IYZ, IEV, MXI, ILF, SLV, IGE, IEO, IYF, ITB, EWO, EWK, EWQ, EWG, EWI, EWJ, EPP, EZA, EWP, EWD, THD, PBE, PJP, XLP, XLE, XLF, XLU, MGK. Click this link for details (pattern type, start and end dates).
For a list of small patterns (those a few days wide) click this link.
$ $ $
You can find setups based on a Fibonacci retrace by clicking on the link.
The following patterns were found manually, not using Patternz. Mr. Bulkowski has excluded any securities he owns from appearing in the list. However, he may add any of the securities listed to his portfolio at any time, just as you can.
In the table below, the red and green colors are based on the historical breakout direction for the associated chart pattern. If a high and tight flag appears, the start and end dates highlight the flagpole only and not the flag.
For details about the chart patterns, click here.
-- Thomas Bulkowski, author: Invest for Two-Comma Wealth and the novel (fiction), Foresight (#Ad)
![]()
| Symbol | Chart Pattern | Bullish Bearish | Start | End | Industry |
| DDD | Flag, high and tight | 12/03/2024 | 02/05/2025 | Electronics | |
| ABT | Ugly double bottom | 01/15/2025 | 02/04/2025 | Medical Supplies | |
| ALRM | Double Bottom, Eve and Adam | 01/13/2025 | 02/03/2025 | Computer Software and Svcs | |
| ALGT | Triple top | 01/21/2025 | 01/31/2025 | Air Transport | |
| ALL | Pipe bottom | 01/06/2025 | 01/13/2025 | Insurance (Prop/Casualty) | |
| AFG | Double Top, Adam and Eve | 01/17/2025 | 01/28/2025 | Insurance (Prop/Casualty) | |
| APH | Diamond bottom | 12/27/2024 | 02/06/2025 | Electronics | |
| ADM | Double Top, Adam and Eve | 01/13/2025 | 01/27/2025 | Food Processing | |
| BCPC | Double Bottom, Adam and Adam | 01/13/2025 | 02/03/2025 | Chemical (Specialty) | |
| BALL | Pipe bottom | 01/06/2025 | 01/13/2025 | Packaging and Container | |
| BZH | Dead-cat bounce | 01/31/2025 | 01/31/2025 | Homebuilding | |
| BCO | Broadening top, right-angled and ascending | 12/20/2024 | 02/03/2025 | Industrial Services | |
| BG | Pipe top | 01/06/2025 | 01/13/2025 | Food Processing | |
| CNC | Double Top, Eve and Adam | 01/27/2025 | 02/03/2025 | Medical Services | |
| CHD | Head-and-shoulders bottom | 12/23/2024 | 01/23/2025 | Household Products | |
| CTAS | Triangle, ascending | 01/27/2025 | 02/05/2025 | Industrial Services | |
| CLF | Ugly double bottom | 12/30/2024 | 01/23/2025 | Metals and Mining (Div.) | |
| CRH | Ugly double bottom | 01/13/2025 | 02/03/2025 | Cement and Aggregates | |
| CMI | Double Bottom, Adam and Adam | 01/27/2025 | 02/03/2025 | Machinery | |
| DECK | Dead-cat bounce | 01/31/2025 | 01/31/2025 | Shoe | |
| DDS | Pipe bottom | 12/09/2024 | 12/16/2024 | Retail Store | |
| BOOM | Head-and-shoulders bottom | 11/21/2024 | 01/22/2025 | Metal Fabricating | |
| EL | Double Top, Adam and Eve | 12/09/2024 | 01/27/2025 | Toiletries/Cosmetics | |
| EG | Double Top, Adam and Adam | 01/07/2025 | 01/27/2025 | Insurance (Prop/Casualty) | |
| FDX | Triple top | 12/31/2024 | 01/27/2025 | Air Transport | |
| FIS | Head-and-shoulders bottom | 12/20/2024 | 02/03/2025 | Computer Software and Svcs | |
| FMC | Dead-cat bounce | 02/05/2025 | 02/05/2025 | Chemical (Basic) | |
| FORM | Dead-cat bounce | 02/06/2025 | 02/06/2025 | Semiconductor | |
| THG | Pipe bottom | 01/06/2025 | 01/13/2025 | Insurance (Prop/Casualty) | |
| HE | Pipe bottom | 01/06/2025 | 01/13/2025 | Electric Utility (West) | |
| HNI | Double Top, Adam and Adam | 01/21/2025 | 01/27/2025 | Furn/Home Furnishings | |
| HURC | Ugly double bottom | 01/10/2025 | 01/28/2025 | Machinery | |
| ITW | Head-and-shoulders top | 01/21/2025 | 01/31/2025 | Metal Fabricating | |
| NSP | Double Top, Eve and Eve | 01/21/2025 | 01/28/2025 | Human Resources | |
| TILE | Pipe bottom | 01/06/2025 | 01/13/2025 | Furn/Home Furnishings | |
| IPI | Double Top, Adam and Adam | 01/22/2025 | 02/03/2025 | Chemical (Diversified) | |
| IRM | Double Bottom, Adam and Adam | 01/28/2025 | 02/03/2025 | Industrial Services | |
| KMT | Head-and-shoulders top | 01/06/2025 | 01/30/2025 | Metal Fabricating | |
| LANC | Double Bottom, Eve and Adam | 01/08/2025 | 02/03/2025 | Food Processing | |
| LLY | Double Bottom, Adam and Eve | 11/18/2024 | 01/17/2025 | Drug | |
| MHO | Double Top, Eve and Adam | 01/21/2025 | 01/27/2025 | Homebuilding | |
| NOV | Double Bottom, Eve and Eve | 12/23/2024 | 02/04/2025 | Oilfield Svcs/Equipment | |
| NEU | Double Bottom, Eve and Adam | 01/13/2025 | 02/03/2025 | Chemical (Specialty) | |
| NWPX | Ugly double bottom | 01/10/2025 | 01/31/2025 | Building Materials | |
| NVDA | Double Top, Adam and Eve | 01/07/2025 | 01/24/2025 | Semiconductor | |
| OMI | Horn top | 01/13/2025 | 01/27/2025 | Medical Supplies | |
| OXM | Head-and-shoulders top | 12/16/2024 | 01/30/2025 | Apparel | |
| PYPL | Double Top, Adam and Adam | 12/09/2024 | 01/17/2025 | Financial Services | |
| PETS | Double Bottom, Eve and Adam | 01/02/2025 | 01/28/2025 | Medical Services | |
| PGR | Head-and-shoulders complex bottom | 12/20/2024 | 01/29/2025 | Insurance (Prop/Casualty) | |
| PHM | Double Top, Adam and Adam | 01/21/2025 | 01/30/2025 | Homebuilding | |
| SXI | Double Bottom, Adam and Adam | 01/13/2025 | 02/03/2025 | Diversified Co. | |
| SSYS | Ugly double bottom | 01/13/2025 | 01/31/2025 | Electronics | |
| TDOC | Pipe bottom | 01/13/2025 | 01/21/2025 | Healthcare Information | |
| TDC | Triangle, symmetrical | 11/04/2024 | 02/06/2025 | Computer Software and Svcs | |
| TEVA | Double Top, Eve and Eve | 12/27/2024 | 01/28/2025 | Drug | |
| TXN | Double Top, Adam and Adam | 01/15/2025 | 01/23/2025 | Semiconductor | |
| TTD | Triple top | 01/06/2025 | 01/30/2025 | Advertising | |
| TDG | Double Top, Adam and Eve | 01/23/2025 | 01/31/2025 | Aerospace/Defense | |
| UNH | Ugly double bottom | 12/17/2024 | 01/17/2025 | Medical Services | |
| VEEV | Double Bottom, Eve and Adam | 12/31/2024 | 01/14/2025 | Healthcare Information | |
| MDRX | Dead-cat bounce | 01/31/2025 | 01/31/2025 | Healthcare Information | |
| WRB | Head-and-shoulders bottom | 12/20/2024 | 01/24/2025 | Insurance (Prop/Casualty) | |
| WEX | Dead-cat bounce | 02/06/2025 | 02/06/2025 | Information Services | |
| WWD | Double Bottom, Adam and Eve | 01/27/2025 | 02/04/2025 | Precision Instrument | |
| WDAY | Pipe bottom | 11/25/2024 | 12/02/2024 | Computer Software and Svcs |
![]()
$ $ $
I show a picture of the Nasdaq composite on the 5-minute scale.
I drew a trendline under price action, beginning from the left to the right so that it skimmed most, but not all, valleys and peaks.
The line shows that recent price action is hovering just below the line.
Trend lines are indications of resistance. That means price may struggle to pierce that resistance. Resistance isn't a single price, but often a range or area of prices. Sometimes the stock will rise just above resistance or fall short of it (as in this case).
Often, once the index has cleared (risen above) the resistance, it soars and the line then acts as support should the index drop and return to (or near) the line. You can see this behaviour where the valleys to the left of Monday's gap found support at the red line and recently the line has acted as resistance to the upward move.
What does this mean for upcoming price movement? Hard to tell. Intraday movement isn't as easy to predict as daily or weekly movement. The struggle to pierce the line will see the index climb above the line...eventually.
It could happen tomorrow (Thursday) or it could take several more days, but I'm confident it will happen.
$ $ $
Here's a symbol list of 143 chart and candlestick patterns (13 "investment grade" candle patterns) found in today's securities using my version of Patternz: DDD, ADTN, AMD, AES, ATSG, AKAM, ALB, ALKS, ALGT, AEE, AEP, ANIK, ADM, ARW, AVA, AXS, BERY, BIO, BMRN, BKH, BAH, BCO, BLDR, CPB, CDAY, CLNE, CLX, CNX, CMTL, GLW, CCRN, CCK, DDS, DFS, DSGR, ^DJU, DOV, DTE, BOOM, EMR, EL, FISV, FIVN, FMC, FTNT, FNV, GME, GAP, HLIT, HTLD, HP, HSIC, HOV, JBHT, HURC, IEX, NSP, IIIN, ITGR, JNJ, KBH, KMT, LZB, LEG, LLY, MAN, MKTX, MTRN, MRCY, NBR, NOV, NEE, NI, JWN, NTNX, OMI, PKE, PATK, PTEN, PEN, PRU, QTWO, QCOM, DGX, RRC, RJF, REGN, RLI, ROP, RGLD, RES, SAND, SAIC, SIGI, SRE, STR, SPSC, SCS, SSYS, TRGP, TECH, TDC, TXT, TOL, TSCO, TZOO, TG, UNM, VRSN, VRTX, WPM, WSC, IYK, IHE, IDU, IEV, ITB, EWQ, EWG, EWH, EIS, EWM, EWY, EWP, EWL, THD, TUR, EWU, PJP, XLP, GLD, XLU, VHT. Click this link for details (pattern type, start and end dates).
For a list of small patterns (those a few days wide) click this link.
$ $ $
The following table shows where Fibonacci retrace values of the day's high-low range are plus pivot points, calculated on the Nasdaq composite, sorted by value. When several are near each other (small differences), the area might act as support or resistance.
-- Thomas Bulkowski
![]()
| © 2025 ThePatternSite.com Metric | Value | Diff | Close (within 10% of the high-low range for the day)? |
| Monthly S2 | 18,260.92 | ||
| Weekly S2 | 18,857.93 | 597.01 | |
| Monthly S1 | 18,976.62 | 118.69 | |
| Weekly S1 | 19,275.13 | 298.51 | |
| Daily S2 | 19,431.35 | 156.22 | |
| Low | 19,498.90 | 67.55 | |
| Open | 19,533.05 | 34.15 | |
| Monthly Pivot | 19,547.62 | 14.57 | Yes! The Monthly Pivot is close to the Open. |
| Daily S1 | 19,561.84 | 14.22 | Yes! The Daily S1 is close to the Monthly Pivot. |
| 61.8% Down from Intraday High | 19,574.55 | 12.71 | Yes! The 61.8% Down from Intraday High is close to the Daily S1. |
| 50% Down from Intraday High | 19,597.92 | 23.37 | |
| 38.2% Down from Intraday High | 19,621.29 | 23.37 | |
| Weekly Pivot | 19,622.15 | 0.86 | Yes! The Weekly Pivot is close to the 38.2% Down from Intraday High. |
| Daily Pivot | 19,629.39 | 7.24 | Yes! The Daily Pivot is close to the Weekly Pivot. |
| Close | 19,692.33 | 62.94 | |
| High | 19,696.94 | 4.61 | Yes! The High is close to the Close. |
| Daily R1 | 19,759.88 | 62.94 | |
| Daily R2 | 19,827.43 | 67.55 | |
| Weekly R1 | 20,039.35 | 211.92 | |
| Monthly R1 | 20,263.32 | 223.97 | |
| Weekly R2 | 20,386.37 | 123.04 | |
| Monthly R2 | 20,834.32 | 447.95 |
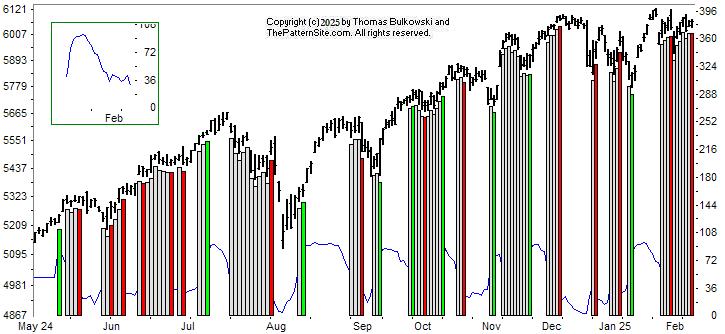
This is a picture of the chart pattern indicator on the daily scale. The indicator is the line chart below a chart of the S&P 500 composite.
The CPI sits at 45, which is neutral. The chart reflects this by the vertical white bar on the far right of the chart.
The inset on the upper left of the chart shows the CPI dropping for about 2 weeks now, and then bouncing off the bottom. That changed a bearish signal to neutral. If the uptrend continues, look for a bullish reading.
Will it get there? Probably, but it could depend on politics and what damage the leaders do, or intend to do, to our economy.
$ $ $
Here's a symbol list of 130 chart and candlestick patterns (13 "investment grade" candle patterns) found in today's securities using my version of Patternz: DDD, AYI, ADTN, AEIS, A, AKAM, AA, AEP, APA, ADM, ADSK, BALL, BAX, BFH, BRKR, BBW, CAL, CPB, CE, CX, CNC, CDAY, CF, CVX, CLNE, CLX, CNX, GLW, COTY, CRH, CROX, CCK, CTS, DDS, EL, EXPI, FICO, FARO, FISV, FIVN, FLEX, FMC, GAP, GPRO, HTLD, HP, HUBG, ITW, ISRG, KMT, KFRC, LHX, LLY, LXU, M, MGY, MANH, MTRN, MTRX, MLI, NOV, NEU, JWN, NWPX, ON, OR, OMI, PANW, PKE, PTEN, PYPL, PPG, PINC, KWR, QCOM, DGX, RL, RJF, RCKY, ROP, SAND, SLB, STR, SXI, SSYS, TRGP, TDOC, TTD, TSCO, RIG, VRSN, VRTX, VC, WPM, WSC, IYE, IHE, FTEC, QTEC, IAT, IGV, IXN, SLV, IGE, EWA, EWO, EWS, EWT, THD, PXJ, SSO, XLE, XLV, XLB, XRT, VHT, MGK. Click this link for details (pattern type, start and end dates).
For a list of small patterns (those a few days wide) click this link.
-- Thomas Bulkowski
![]()
$ $ $
Here's the updated 2025 market forecast, presented in slider format.
$ $ $
Here's a symbol list of 217 chart and candlestick patterns (13 "investment grade" candle patterns) found in today's securities using my version of Patternz: ABT, ANF, ACIW, AEIS, AMD, AES, APD, AKAM, ALB, AA, ALGT, ALL, AEO, AEP, APH, AON, APA, APOG, ATR, ASH, AVY, BZH, BERY, BMRN, BKH, BMY, BBW, CAL, CE, CX, CDAY, CF, CLF, CTSH, CXW, COTY, CMI, DHR, DECK, DSGR, ^DJT, ^DJI, D, DUK, EXP, EVRG, EVH, FDX, FLEX, FMC, FWRD, FNV, FDP, FRD, GME, IT, GNW, GPN, GS, GPRO, HLIT, HTLD, HELE, HP, HWM, HUN, IDXX, INTC, IBKR, JAZZ, KALU, KBH, KELYA, KFRC, KSS, LEN, LLY, LOW, MHO, M, MGY, MANH, MRTN, MA, MRK, META, MGEE, MLKN, MOS, NFG, NOV, NWPX, NUS, NVDA, OXY, OLN, OMCL, ON, OR, OMI, PANW, PKE, PTEN, PCTY, PFE, PLXS, PPG, PG, PRU, QTWO, QCOM, DGX, RL, RJF, RTX, RGS, RNG, ROK, ROG, ROP, ^GSPC, SAIA, SAND, SLB, SEE, SCI, SHW, SLGN, SR, SPSC, SXI, SSYS, TRGP, TGT, TDOC, TPX, TDC, TXT, TTD, TZOO, UGI, UIS, UPS, UNH, VRSN, WRB, WMT, WU, WLK, WEX, WPM, WSC, WWW, ZBRA, IYE, IHE, IDU, DDM, FTEC, BOTZ, IHF, IXN, IEO, EWC, EEM, EWH, EWW, EPP, EWS, EWY, EWT, THD, TUR, PEJ, PXJ, PJP, SSO, XLY, XLP, XLE, XLF, XLV, SPY, XLK, VHT, MGK, VONG. Click this link for details (pattern type, start and end dates).
For a list of small patterns (those a few days wide) click this link.
$ $ $
The following table shows where Fibonacci retrace values of the day's high-low range are plus pivot points, calculated on the Dow industrials, sorted by value. When several are near each other (small differences), the area might act as support or resistance.
-- Thomas Bulkowski
![]()
| © 2025 ThePatternSite.com Metric | Value | Diff | Close (within 10% of the high-low range for the day)? |
| Monthly S2 | 40,564.25 | ||
| Monthly S1 | 42,493.08 | 1,928.83 | |
| Weekly S2 | 43,472.76 | 979.68 | |
| Daily S2 | 43,583.02 | 110.27 | |
| Monthly Pivot | 43,773.72 | 190.70 | |
| Low | 43,879.06 | 105.34 | |
| Weekly S1 | 43,947.33 | 68.27 | Yes! The Weekly S1 is close to the Low. |
| Daily S1 | 44,002.46 | 55.13 | Yes! The Daily S1 is close to the Weekly S1. |
| 61.8% Down from Intraday High | 44,152.38 | 149.91 | |
| 50% Down from Intraday High | 44,236.80 | 84.43 | |
| Open | 44,268.15 | 31.35 | Yes! The Open is close to the 50% Down from Intraday High. |
| Daily Pivot | 44,298.50 | 30.36 | Yes! The Daily Pivot is close to the Open. |
| 38.2% Down from Intraday High | 44,321.23 | 22.72 | Yes! The 38.2% Down from Intraday High is close to the Daily Pivot. |
| Close | 44,421.91 | 100.68 | |
| Weekly Pivot | 44,500.85 | 78.94 | |
| High | 44,594.54 | 93.69 | |
| Daily R1 | 44,717.95 | 123.41 | |
| Weekly R1 | 44,975.42 | 257.48 | |
| Daily R2 | 45,013.98 | 38.56 | Yes! The Daily R2 is close to the Weekly R1. |
| Weekly R2 | 45,528.94 | 514.95 | |
| Monthly R1 | 45,702.55 | 173.61 | |
| Monthly R2 | 46,983.19 | 1,280.64 |
$ $ $
Here's the updated 2025 market forecast, presented in slider format.
$ $ $
Here's a symbol list of 217 chart and candlestick patterns (13 "investment grade" candle patterns) found in today's securities using my version of Patternz: ABT, ANF, ACIW, AEIS, AMD, AES, APD, AKAM, ALB, AA, ALGT, ALL, AEO, AEP, APH, AON, APA, APOG, ATR, ASH, AVY, BZH, BERY, BMRN, BKH, BMY, BBW, CAL, CE, CX, CDAY, CF, CLF, CTSH, CXW, COTY, CMI, DHR, DECK, DSGR, ^DJT, ^DJI, D, DUK, EXP, EVRG, EVH, FDX, FLEX, FMC, FWRD, FNV, FDP, FRD, GME, IT, GNW, GPN, GS, GPRO, HLIT, HTLD, HELE, HP, HWM, HUN, IDXX, INTC, IBKR, JAZZ, KALU, KBH, KELYA, KFRC, KSS, LEN, LLY, LOW, MHO, M, MGY, MANH, MRTN, MA, MRK, META, MGEE, MLKN, MOS, NFG, NOV, NWPX, NUS, NVDA, OXY, OLN, OMCL, ON, OR, OMI, PANW, PKE, PTEN, PCTY, PFE, PLXS, PPG, PG, PRU, QTWO, QCOM, DGX, RL, RJF, RTX, RGS, RNG, ROK, ROG, ROP, ^GSPC, SAIA, SAND, SLB, SEE, SCI, SHW, SLGN, SR, SPSC, SXI, SSYS, TRGP, TGT, TDOC, TPX, TDC, TXT, TTD, TZOO, UGI, UIS, UPS, UNH, VRSN, WRB, WMT, WU, WLK, WEX, WPM, WSC, WWW, ZBRA, IYE, IHE, IDU, DDM, FTEC, BOTZ, IHF, IXN, IEO, EWC, EEM, EWH, EWW, EPP, EWS, EWY, EWT, THD, TUR, PEJ, PXJ, PJP, SSO, XLY, XLP, XLE, XLF, XLV, SPY, XLK, VHT, MGK, VONG. Click this link for details (pattern type, start and end dates).
For a list of small patterns (those a few days wide) click this link.
$ $ $
The following table shows where Fibonacci retrace values of the day's high-low range are plus pivot points, calculated on the Dow industrials, sorted by value. When several are near each other (small differences), the area might act as support or resistance.
-- Thomas Bulkowski
![]()
| © 2025 ThePatternSite.com Metric | Value | Diff | Close (within 10% of the high-low range for the day)? |
| Monthly S2 | 40,564.25 | ||
| Monthly S1 | 42,493.08 | 1,928.83 | |
| Weekly S2 | 43,472.76 | 979.68 | |
| Daily S2 | 43,583.02 | 110.27 | |
| Monthly Pivot | 43,773.72 | 190.70 | |
| Low | 43,879.06 | 105.34 | |
| Weekly S1 | 43,947.33 | 68.27 | Yes! The Weekly S1 is close to the Low. |
| Daily S1 | 44,002.46 | 55.13 | Yes! The Daily S1 is close to the Weekly S1. |
| 61.8% Down from Intraday High | 44,152.38 | 149.91 | |
| 50% Down from Intraday High | 44,236.80 | 84.43 | |
| Open | 44,268.15 | 31.35 | Yes! The Open is close to the 50% Down from Intraday High. |
| Daily Pivot | 44,298.50 | 30.36 | Yes! The Daily Pivot is close to the Open. |
| 38.2% Down from Intraday High | 44,321.23 | 22.72 | Yes! The 38.2% Down from Intraday High is close to the Daily Pivot. |
| Close | 44,421.91 | 100.68 | |
| Weekly Pivot | 44,500.85 | 78.94 | |
| High | 44,594.54 | 93.69 | |
| Daily R1 | 44,717.95 | 123.41 | |
| Weekly R1 | 44,975.42 | 257.48 | |
| Daily R2 | 45,013.98 | 38.56 | Yes! The Daily R2 is close to the Weekly R1. |
| Weekly R2 | 45,528.94 | 514.95 | |
| Monthly R1 | 45,702.55 | 173.61 | |
| Monthly R2 | 46,983.19 | 1,280.64 |
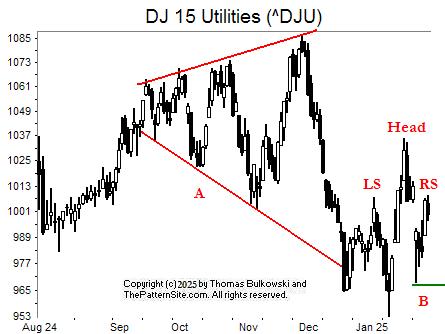
At A, we see a nicely shaped broadening top chart pattern. I extended the bottom line to see how it matched recent price action.
A broadening top breaks out downward 40% of the time, which is what happened here at the lower end of the red trendline.
After that, the index bobbled up and down, eventually forming a potential head-and-shoulders top. I've identified the left shoulder (LS) and right one (RS). The index has to drop to B and close below the green line to signal a downward breakout. A breakout would confirm the pattern as valid. Otherwise, it's just squiggles on the price chart.
The picture is bearish and with Trump threatening action (tariffs) against our allies, it'll be bad for the US and bad for the markets.
![]()
The following is a brief review of how the markets performed over time. The numbers refer to the close-to-close move in the Dow industrials.
No options expire this week.
![]()
The following is based on an SFO article in December 2004 by John Seekinger, titled, "Take a two-dimensional approach." He offers these tips.
| Index | S2 | S1 | Pivot | R1 | R2 |
| Dow Industrials (^DJI): Daily | 44,155 | 44,350 | 44,702 | 44,897 | 45,249 |
| Weekly | 43,514 | 44,029 | 44,542 | 45,057 | 45,570 |
| Monthly | 40,605 | 42,575 | 43,815 | 45,784 | 47,024 |
| S&P500 (^GSPC): Daily | 5,974 | 6,007 | 6,064 | 6,097 | 6,154 |
| Weekly | 5,883 | 5,962 | 6,041 | 6,120 | 6,199 |
| Monthly | 5,626 | 5,833 | 5,981 | 6,188 | 6,336 |
| Nasdaq (^IXIC): Daily | 19,329 | 19,477 | 19,723 | 19,871 | 20,117 |
| Weekly | 18,835 | 19,230 | 19,600 | 19,994 | 20,364 |
| Monthly | 18,238 | 18,931 | 19,525 | 20,218 | 20,812 |
Here are the formulas:
![]()
Earnings season is either underway or should be starting soon. The sessions could be more volatile.
Here's a symbol list of 160 chart and candlestick patterns (13 "investment grade" candle patterns) found in today's securities using my version of Patternz: ACIW, ADBE, AEIS, AMD, AKAM, ALB, AA, ALGT, ALL, AEO, AEP, AMGN, APH, AR, APOG, AAPL, BMI, BCPC, BAX, BZH, BMRN, BBW, CF, CVX, CLNE, CLF, CL, CMTL, CCRN, CSGS, CMI, DECK, XRAY, ^DJT, ^DJI, DOV, DUK, BOOM, XOM, EZPW, FDX, FLEX, FTNT, FWRD, FRD, GMS, GS, GOOGL, GPRO, GFF, THG, HIG, HP, HWM, HUBG, INCY, IBP, INTC, JAZZ, KALU, K, KELYA, KSS, LANC, LLY, M, MGY, MSFT, MUR, NOV, NWPX, NUS, OXY, OLN, OMCL, ASGN, OR, PANW, PDCO, PTEN, PYPL, PETS, PFE, PPG, PGR, QTWO, QCOM, DGX, RJF, RNG, RHI, ROP, ^GSPC, SAND, SLB, SEIC, SCI, SHW, SKYW, TRGP, TDOC, TDC, TXT, TTD, UPS, VLO, MDRX, VRTX, WU, WEX, WPM, WMB, WSM, IYE, IEZ, IHE, DDM, FTEC, BOTZ, IXN, SLV, IGE, IEO, ITB, EWC, EEM, EWH, EWM, EPP, EWS, EWP, EWT, THD, PEJ, PXJ, PJP, SSO, XLE, XLF, XLV, SPY, XLK, VHT, MGK, VONG. Click this link for details (pattern type, start and end dates).
For a list of small patterns (those a few days wide) click this link.
The below industries were the best (rank 1) or worst performing of those I follow.
|
-- Thomas Bulkowski
![]()
Support this site! Clicking any of the books (below) takes you to
Amazon.com If you buy ANYTHING while there, they pay for the referral.
Legal notice for paid links: "As an Amazon Associate I earn from qualifying purchases."
|
My Stock Market Books
|
My Novels
Orb Foresight Rewrite Coming!
|