
As of 04/17/2026
Indus: 49,447 +868.71 +1.8%
Trans: 22,422 +609.39 +2.8%
Utils: 1,158 -6.73 -0.6%
Nasdaq: 24,468 +365.78 +1.5%
S&P 500: 7,126 +84.78 +1.2%
|
YTD
+2.9%
+29.2%
+8.4%
+5.3%
+4.1%
|
|
As of 04/17/2026
Indus: 49,447 +868.71 +1.8%
Trans: 22,422 +609.39 +2.8%
Utils: 1,158 -6.73 -0.6%
Nasdaq: 24,468 +365.78 +1.5%
S&P 500: 7,126 +84.78 +1.2%
|
YTD
+2.9%
+29.2%
+8.4%
+5.3%
+4.1%
| |
|
| ||
Here's a symbol list of 137 chart and candlestick patterns (13 "investment grade" candle patterns) found in today's securities using my version of Patternz: AEIS, A, APD, ATSG, ALB, AA, ALKS, AEO, AEP, APA, AMAT, ARW, BSET, BAX, BRC, BBW, CBT, CLS, CF, CHKP, CLNE, CNX, CTSH, COST, CRH, DHR, XRAY, ^DJI, DOV, EOG, EZPW, FLEX, FTNT, FNV, IT, GPN, THG, HL, HELE, HP, HNI, IBKR, IPG, KELYA, KMT, LH, LRCX, LANC, LLY, LOW, M, MGY, MANH, MCHX, MA, MTDR, MCO, MUR, NFG, NWPX, OXY, OGE, ASGN, OR, PATK, PTEN, DGX, RL, REGN, ROP, RES, SLB, SEIC, SIGI, SCI, SHW, SHOP, STR, SKX, TRGP, TDOC, TDY, TER, TEVA, TTD, TMO, TKR, UNM, VLO, V, WAT, IAI, IYE, IHE, DDM, FTEC, ICF, IEV, IXN, ILF, SLV, EWO, EWK, ECH, EWJ, EPP, EWS, EZA, EWP, EWL, EWT, EWU, QLD, PPA, PEJ, PXJ, XLE, GLD, XLV, XHB, XLI, XRT, VHT. Click this link for details (pattern type, start and end dates).
For a list of small patterns (those a few days wide) click this link.
$ $ $
You can find setups based on a Fibonacci retrace by clicking on the link.
The following patterns were found manually, not using Patternz. Mr. Bulkowski has excluded any securities he owns from appearing in the list. However, he may add any of the securities listed to his portfolio at any time, just as you can.
In the table below, the red and green colors are based on the historical breakout direction for the associated chart pattern. If a high and tight flag appears, the start and end dates highlight the flagpole only and not the flag.
For details about the chart patterns, click here.
-- Thomas Bulkowski, author: Invest for Two-Comma Wealth and the novel (fiction), Foresight (#Ad)
![]()
| Symbol | Chart Pattern | Bullish Bearish | Start | End | Industry |
| ACN | Double Bottom, Adam and Eve | 01/02/2025 | 01/13/2025 | IT Services | |
| AEIS | Horn top | 01/06/2025 | 01/21/2025 | Semiconductor | |
| AA | Pipe top | 01/13/2025 | 01/21/2025 | Aerospace/Defense | |
| ANET | Dead-cat bounce | 01/27/2025 | 01/27/2025 | E-Commerce | |
| ASH | Double Top, Eve and Eve | 01/02/2025 | 01/21/2025 | Chemical (Basic) | |
| AIZ | Head-and-shoulders bottom | 12/18/2024 | 01/22/2025 | Insurance (Diversified) | |
| AGO | Pipe bottom | 01/06/2025 | 01/13/2025 | Insurance (Life) | |
| ADP | Double Bottom, Adam and Adam | 01/06/2025 | 01/13/2025 | IT Services | |
| AXS | Head-and-shoulders bottom | 12/20/2024 | 01/24/2025 | Insurance (Prop/Casualty) | |
| BBW | Pipe bottom | 01/13/2025 | 01/21/2025 | Retail (Special Lines) | |
| CLS | Dead-cat bounce | 01/27/2025 | 01/27/2025 | Electronics | |
| CDAY | Double Bottom, Eve and Eve | 01/10/2025 | 01/21/2025 | Information Services | |
| CIEN | Dead-cat bounce | 01/27/2025 | 01/27/2025 | Telecom. Equipment | |
| CLNE | Ugly double bottom | 12/30/2024 | 01/13/2025 | Natural Gas (Distributor) | |
| CNA | Pipe bottom | 01/06/2025 | 01/13/2025 | Insurance (Prop/Casualty) | |
| CXW | Double Top, Adam and Eve | 12/10/2024 | 01/21/2025 | Industrial Services | |
| EXP | Pipe bottom | 01/06/2025 | 01/13/2025 | Cement and Aggregates | |
| GNW | Pipe bottom | 01/06/2025 | 01/13/2025 | Insurance (Life) | |
| GOOGL | Triangle, ascending | 12/17/2024 | 01/30/2025 | Internet | |
| HP | Pipe top | 01/13/2025 | 01/21/2025 | Petroleum (Producing) | |
| HSIC | Head-and-shoulders bottom | 12/20/2024 | 01/13/2025 | Medical Supplies | |
| IPG | Pipe bottom | 01/06/2025 | 01/13/2025 | Advertising | |
| JKHY | Double Bottom, Adam and Adam | 01/06/2025 | 01/14/2025 | IT Services | |
| JBLU | Dead-cat bounce | 01/28/2025 | 01/28/2025 | Air Transport | |
| LHX | Double Top, Adam and Adam | 01/21/2025 | 01/27/2025 | Aerospace/Defense | |
| LNC | Pipe bottom | 01/06/2025 | 01/13/2025 | Insurance (Life) | |
| MGY | Pipe top | 01/13/2025 | 01/21/2025 | Petroleum (Producing) | |
| MANH | Dead-cat bounce | 01/29/2025 | 01/29/2025 | IT Services | |
| MAN | Pipe bottom | 01/06/2025 | 01/13/2025 | Human Resources | |
| MUR | Pipe top | 01/06/2025 | 01/13/2025 | Petroleum (Integrated) | |
| OMC | Pipe bottom | 01/06/2025 | 01/13/2025 | Advertising | |
| OTEX | Pipe bottom | 01/06/2025 | 01/13/2025 | E-Commerce | |
| PKE | Pipe bottom | 01/06/2025 | 01/13/2025 | Chemical (Specialty) | |
| PTEN | Pipe top | 01/13/2025 | 01/21/2025 | Oilfield Svcs/Equipment | |
| PCTY | Head-and-shoulders bottom | 01/02/2025 | 01/22/2025 | E-Commerce | |
| PLXS | Triple top | 11/06/2024 | 01/22/2025 | Electronics | |
| PRU | Double Bottom, Eve and Adam | 12/18/2024 | 01/13/2025 | Insurance (Life) | |
| KWR | Pipe bottom | 01/06/2025 | 01/13/2025 | Chemical (Specialty) | |
| DGX | Triple bottom | 12/19/2024 | 01/16/2025 | Medical Services | |
| SMTC | Dead-cat bounce | 01/27/2025 | 01/27/2025 | Semiconductor Cap Equip. | |
| SLGN | Head-and-shoulders bottom | 12/23/2024 | 01/23/2025 | Packaging and Container | |
| STR | Pipe top | 01/13/2025 | 01/21/2025 | Natural Gas (Diversified) | |
| SSYS | Horn bottom | 12/30/2024 | 01/13/2025 | Electronics | |
| TKR | Ugly double bottom | 01/03/2025 | 01/27/2025 | Metal Fabricating | |
| TZOO | Triangle, descending | 12/09/2024 | 01/30/2025 | Internet | |
| TREX | Pipe bottom | 01/06/2025 | 01/13/2025 | Building Materials | |
| UHAL | Double Bottom, Adam and Adam | 12/20/2024 | 01/13/2025 | Trucking/Transp. Leasing | |
| UNM | Head-and-shoulders bottom | 12/11/2024 | 12/30/2024 | Insurance (Diversified) | |
| WWW | Broadening bottom | 12/26/2024 | 01/22/2025 | Shoe |
![]()
$ $ $
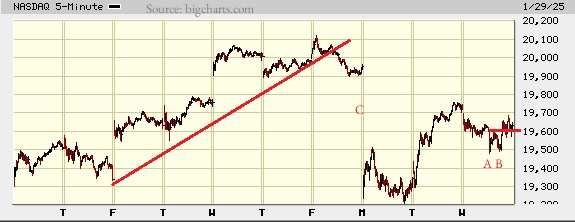
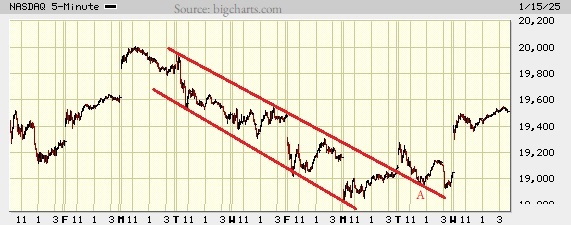
I show a picture of the Nasdaq composite on the 5-minute scale.
I don't have a lot to say about the picture. At AB, there's a small chart pattern called a double bottom. That's a pattern where the two valleys bottom near the same price. The shape of them (Adam or Eve bottoms) determine the type of pattern. This one looks to be an Adam & Eve.
The pattern confirms as valid when price closes above the peak between bottoms A and B. I show confirmation as the horizontal red line. The index has waffled sideways since then.
The diagonal red line is a line of trend. On Friday, the index pierced that line, heading lower. On Monday, on fears the US was losing its edge in AI (artificial intelligence), the Nasdaq gapped open significantly lower.
It's been working to close the gap since. Often these types of tall gaps are exhaustion gaps, which usually close quickly. I believe the Nasdaq will continue to rise in the coming weeks, but it may depend on political events.
However, yesterday's CPI (chart pattern indicator) was 62.5 and today it's 37, just within the 35 to 65 neutral zone. We could see the index move lower for a few days. So that's lower for a few days but higher after that.
$ $ $
3-Bar: New small pattern released. Performance isn't that great. This is a pattern someone visiting the website and using Patternz asked me about years ago. Sorry for the delay. Patternz finds the pattern, by the way.
$ $ $
Here's a symbol list of 108 chart and candlestick patterns (13 "investment grade" candle patterns) found in today's securities using my version of Patternz: AEIS, ATSG, ALK, AA, ALKS, AEO, AEP, AMWD, ATR, AWI, BAX, BIIB, BAH, BRC, BRKR, BBW, BG, COR, CF, CRL, CHKP, CLF, CMCO, GLW, CSGP, COST, CROX, DECK, DDS, EXP, EBAY, EMR, EVRG, FFIV, FLEX, GD, HP, HSIC, HSY, INCY, IIIN, TILE, KSS, LZB, LEN, LLY, LMT, LXU, M, MGY, MANH, MCHX, MRTN, MRCY, META, NWPX, NUS, OXY, ORCL, OR, OMI, PANW, PDCO, PTEN, PCTY, RJF, SLB, SCI, SLGN, SKX, SPSC, SSYS, TRGP, TDOC, TPX, TEVA, UGI, UIS, UPS, UNM, VFC, WSO, WU, WEX, WWW, IYE, FTEC, IXN, EWH, EWS, EWT, TUR, QLD, DBA, PEJ, PXJ, XLE, XLV, XLB, VHT, VAW. Click this link for details (pattern type, start and end dates).
For a list of small patterns (those a few days wide) click this link.
$ $ $
The following table shows where Fibonacci retrace values of the day's high-low range are plus pivot points, calculated on the Nasdaq composite, sorted by value. When several are near each other (small differences), the area might act as support or resistance.
-- Thomas Bulkowski
![]()
| © 2025 ThePatternSite.com Metric | Value | Diff | Close (within 10% of the high-low range for the day)? |
| Monthly S2 | 18,240.91 | ||
| Monthly S1 | 18,936.62 | 695.70 | |
| Weekly S2 | 19,199.93 | 263.31 | |
| Daily S2 | 19,383.57 | 183.65 | |
| Weekly S1 | 19,416.12 | 32.55 | |
| Low | 19,479.51 | 63.39 | |
| Daily S1 | 19,507.95 | 28.44 | |
| Monthly Pivot | 19,527.61 | 19.67 | Yes! The Monthly Pivot is close to the Daily S1. |
| 61.8% Down from Intraday High | 19,563.67 | 36.05 | |
| 50% Down from Intraday High | 19,589.66 | 26.00 | |
| Daily Pivot | 19,603.88 | 14.22 | Yes! The Daily Pivot is close to the 50% Down from Intraday High. |
| 38.2% Down from Intraday High | 19,615.66 | 11.78 | Yes! The 38.2% Down from Intraday High is close to the Daily Pivot. |
| Close | 19,632.32 | 16.66 | Yes! The Close is close to the 38.2% Down from Intraday High. |
| Open | 19,695.68 | 63.36 | |
| High | 19,699.82 | 4.14 | Yes! The High is close to the Open. |
| Daily R1 | 19,728.26 | 28.44 | |
| Weekly Pivot | 19,767.37 | 39.11 | |
| Daily R2 | 19,824.19 | 56.83 | |
| Weekly R1 | 19,983.56 | 159.37 | |
| Monthly R1 | 20,223.32 | 239.75 | |
| Weekly R2 | 20,334.81 | 111.49 | |
| Monthly R2 | 20,814.31 | 479.51 |
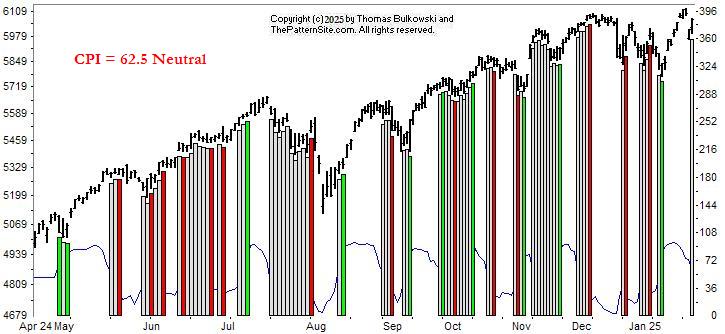
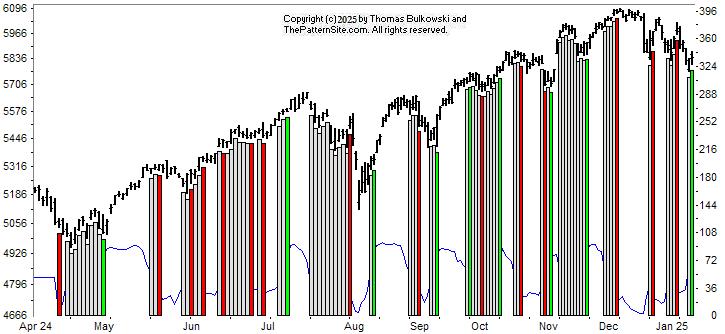
This is a picture of the chart pattern indicator on the daily scale. The indicator is the line chart below a chart of the S&P 500 composite.
The most recent signal of the CPI is neutral. The white bar on the far right of the chart shows this with a reading of 62.5.
The thin blue line near the bottom of the chart shows that the CPI has been trending down for more than a week, nicely predicting a peak in the index. Today's recovery in tech stocks did not push the CPI upward, at least not that I recall. That suggests the majority of the market is weak. You might not see it yet, but perhaps you'll see it in the Dow stocks shortly.
Why? The Dow industrials have been moving higher for about 3 weeks now, so it's time for them to rest. They've reached the level of a prior peak, so I'm expecting a retrace in the coming two weeks. You can see that behaviour in the S&P chart, too. The index made a straight-line run up, reached the height of the prior peak, and retraced.
$ $ $
Here's a symbol list of 155 chart and candlestick patterns (13 "investment grade" candle patterns) found in today's securities using my version of Patternz: AXDX, ACIW, AYI, AEIS, AMD, AKAM, AA, AEP, AMWD, APH, AON, APA, APOG, AMAT, ANET, AWI, BSET, BAX, BZH, BIO, BIIB, BAH, BBW, BG, CX, COR, CF, CVX, COP, CR, CW, EMN, EBAY, ECL, EIX, EME, EVRG, EXC, XOM, FLEX, FORM, FTV, FWRD, FCX, GAP, GD, HP, HSY, HON, HUM, INCY, IBP, IRM, JBLU, KELYA, KEYS, KMB, KSS, KLIC, LZB, LRCX, LDOS, LLY, MHO, M, MRTN, MLM, MTDR, MU, NTAP, NWPX, NUS, NVDA, OXY, OLN, OR, OMI, PKE, PDCO, PTEN, PETS, PEG, RRC, RJF, RGS, RNG, RLI, SAND, SLB, SCHW, SAIC, SEIC, SHOP, SKX, SO, SCCO, SSYS, SRDX, TRGP, TDOC, TDC, TEVA, TKR, UGI, UPS, UNM, VLO, MDRX, XEL, IYM, IYE, IDU, FTEC, FXI, BOTZ, ICF, IXC, IXN, SOXX, IGE, EIS, EWM, EWY, EWT, QLD, PPA, PXJ, PHO, XLE, GLD, XLV, XHB, XLI, XLB, XAR, XLU, UNG, USO, VHT, VIS, VAW. Click this link for details (pattern type, start and end dates).
For a list of small patterns (those a few days wide) click this link.
-- Thomas Bulkowski
![]()
$ $ $
I show another slider trading quiz featuring Valero Energy: VLO stock.
$ $ $
Here's a symbol list of 209 chart and candlestick patterns (13 "investment grade" candle patterns) found in today's securities using my version of Patternz: DDD, ANF, AYI, ADBE, AEIS, ATSG, AKAM, ALRM, AA, ALL, AEE, AEP, AMWD, AMN, APH, AR, APOG, ARCB, ANET, AIZ, AGO, ADP, AVNT, BALL, BAX, BIIB, BFH, BMY, BLDR, BG, CALM, CLS, COR, CNC, CF, CHKP, CHD, CIEN, CLX, CNA, CMCO, COST, CSGS, DHR, XRAY, ^DJU, ^DJT, ^DJI, DOV, BOOM, EXP, EBAY, ECL, ELV, EMR, EFX, EL, EXC, EZPW, FDS, FDX, FLS, FORM, FCX, GNW, GMS, THG, HE, HSY, HNI, HOLX, HON, HUN, IDA, IDXX, IBP, IIIN, ITGR, INTC, IPAR, TILE, IPG, IPI, JNJ, KBH, KELYA, KLIC, LZB, LH, LANC, LNC, L, LOW, MHO, MTSI, MAN, MCHX, MDT, MRK, MU, MCO, MUR, NTGR, NJR, NEE, NKE, NI, NWPX, NTNX, NVDA, OLN, OMC, OTEX, ORCL, PANW, PKE, PATK, PDCO, PG, PRU, PEG, PHM, PSTG, QTWO, KWR, DGX, RRC, RJF, RGS, RNG, RHI, ROP, SAIA, CRM, SIGI, SRE, SMTC, SHW, SO, SXI, SCS, SSYS, TRGP, TDOC, TFX, TER, TTD, TOL, TZOO, TG, TREX, TWLO, UPS, UNH, VMI, VECO, MDRX, WERN, WOLF, XEL, ZBRA, IYK, IYC, IYE, DDM, FTEC, FXI, IYH, IEV, IXC, IXN, ILF, SOXX, IGE, IEO, ITB, EWK, EWS, EWL, IBB, PXJ, XLE, XLV, XHB, XAR, XLK, UNG, SMH, VHT. Click this link for details (pattern type, start and end dates).
For a list of small patterns (those a few days wide) click this link.
$ $ $
The following table shows where Fibonacci retrace values of the day's high-low range are plus pivot points, calculated on the Dow industrials, sorted by value. When several are near each other (small differences), the area might act as support or resistance.
-- Thomas Bulkowski
![]()
| © 2025 ThePatternSite.com Metric | Value | Diff | Close (within 10% of the high-low range for the day)? |
| Monthly S2 | 40,987.54 | ||
| Monthly S1 | 42,850.56 | 1,863.02 | |
| Weekly S2 | 43,232.55 | 382.00 | |
| Monthly Pivot | 43,707.91 | 475.36 | |
| Daily S2 | 43,787.65 | 79.74 | |
| Weekly S1 | 43,973.07 | 185.41 | |
| Low | 44,026.27 | 53.20 | Yes! The Low is close to the Weekly S1. |
| Open | 44,148.84 | 122.57 | |
| Daily S1 | 44,250.62 | 101.78 | |
| Weekly Pivot | 44,269.16 | 18.55 | Yes! The Weekly Pivot is close to the Daily S1. |
| 61.8% Down from Intraday High | 44,294.27 | 25.11 | Yes! The 61.8% Down from Intraday High is close to the Weekly Pivot. |
| 50% Down from Intraday High | 44,377.06 | 82.79 | |
| 38.2% Down from Intraday High | 44,459.85 | 82.79 | |
| Daily Pivot | 44,489.23 | 29.39 | Yes! The Daily Pivot is close to the 38.2% Down from Intraday High. |
| Close | 44,713.58 | 224.34 | |
| High | 44,727.85 | 14.27 | Yes! The High is close to the Close. |
| Daily R1 | 44,952.20 | 224.34 | |
| Weekly R1 | 45,009.68 | 57.48 | Yes! The Weekly R1 is close to the Daily R1. |
| Daily R2 | 45,190.81 | 181.14 | |
| Weekly R2 | 45,305.77 | 114.96 | |
| Monthly R1 | 45,570.93 | 265.16 | |
| Monthly R2 | 46,428.28 | 857.35 |
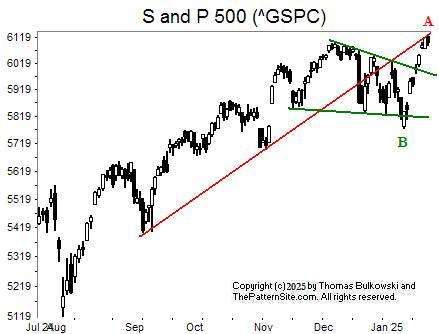
I show the S&P 500 index on the daily chart.
The index followed the red trendline higher. Notice that even though the index punched through the trendline in mid December (going down), it has climbed to meet the line again (A).
Will the index ignore the trendline and continue higher or will the line act as overhead resistance and push the index down?
It's been my experience that the line will impede the index from moving higher, at least for a time.
At B, the index dropped through support at B, but recovered. Drawing the two green lines shows a pattern called a falling wedge. Those breakout upward 68% of the time according to my book, Encyclopedia of Chart Patterns, 3rd Edition (#AD).
In this case, the breakout was downward (B), but it busted the breakout when it soared above the top of the pattern at A. I think it's time for the index to take a rest and retrace.
![]()
The following is a brief review of how the markets performed over time. The numbers refer to the close-to-close move in the Dow industrials.
No options expire this week.
![]()
The following is based on an SFO article in December 2004 by John Seekinger, titled, "Take a two-dimensional approach." He offers these tips.
| Index | S2 | S1 | Pivot | R1 | R2 |
| Dow Industrials (^DJI): Daily | 44,221 | 44,322 | 44,434 | 44,536 | 44,647 |
| Weekly | 43,136 | 43,780 | 44,173 | 44,817 | 45,209 |
| Monthly | 40,891 | 42,658 | 43,611 | 45,378 | 46,332 |
| S&P500 (^GSPC): Daily | 6,067 | 6,084 | 6,106 | 6,123 | 6,145 |
| Weekly | 5,957 | 6,029 | 6,079 | 6,151 | 6,200 |
| Monthly | 5,646 | 5,874 | 6,001 | 6,229 | 6,356 |
| Nasdaq (^IXIC): Daily | 19,769 | 19,861 | 19,990 | 20,083 | 20,211 |
| Weekly | 19,307 | 19,631 | 19,875 | 20,198 | 20,442 |
| Monthly | 18,348 | 19,151 | 19,635 | 20,438 | 20,922 |
Here are the formulas:
![]()
Earnings season is either underway or should be starting soon. The sessions could be more volatile.
Here's a symbol list of 187 chart and candlestick patterns (13 "investment grade" candle patterns) found in today's securities using my version of Patternz: DDD, AYI, ADBE, APD, ATSG, AKAM, AA, ALL, AEP, AMWD, APH, AON, AMAT, ATR, AIZ, AGO, AVA, BALL, BMRN, BAH, BFH, BR, BG, CACI, CAL, CX, CHKP, CNA, CMCO, COST, COTY, CCRN, CTS, DHR, XRAY, ^DJU, DOV, EXP, EBAY, EMR, EQT, EL, FFIV, FLS, FCX, IT, GNW, GILD, GFS, GMS, GGG, THG, HE, HQY, HNI, HUN, IBP, IIIN, PODD, INTC, TILE, IPG, IPI, INTU, KBH, KELYA, KLAC, LRCX, LANC, LEN, LNC, RAMP, L, MHO, MTSI, MAN, MLM, MA, MTDR, MRK, MU, MCO, MOS, MUR, MYGN, NTGR, NWPX, NVDA, ORI, OLN, OMC, OTEX, ORCL, PANW, PKE, PDCO, PPG, PSTG, QTWO, KWR, RJF, RHI, ROG, SAIC, SIGI, SRE, SKX, SXI, SCS, SSYS, SRDX, TRGP, TGT, TDOC, TEVA, TRV, TZOO, TG, TREX, TWLO, UGI, VECO, WRB, WERN, WU, WMB, WOLF, WDAY, XEL, IYM, IDU, FTEC, FXI, IAT, IYZ, IEV, IXN, SOXX, IEO, ITB, EWA, EWO, EWK, EWC, ECH, EEM, EWQ, EWG, EWI, EWJ, EPP, EWS, EWP, EWD, EWT, PPA, SSO, ROBO, GLD, XAR, XLK, UNG, SMH. Click this link for details (pattern type, start and end dates).
For a list of small patterns (those a few days wide) click this link.
The below industries were the best (rank 1) or worst performing of those I follow.
|
-- Thomas Bulkowski
![]()
Here's a symbol list of 179 chart and candlestick patterns (13 "investment grade" candle patterns) found in today's securities using my version of Patternz: ADBE, ATSG, AKAM, ALRM, ALB, ALL, AEP, AFG, AMWD, AON, ATR, AIZ, AGO, AVY, AVNT, AVA, AXS, BCPC, BALL, BIIB, BKH, BA, BAH, BRC, BFH, CX, COR, CRL, CINF, CLNE, CNA, CMCO, ED, COP, CSGP, COST, CR, CROX, CCRN, CTS, XRAY, ^DJI, DTE, EXP, EMR, EL, EXPI, FFIV, FARO, FDP, GD, GE, GNW, GPN, GFS, GMS, THG, HE, HTLD, HNI, JBHT, HUN, IIIN, ITGR, INTC, TILE, IPG, INTU, KALU, KFRC, LZB, LANC, LNC, RAMP, L, MHO, MANH, MAN, MLM, MA, MTDR, MLKN, MCO, MS, MOS, MUR, NTGR, NJR, NWL, JWN, NWPX, OLN, OMC, OTEX, ORCL, OUT, PANW, PKE, PATK, POR, PPG, PEG, PSTG, QTWO, KWR, RRC, RJF, RNG, RLI, RHI, SBH, SAND, SCHW, SAIC, SIGI, SRE, SMTC, SKX, SWX, SPSC, SXI, SCS, SSYS, TRGP, TECH, TDY, TEVA, TDG, TZOO, TG, TREX, UGI, UIS, VEEV, WRB, WMT, WERN, WMB, WOLF, WWW, WWD, XEL, ITA, IYC, FTEC, FDN, FXL, EWO, EWC, EEM, EWQ, EWH, EWW, EZA, EWT, PBE, PEJ, ROBO, XLY, XRT, UNG. Click this link for details (pattern type, start and end dates).
For a list of small patterns (those a few days wide) click this link.
$ $ $
You can find setups based on a Fibonacci retrace by clicking on the link.
The following patterns were found manually, not using Patternz. Mr. Bulkowski has excluded any securities he owns from appearing in the list. However, he may add any of the securities listed to his portfolio at any time, just as you can.
In the table below, the red and green colors are based on the historical breakout direction for the associated chart pattern. If a high and tight flag appears, the start and end dates highlight the flagpole only and not the flag.
For details about the chart patterns, click here.
-- Thomas Bulkowski, author: Invest for Two-Comma Wealth and the novel (fiction), Foresight (#Ad)
![]()
| Symbol | Chart Pattern | Bullish Bearish | Start | End | Industry |
| ABT | Double Bottom, Eve and Adam | 12/19/2024 | 01/15/2025 | Medical Supplies | |
| ANF | Triple top | 10/17/2024 | 01/07/2025 | Apparel | |
| ADBE | Pipe bottom | 01/06/2025 | 01/13/2025 | Computer Software and Svcs | |
| A | Ugly double bottom | 11/20/2024 | 12/19/2024 | Precision Instrument | |
| AKAM | Pipe bottom | 01/06/2025 | 01/13/2025 | E-Commerce | |
| AMZN | Triple bottom | 12/20/2024 | 01/14/2025 | Internet | |
| APH | Head-and-shoulders bottom | 01/02/2025 | 01/17/2025 | Electronics | |
| AGO | Double Bottom, Eve and Adam | 12/18/2024 | 01/10/2025 | Insurance (Life) | |
| BAH | Triple bottom | 12/19/2024 | 01/08/2025 | IT Services | |
| BFH | Pipe bottom | 01/06/2025 | 01/13/2025 | Information Services | |
| BMY | Double Bottom, Adam and Adam | 12/13/2024 | 01/13/2025 | Drug | |
| ^DJU | Double Bottom, Eve and Adam | 12/19/2024 | 01/13/2025 | None | |
| ^DJT | Triple bottom | 12/20/2024 | 01/13/2025 | None | |
| DUK | Double Bottom, Adam and Eve | 12/18/2024 | 01/13/2025 | Electric Utility (East) | |
| EMR | Pipe bottom | 01/06/2025 | 01/13/2025 | Computers and Peripherals | |
| EXPD | Diamond bottom | 12/23/2024 | 01/22/2025 | Air Transport | |
| XOM | Triple bottom | 12/20/2024 | 01/10/2025 | Petroleum (Integrated) | |
| GD | Triple bottom | 12/12/2024 | 01/06/2025 | Aerospace/Defense | |
| IIIN | Pipe bottom | 01/06/2025 | 01/13/2025 | Building Materials | |
| INTC | Double Bottom, Eve and Eve | 12/20/2024 | 01/13/2025 | Semiconductor | |
| IRM | Triple bottom | 12/19/2024 | 01/10/2025 | Industrial Services | |
| JBLU | Triangle, symmetrical | 12/30/2024 | 01/17/2025 | Air Transport | |
| KEYS | Triple bottom | 12/19/2024 | 01/13/2025 | Precision Instrument | |
| LNC | Double Bottom, Adam and Adam | 12/20/2024 | 01/10/2025 | Insurance (Life) | |
| MCO | Pipe bottom | 01/06/2025 | 01/13/2025 | Information Services | |
| MS | Double Bottom, Eve and Adam | 12/18/2024 | 01/13/2025 | Securities Brokerage | |
| NTGR | Pipe bottom | 01/06/2025 | 01/13/2025 | Telecom. Equipment | |
| NWL | Broadening top, right-angled and descending | 12/27/2024 | 01/17/2025 | Household Products | |
| ORCL | Pipe bottom | 01/06/2025 | 01/13/2025 | Computer Software and Svcs | |
| OUT | Falling wedge | 12/16/2024 | 01/13/2025 | Advertising | |
| PANW | Pipe bottom | 01/06/2025 | 01/13/2025 | Computer Software and Svcs | |
| PFG | Double Bottom, Adam and Adam | 12/20/2024 | 01/13/2025 | Insurance (Diversified) | |
| PEG | Double Bottom, Adam and Adam | 12/20/2024 | 01/13/2025 | Electric Utility (East) | |
| PSTG | Horn bottom | 12/30/2024 | 01/13/2025 | Computers and Peripherals | |
| R | Triple bottom | 12/23/2024 | 01/10/2025 | Trucking/Transp. Leasing | |
| SBH | Pipe bottom | 12/30/2024 | 01/06/2025 | Toiletries/Cosmetics | |
| SWX | Double Bottom, Adam and Adam | 12/18/2024 | 01/10/2025 | Natural Gas (Distributor) | |
| SR | Double Bottom, Adam and Adam | 12/18/2024 | 01/10/2025 | Natural Gas (Distributor) | |
| TDOC | Triangle, symmetrical | 12/16/2024 | 01/23/2025 | Healthcare Information | |
| TDC | Head-and-shoulders bottom | 01/03/2025 | 01/17/2025 | Computer Software and Svcs | |
| TXT | Double Bottom, Adam and Eve | 12/20/2024 | 01/08/2025 | Diversified Co. | |
| TSCO | Head-and-shoulders bottom | 12/19/2024 | 01/16/2025 | Retail Building Supply | |
| VFC | Pipe bottom | 12/30/2024 | 01/06/2025 | Apparel | |
| WPM | Double Bottom, Adam and Adam | 12/30/2024 | 01/13/2025 | Metals and Mining (Div.) | |
| XEL | Pipe bottom | 01/06/2025 | 01/13/2025 | Electric Utility (West) |
![]()
$ $ $
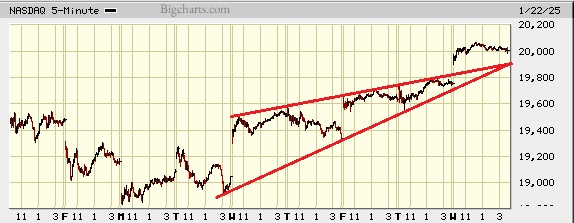
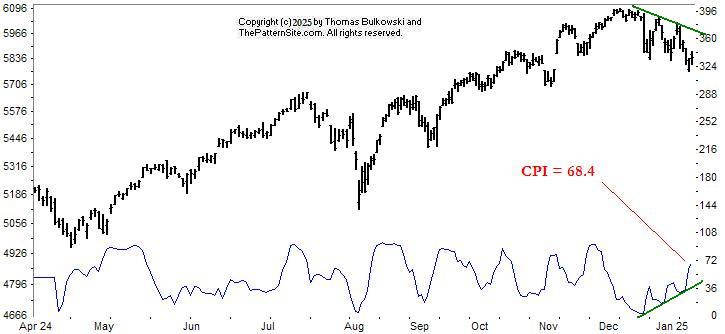
I show a picture of the Nasdaq composite on the 5-minute scale.
The chart shows a chart pattern called a rising wedge. That pattern has a trend bounded by two rising and converging trendlines, like the red ones shown here.
Breakout from a rising wedge is upward 40% of the time, meaning it breaks out downward most often. A breakout happens when the index closes below or above one of the trendlines. This example shows an upward breakout.
What happens next? A throwback happens 72% of the time. That means the index should return to the breakout price, often in an average of 12 days. So I'm looking for the index to move lower in the coming days.
$ $ $
Here's a symbol list of 245 chart and candlestick patterns (13 "investment grade" candle patterns) found in today's securities using my version of Patternz: DDD, ACN, ADBE, APD, AKAM, ALK, ALKS, ALL, AFG, AMWD, APH, AON, AAPL, AMAT, ANET, AIZ, AGO, AVA, AXS, BALL, BKH, BFH, BBW, CDNS, CE, CLS, CNP, CF, CIEN, CINF, CLX, CNA, CNX, CMCO, CXW, COST, COTY, CTS, XRAY, DVN, DDS, DFS, D, BOOM, EXP, EME, EMR, EL, EXPI, EZPW, FFIV, FDS, FTV, GD, GNW, GFS, GMS, GGG, HBI, THG, HE, HQY, HSY, HNI, HD, HON, HUN, IDA, IIIN, ITGR, INTC, IBKR, TILE, IPG, KMT, KMB, LANC, LNC, L, MHO, MAN, MKTX, MTRN, MTRX, MGEE, MSFT, MCO, MOS, MUR, ^IXIC, NTGR, NTAP, NWL, NEU, NEE, NWPX, OXY, OGE, ORI, OLN, OMCL, OMC, OTEX, ORCL, PANW, PKE, PEN, PLXS, POR, PINC, PG, PEG, PSTG, QTWO, KWR, REGN, RLI, RHI, ROK, RGLD, ^GSPC, SEIC, SIGI, SRE, SMTC, NOW, SHW, SLGN, SKX, LUV, SWX, SR, SXI, SCS, SSYS, SRDX, TRGP, TECH, TDOC, TDY, TPX, TKR, TDG, TRV, TZOO, TG, TREX, TWLO, UIS, VEEV, VRTX, WERN, WMB, WOLF, WWD, XEL, IYM, IYK, IYC, IDU, DDM, FTEC, FDN, QTEC, FXL, FXI, BOTZ, QQQ, ICF, IYZ, IEV, IGV, MXI, IXN, ILF, IGE, EWA, EWZ, EWC, ECH, EWQ, EWG, EWH, EWM, EPP, EZA, EWY, EWP, EWL, THD, TUR, QLD, DBA, PEJ, PXJ, SSO, ROBO, XLP, GLD, XLB, SPY, XLK, XLU, UNG, SMH, VAW, MGK, VONG. Click this link for details (pattern type, start and end dates).
For a list of small patterns (those a few days wide) click this link.
$ $ $
The following table shows where Fibonacci retrace values of the day's high-low range are plus pivot points, calculated on the Nasdaq composite, sorted by value. When several are near each other (small differences), the area might act as support or resistance.
-- Thomas Bulkowski
![]()
| © 2025 ThePatternSite.com Metric | Value | Diff | Close (within 10% of the high-low range for the day)? |
| Monthly S2 | 18,309.27 | ||
| Weekly S2 | 18,639.23 | 329.96 | |
| Monthly S1 | 19,159.31 | 520.07 | |
| Weekly S1 | 19,324.29 | 164.98 | |
| Weekly Pivot | 19,516.96 | 192.68 | |
| Monthly Pivot | 19,681.94 | 164.98 | |
| Daily S2 | 19,828.17 | 146.22 | |
| Low | 19,903.05 | 74.88 | |
| Open | 19,903.05 | 0.00 | Yes! The Open is close to the Low. |
| Daily S1 | 19,918.75 | 15.70 | Yes! The Daily S1 is close to the Open. |
| 61.8% Down from Intraday High | 19,966.26 | 47.51 | |
| 50% Down from Intraday High | 19,985.79 | 19.53 | |
| Daily Pivot | 19,993.64 | 7.85 | Yes! The Daily Pivot is close to the 50% Down from Intraday High. |
| 38.2% Down from Intraday High | 20,005.31 | 11.67 | Yes! The 38.2% Down from Intraday High is close to the Daily Pivot. |
| Close | 20,009.34 | 4.03 | Yes! The Close is close to the 38.2% Down from Intraday High. |
| High | 20,068.52 | 59.18 | |
| Daily R1 | 20,084.22 | 15.70 | Yes! The Daily R1 is close to the High. |
| Daily R2 | 20,159.11 | 74.88 | |
| Weekly R1 | 20,202.02 | 42.91 | |
| Weekly R2 | 20,394.69 | 192.68 | |
| Monthly R1 | 20,531.98 | 137.28 | |
| Monthly R2 | 21,054.61 | 522.64 |
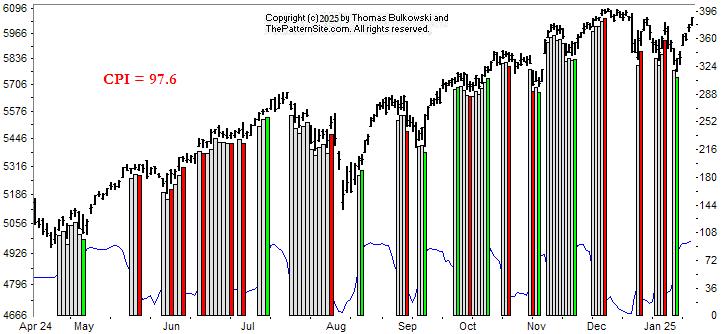
This is a picture of the chart pattern indicator on the daily scale. The indicator is the line chart below a chart of the S&P 500 composite.
The indicator turned bullish about a week ago, which the green bar on the far right of the chart shows.
Since the signal, the market has responded by moving higher in a straight-line run upward.
Near the bottom of the chart, you can see the thin blue indicator line. It's at 97.6, which is close to the max value of 100. It suggests that there's a tiny bit of upside left before it plummets. If it drops, it signals market weakness but not necessarily pulling down the index dramatically. Look back at the chart, where it shows the blue line and marry that with how the index behaved. Sometimes the CPI dropped and the index followed (mid August, for example). Sometimes, the CPI dropped but the index continued higher (September).
$ $ $
Here's a symbol list of 183 chart and candlestick patterns (13 "investment grade" candle patterns) found in today's securities using my version of Patternz: MMM, ANF, ADTN, APD, ALB, AA, ALKS, AMZN, AEE, AMWD, AAPL, ARCB, AWI, ARW, AIZ, ADSK, AVA, AXS, BAX, BZH, BA, BSX, BFH, CE, CLS, CX, CDAY, CINF, CLX, CAG, CXW, COTY, CROX, CSGS, CTS, CW, EMR, EPAM, EVRG, EXC, FFIV, FLS, FTV, GD, GE, GIS, GNW, GFS, GL, GMS, GOOGL, GPRO, GFF, HNI, HOV, HURC, IDA, ITW, INFN, IIIN, INTC, KALU, KBH, K, KELYA, KMB, LHX, LAMR, LMT, LOW, MTSI, MAN, MCHX, MLM, MTRN, MTRX, NFG, NI, JWN, NOC, OGE, ORI, OR, OUT, PKG, PKE, PYPL, PEN, PNW, PLXS, PPL, PINC, PSTG, RL, RJF, RTX, RNG, RCKY, SCHW, SRE, NOW, SKX, SWX, SR, SXI, TRGP, TECH, TDOC, TPX, TDC, TXN, TXT, TDG, UGI, UIS, VFC, VEEV, VMC, WRB, WSO, WU, WPM, WMB, WSM, WSC, WWD, ZBRA, ITA, IYM, IDU, QTEC, BOTZ, IAT, IYZ, IEV, MXI, IYF, IHI, EWA, EWO, EWK, ECH, EWQ, EWG, EIS, EWI, EWM, EPP, EWS, EZA, EWP, EWD, EWL, EWT, EWU, IBB, PPA, DBA, PEJ, PXJ, PJP, PHO, ROBO, XLF, GLD, XLI, XLB, XRT, XAR, XLU, VIS, VAW. Click this link for details (pattern type, start and end dates).
For a list of small patterns (those a few days wide) click this link.
-- Thomas Bulkowski
![]()
$ $ $
I show another slider trading quiz featuring Varian Semiconductor: VSEA stock.
$ $ $
Here's a symbol list of 182 chart and candlestick patterns (13 "investment grade" candle patterns) found in today's securities using my version of Patternz: A, ALK, ALB, AMZN, AME, ANIK, APA, ARCB, ADP, AXS, AZTA, BSET, BAX, BZH, BRKR, BLDR, CDAY, CRL, CINF, CTAS, CLX, CNO, CGNX, CMTL, GLW, CRH, CCK, CMI, ^DJT, ^DJI, BOOM, EXP, EME, EMR, EFX, EXPI, FFIV, FICO, FIVN, FTNT, FTV, FWRD, GME, GIS, GPN, GFS, GL, GMS, GFF, GES, DHI, HOV, HUBG, HUN, HURC, IDA, IDXX, NSP, INTC, IPI, KALU, KBH, KEYS, LZB, LEG, LNC, RAMP, MTSI, MANH, MLM, MAS, MRK, MCO, NBR, NFG, NWL, NEU, NKE, JWN, NOVT, NTNX, OGE, ORI, OMC, OTEX, OUT, PTEN, PAYX, PCTY, PPG, PPL, PINC, PFG, RMBS, RGS, RCKY, RES, ^GSPC, SLB, SAIC, SMG, SEE, SEIC, SIGI, SMAR, SR, SXI, TPR, TRGP, TPX, TDC, TEVA, TXN, TXT, TTD, TOL, TZOO, TWLO, UGI, UIS, UNM, VFC, WRB, WU, WOLF, WDAY, IYM, IAI, IYC, IEZ, IHE, DDM, QTEC, FXL, FXI, BOTZ, IYZ, IGV, MXI, IXN, IGE, EWO, EWK, EWQ, EWG, EWH, EWI, EZA, EWP, EWD, TUR, EWU, PPA, DBA, PEJ, PXJ, PHO, SSO, ROBO, XLY, XLI, XLB, SPY, XAR, VIS, VAW. Click this link for details (pattern type, start and end dates).
For a list of small patterns (those a few days wide) click this link.
$ $ $
The following table shows where Fibonacci retrace values of the day's high-low range are plus pivot points, calculated on the Dow industrials, sorted by value. When several are near each other (small differences), the area might act as support or resistance.
-- Thomas Bulkowski
![]()
| © 2025 ThePatternSite.com Metric | Value | Diff | Close (within 10% of the high-low range for the day)? |
| Monthly S2 | 40,919.64 | ||
| Weekly S2 | 41,186.96 | 267.32 | |
| Monthly S1 | 42,203.74 | 1,016.77 | |
| Weekly S1 | 42,337.40 | 133.66 | |
| Weekly Pivot | 42,995.32 | 657.93 | |
| Monthly Pivot | 43,128.98 | 133.66 | |
| Daily S2 | 43,143.84 | 14.86 | Yes! The Daily S2 is close to the Monthly Pivot. |
| Low | 43,312.55 | 168.71 | |
| Open | 43,312.55 | 0.00 | Yes! The Open is close to the Low. |
| Daily S1 | 43,315.84 | 3.29 | Yes! The Daily S1 is close to the Open. |
| 61.8% Down from Intraday High | 43,442.70 | 126.86 | |
| 50% Down from Intraday High | 43,482.90 | 40.20 | |
| Daily Pivot | 43,484.54 | 1.64 | Yes! The Daily Pivot is close to the 50% Down from Intraday High. |
| Close | 43,487.83 | 3.29 | Yes! The Close is close to the Daily Pivot. |
| 38.2% Down from Intraday High | 43,523.10 | 35.27 | |
| High | 43,653.25 | 130.15 | |
| Daily R1 | 43,656.54 | 3.29 | Yes! The Daily R1 is close to the High. |
| Daily R2 | 43,825.24 | 168.71 | |
| Weekly R1 | 44,145.76 | 320.52 | |
| Monthly R1 | 44,413.08 | 267.32 | |
| Weekly R2 | 44,803.68 | 390.61 | |
| Monthly R2 | 45,338.32 | 534.64 |
Here's a symbol list of 140 chart and candlestick patterns (13 "investment grade" candle patterns) found in today's securities using my version of Patternz: ABT, AXDX, AMZN, DOX, AEP, AFG, AIG, AMWD, AMGN, AMAT, ACGL, ASH, ATO, ADP, BSET, BAX, BKNG, BMY, BR, CPB, CLS, CNP, CRL, CTAS, CSCO, CNO, CL, CMTL, COTY, CSGS, DHR, DFS, D, DTE, DUK, BOOM, EMR, EL, EVRG, EXC, FFIV, FICO, FIVN, FTV, FNV, GME, GAP, GD, GL, HQY, HTLD, HELE, HUBG, PODD, TILE, IPI, KLAC, LHX, LRCX, LPLA, LXU, MTSI, MGY, MS, MUR, ^IXIC, NFG, NJR, NI, NOC, NVDA, OGE, PDCO, PTEN, PCTY, PNW, POR, PPG, PPL, PINC, PFG, PEG, QCOM, RL, RGA, RLI, ROL, RES, SAIA, SCHW, SEE, SHW, SO, LUV, SWX, SPSC, TPX, TDC, TMO, TSCO, TRV, TWLO, UGI, UPS, VFC, WLK, WEX, WPM, XEL, IAI, IYK, IHE, FTEC, IEV, IXC, IXN, EWK, EWQ, EWM, EWS, EWY, EWD, EWL, EWT, TUR, QLD, ROBO, GLD, XLK, XLU, SMH, VHT. Click this link for details (pattern type, start and end dates).
For a list of small patterns (those a few days wide) click this link.
$ $ $
You can find setups based on a Fibonacci retrace by clicking on the link.
The following patterns were found manually, not using Patternz. Mr. Bulkowski has excluded any securities he owns from appearing in the list. However, he may add any of the securities listed to his portfolio at any time, just as you can.
In the table below, the red and green colors are based on the historical breakout direction for the associated chart pattern. If a high and tight flag appears, the start and end dates highlight the flagpole only and not the flag.
For details about the chart patterns, click here.
-- Thomas Bulkowski, author: Invest for Two-Comma Wealth and the novel (fiction), Foresight (#Ad)
![]()
| Symbol | Chart Pattern | Bullish Bearish | Start | End | Industry |
| ANF | Pipe bottom | 12/09/2024 | 12/16/2024 | Apparel | |
| ABM | Double Bottom, Adam and Eve | 12/18/2024 | 01/07/2025 | Industrial Services | |
| ACIW | Double Bottom, Adam and Eve | 12/30/2024 | 01/07/2025 | IT Services | |
| AES | Double Bottom, Adam and Adam | 12/19/2024 | 12/30/2024 | Electric Utility (East) | |
| AFL | Double Bottom, Eve and Adam | 12/18/2024 | 01/13/2025 | Insurance (Diversified) | |
| ALB | Double Bottom, Eve and Adam | 01/02/2025 | 01/10/2025 | Chemical (Diversified) | |
| AEE | Double Bottom, Adam and Eve | 12/19/2024 | 01/06/2025 | Electric Utility (Central) | |
| AEP | Double Bottom, Adam and Eve | 12/19/2024 | 01/08/2025 | Electric Utility (Central) | |
| AIG | Double Bottom, Adam and Adam | 12/18/2024 | 01/10/2025 | Insurance (Prop/Casualty) | |
| ARCB | Double Bottom, Eve and Adam | 12/30/2024 | 01/13/2025 | Trucking/Transp. Leasing | |
| ACGL | Double Bottom, Eve and Eve | 12/20/2024 | 01/13/2025 | Insurance (Prop/Casualty) | |
| ATO | Double Bottom, Adam and Eve | 12/19/2024 | 01/06/2025 | Natural Gas (Diversified) | |
| BMRN | Triangle, ascending | 11/11/2024 | 01/03/2025 | Biotechnology | |
| BR | Broadening bottom | 12/20/2024 | 01/10/2025 | Information Services | |
| COR | Double Bottom, Eve and Eve | 12/19/2024 | 01/02/2025 | Biotechnology | |
| CNP | Double Bottom, Adam and Eve | 12/10/2024 | 01/08/2025 | Electric Utility (Central) | |
| CENX | Double Bottom, Adam and Adam | 12/20/2024 | 01/03/2025 | Metals and Mining (Div.) | |
| CTAS | Double Bottom, Adam and Eve | 12/20/2024 | 12/30/2024 | Industrial Services | |
| CNO | Double Bottom, Adam and Adam | 12/18/2024 | 01/10/2025 | Insurance (Diversified) | |
| CMTL | Dead-cat bounce | 01/13/2025 | 01/13/2025 | Telecom. Equipment | |
| GLW | Triple bottom | 12/18/2024 | 01/13/2025 | Telecom. Equipment | |
| CTS | Pipe top | 11/04/2024 | 11/11/2024 | Electronics | |
| CMI | Triple bottom | 12/20/2024 | 01/03/2025 | Machinery | |
| CW | Double Bottom, Eve and Eve | 12/18/2024 | 01/13/2025 | Machinery | |
| DFS | Double Bottom, Eve and Adam | 12/18/2024 | 01/10/2025 | Financial Services | |
| DTE | Head-and-shoulders bottom | 12/10/2024 | 12/30/2024 | Electric Utility (Central) | |
| EBAY | Double Bottom, Adam and Adam | 12/30/2024 | 01/03/2025 | Internet | |
| EL | Double Bottom, Adam and Adam | 01/03/2025 | 01/10/2025 | Toiletries/Cosmetics | |
| EVRG | Double Bottom, Eve and Eve | 12/19/2024 | 01/13/2025 | Electric Utility (Central) | |
| FFIV | Triple bottom | 12/20/2024 | 01/13/2025 | Internet | |
| FARO | Triple bottom | 12/20/2024 | 01/13/2025 | Precision Instrument | |
| FRD | Pipe top | 12/02/2024 | 12/09/2024 | Building Materials | |
| GME | Horn top | 12/23/2024 | 01/06/2025 | Retail (Special Lines) | |
| GL | Pipe bottom | 12/02/2024 | 12/09/2024 | Insurance (Life) | |
| GS | Double Bottom, Eve and Eve | 12/18/2024 | 01/13/2025 | Securities Brokerage | |
| GFF | Double Bottom, Adam and Eve | 12/30/2024 | 01/08/2025 | Building Materials | |
| HIG | Double Bottom, Eve and Adam | 12/20/2024 | 01/10/2025 | Insurance (Prop/Casualty) | |
| HD | Double Bottom, Adam and Eve | 12/20/2024 | 01/08/2025 | Retail Building Supply | |
| DHI | Double Bottom, Adam and Eve | 12/19/2024 | 01/13/2025 | Homebuilding | |
| HUBG | Double Bottom, Adam and Adam | 12/20/2024 | 01/13/2025 | Trucking/Transp. Leasing | |
| IEX | Double Bottom, Adam and Adam | 01/03/2025 | 01/13/2025 | Machinery | |
| PODD | Double Bottom, Eve and Eve | 12/19/2024 | 01/02/2025 | Medical Supplies | |
| IPAR | Triple bottom | 12/23/2024 | 01/13/2025 | Toiletries/Cosmetics | |
| IBKR | Double Bottom, Eve and Adam | 12/20/2024 | 01/02/2025 | Securities Brokerage | |
| KALU | Triple bottom | 12/20/2024 | 01/08/2025 | Metals and Mining (Div.) | |
| LZB | Triple bottom | 12/20/2024 | 01/10/2025 | Furn/Home Furnishings | |
| LLY | Double Top, Adam and Adam | 12/20/2024 | 01/13/2025 | Drug | |
| L | Double Bottom, Adam and Adam | 12/19/2024 | 01/13/2025 | Insurance (Prop/Casualty) | |
| LOW | Triple bottom | 12/20/2024 | 01/08/2025 | Retail Building Supply | |
| MTSI | Double Bottom, Eve and Adam | 01/02/2025 | 01/13/2025 | Semiconductor | |
| MTRX | Double Bottom, Adam and Adam | 12/30/2024 | 01/13/2025 | Oilfield Svcs/Equipment | |
| ^IXIC | Triple top | 12/16/2024 | 01/06/2025 | None | |
| NFG | Double Bottom, Eve and Eve | 11/07/2024 | 12/20/2024 | Natural Gas (Diversified) | |
| NI | Double Bottom, Eve and Eve | 12/19/2024 | 01/06/2025 | Electric Utility (Central) | |
| NTNX | Double Bottom, Eve and Eve | 01/02/2025 | 01/13/2025 | E-Commerce | |
| OXM | Double Bottom, Adam and Adam | 12/12/2024 | 12/30/2024 | Apparel | |
| PAYX | Double Bottom, Adam and Adam | 12/18/2024 | 01/06/2025 | IT Services | |
| PPG | Double Bottom, Adam and Adam | 01/03/2025 | 01/10/2025 | Chemical (Diversified) | |
| PPL | Double Bottom, Adam and Adam | 12/19/2024 | 01/13/2025 | Electric Utility (East) | |
| RTX | Triple bottom | 12/09/2024 | 01/06/2025 | Aerospace/Defense | |
| ROG | Horn top | 11/25/2024 | 12/09/2024 | Electronics | |
| SAIA | Double Bottom, Adam and Adam | 01/02/2025 | 01/10/2025 | Trucking/Transp. Leasing | |
| SKYW | Double Bottom, Eve and Eve | 12/18/2024 | 12/30/2024 | Air Transport | |
| SO | Double Bottom, Adam and Adam | 01/06/2025 | 01/13/2025 | Electric Utility (East) | |
| SNPS | Head-and-shoulders bottom | 12/20/2024 | 01/14/2025 | Computer Software and Svcs | |
| TDY | Double Bottom, Eve and Eve | 01/06/2025 | 01/13/2025 | Aerospace/Defense | |
| TPX | Triple bottom | 12/10/2024 | 01/08/2025 | Furn/Home Furnishings | |
| TXN | Double Bottom, Eve and Eve | 12/20/2024 | 01/02/2025 | Semiconductor | |
| TDG | Triple bottom | 11/22/2024 | 01/08/2025 | Aerospace/Defense | |
| TWLO | Triple bottom | 12/20/2024 | 01/13/2025 | E-Commerce | |
| UGI | Head-and-shoulders bottom | 12/06/2024 | 01/07/2025 | Natural Gas (Distributor) | |
| UPS | Double Bottom, Adam and Adam | 12/20/2024 | 01/13/2025 | Air Transport | |
| VFC | Triple bottom | 12/30/2024 | 01/08/2025 | Apparel | |
| VMI | Triple bottom | 12/20/2024 | 01/13/2025 | Metal Fabricating | |
| WRB | Double Bottom, Adam and Adam | 12/20/2024 | 01/10/2025 | Insurance (Prop/Casualty) | |
| WSC | Double Bottom, Adam and Adam | 12/20/2024 | 12/30/2024 | Industrial Services | |
| ZBRA | Triple bottom | 12/18/2024 | 01/13/2025 | Computers and Peripherals |
![]()
$ $ $
I show a picture of the Nasdaq composite on the 5-minute scale.
I don't have a lot to say about the chart. The index followed the channel down. I show the channel as two nearly parallel lines.
At A, the index completed what's called a throwback. That's when a chart pattern (in this case, the channel) breaks out upward but quickly (within a month but it usually happens in about a week to 10 days) returns to the breakout price. That's what you see at A.
As to what all of this means for the index going forward, I haven't a clue.
$ $ $
Here's a symbol list of 214 chart and candlestick patterns (13 "investment grade" candle patterns) found in today's securities using my version of Patternz: DDD, AES, AFL, ATSG, ALGT, AMZN, AEO, AFG, AIG, AMWD, AMN, AAPL, ARCB, ACGL, AWI, AGO, AVNT, BECN, BZH, BIO, BMRN, BKH, BFH, BLDR, CX, COR, CIEN, CTAS, CNO, CNX, CMTL, COP, COST, COTY, CCK, DHR, DFS, ^DJT, DOV, DUK, EXP, EME, EFX, EQT, EXPI, FFIV, FICO, FAST, FLS, FWRD, FNV, GME, IT, GE, GL, GMS, GGG, GFF, HQY, HTLD, HSII, HNI, HD, DHI, HOV, HWM, HUBG, JBHT, IDA, ITW, IBP, IIIN, IPI, ISRG, IRM, K, KELYA, KFRC, KLAC, LZB, LANC, LEG, LNC, LOW, LXU, MHO, MTSI, MGY, MAN, MLM, MAS, META, MGEE, MLKN, MCO, MLI, MUR, NFG, NFLX, NTAP, NEU, NOC, NUS, OGE, OLN, ORCL, OMI, PATK, PDCO, PTEN, PYPL, PFE, POR, PPG, PFG, PHM, RMBS, RRC, RJF, RHI, ROK, RES, R, SAIA, SBH, SEE, SIGI, SMTC, NOW, SHW, SLGN, SCCO, LUV, SCS, SSYS, SRDX, TPX, TXT, TOL, TSCO, TREX, UHAL, VFC, VLO, VMI, VRTX, V, VMC, WRB, WSO, WERN, WLK, WEX, XEL, ITA, IYM, IAI, IYC, IYE, IEZ, FXL, FXI, IAT, IYZ, IGV, IXC, MXI, ILF, IGE, IEO, IYF, ITB, IHI, EWK, EWZ, EEM, EWQ, EWG, EWH, EIS, EWI, EWM, EZA, EWY, EWP, EWD, EWT, IBB, PEJ, PXJ, PJP, PHO, XLE, XLF, GLD, XHB, XLI, XLB, XRT, USO, VIS, VAW. Click this link for details (pattern type, start and end dates).
For a list of small patterns (those a few days wide) click this link.
$ $ $
The following table shows where Fibonacci retrace values of the day's high-low range are plus pivot points, calculated on the Nasdaq composite, sorted by value. When several are near each other (small differences), the area might act as support or resistance.
-- Thomas Bulkowski
![]()
| © 2025 ThePatternSite.com Metric | Value | Diff | Close (within 10% of the high-low range for the day)? |
| Monthly S2 | 18,392.36 | ||
| Weekly S2 | 18,523.44 | 131.09 | |
| Monthly S1 | 18,951.79 | 428.35 | |
| Weekly S1 | 19,017.34 | 65.54 | |
| Daily S2 | 19,203.57 | 186.23 | |
| Low | 19,299.32 | 95.75 | |
| Open | 19,350.31 | 50.99 | |
| Daily S1 | 19,357.40 | 7.09 | Yes! The Daily S1 is close to the Open. |
| 61.8% Down from Intraday High | 19,394.66 | 37.26 | |
| 50% Down from Intraday High | 19,424.11 | 29.45 | |
| Daily Pivot | 19,453.15 | 29.04 | |
| 38.2% Down from Intraday High | 19,453.56 | 0.41 | Yes! The 38.2% Down from Intraday High is close to the Daily Pivot. |
| Close | 19,511.23 | 57.67 | |
| Weekly Pivot | 19,512.64 | 1.41 | Yes! The Weekly Pivot is close to the Close. |
| High | 19,548.90 | 36.26 | |
| Monthly Pivot | 19,578.19 | 29.29 | |
| Daily R1 | 19,606.98 | 28.79 | |
| Daily R2 | 19,702.73 | 95.75 | |
| Weekly R1 | 20,006.54 | 303.81 | |
| Monthly R1 | 20,137.62 | 131.09 | |
| Weekly R2 | 20,501.84 | 364.22 | |
| Monthly R2 | 20,764.02 | 262.17 |
This is a picture of the chart pattern indicator on the daily scale. The indicator is the line chart below a chart of the S&P 500 composite.
The CPI flipped from neutral (white bar) to bullish (green bar) in the most recent reading. That means the green bar on the far right of the chart appeared today (Tuesday, after the close).
Keep in mind that signals can change for up to a week, but are usually stable after 3 trading days. What does that mean? The red bar on the far right of the chart likely won't change but the signals to the right of that could change.
I'm tempted to believe that the bullish signal will remain, but that's just a guess.
This chart shows bullish divergence between the CPI and the index. The CPI shows higher lows even as the index shows lower highs.
It suggests, but does not guarantee, that the index will following the indicator higher. Keep in mind that divergence can last for months without the index paying attention to the signal.
$ $ $
Here's a symbol list of 159 chart and candlestick patterns (13 "investment grade" candle patterns) found in today's securities using my version of Patternz: ANF, AYI, AFL, APD, ALRM, AA, AMZN, DOX, AMWD, AME, AMN, ANIK, AR, AAPL, ADP, AVY, BCPC, BECN, BZH, BBY, BIO, BMRN, BBW, BLDR, CAL, CE, CSCO, CNO, CGNX, CMCO, CMTL, CCRN, CSGS, CMI, ^DJU, DOV, BOOM, ECL, EMR, EVRG, EXPI, FARO, FDX, FIVN, FLS, FTV, FRD, GME, GAP, IT, GD, GOOGL, GGG, HBI, THG, HIG, HSIC, HNI, HWM, HUBG, IDA, IEX, ITW, ILMN, IIIN, IBKR, TILE, KELYA, KFRC, LANC, LXU, MHO, MANH, MLM, MAS, MTRN, MTRX, MLI, MYGN, NFLX, NEU, NOC, NWPX, NUS, OLN, OMC, PKG, PKE, PTEN, PFE, PLXS, POR, PFG, PRU, KWR, RRC, RTX, RLI, RHI, ROK, ROP, RES, R, SBH, SCHW, SEE, STR, SKX, SCS, TECH, TDY, TFX, TTD, TKR, TSCO, TDG, TG, VFC, VMI, VMC, WRB, WERN, WU, WLK, WEX, WSM, WOLF, WDAY, ITA, IYM, IDU, ICF, IAT, MXI, ITB, EWO, ECH, EWQ, EWW, THD, PBE, PJP, PHO, XHB, XLI, XLB, XRT, UNG, VIS, VAW. Click this link for details (pattern type, start and end dates).
For a list of small patterns (those a few days wide) click this link.
-- Thomas Bulkowski
![]()
$ $ $
I show another slider trading quiz featuring Verisign: VRSN stock.
$ $ $
Here's a symbol list of 135 chart and candlestick patterns (13 "investment grade" candle patterns) found in today's securities using my version of Patternz: MMM, ANF, ABM, ALRM, ALKS, AFG, APH, ARCB, AWI, ADSK, BMRN, BRC, BFH, CBT, CAL, CENX, CF, CSCO, CGNX, CMCO, CMTL, GLW, DECK, DDS, DSGR, EVRG, FDS, FARO, FIVN, FLS, GAP, IT, GL, GOOGL, GPRO, GGG, GFF, HNI, HWM, HUM, JBHT, ILMN, INFN, INTC, IPAR, TILE, JBLU, KLAC, KSS, KLIC, LDOS, RAMP, M, MRTN, MLM, MTRN, MU, MUR, MYGN, NTAP, NJR, NI, JWN, NUS, NVDA, OMCL, OMI, PANW, PKE, PCTY, PCG, KWR, RJF, RTX, ROG, ROP, SIGI, SRE, SLGN, SKX, SXI, SCS, TJX, TOL, TDG, TZOO, VMI, VECO, VC, WEX, WOLF, WDAY, ITA, IYM, IYC, FTEC, FXL, BOTZ, ICF, IAT, IEV, IGV, MXI, IXN, EWO, EEM, EWG, EWH, EWJ, EWM, EZA, EWD, EWT, THD, TUR, EWU, PJP, ROBO, XRT, XLK, XLU, UNG, VAW, VONG. Click this link for details (pattern type, start and end dates).
For a list of small patterns (those a few days wide) click this link.
$ $ $
The following table shows where Fibonacci retrace values of the day's high-low range are plus pivot points, calculated on the Dow industrials, sorted by value. When several are near each other (small differences), the area might act as support or resistance.
-- Thomas Bulkowski
![]()
| © 2025 ThePatternSite.com Metric | Value | Diff | Close (within 10% of the high-low range for the day)? |
| Monthly S2 | 39,986.28 | ||
| Monthly S1 | 41,141.70 | 1,155.42 | |
| Weekly S2 | 41,191.90 | 50.20 | |
| Daily S2 | 41,679.16 | 487.26 | |
| Weekly S1 | 41,744.51 | 65.35 | |
| Low | 41,844.89 | 100.38 | |
| Open | 41,924.68 | 79.79 | |
| Daily S1 | 41,988.14 | 63.46 | |
| 61.8% Down from Intraday High | 42,026.23 | 38.09 | Yes! The 61.8% Down from Intraday High is close to the Daily S1. |
| 50% Down from Intraday High | 42,082.25 | 56.02 | |
| 38.2% Down from Intraday High | 42,138.26 | 56.02 | |
| Daily Pivot | 42,153.87 | 15.61 | Yes! The Daily Pivot is close to the 38.2% Down from Intraday High. |
| Close | 42,297.12 | 143.25 | |
| High | 42,319.60 | 22.48 | Yes! The High is close to the Close. |
| Weekly Pivot | 42,429.91 | 110.31 | |
| Daily R1 | 42,462.85 | 32.94 | Yes! The Daily R1 is close to the Weekly Pivot. |
| Daily R2 | 42,628.58 | 165.73 | |
| Weekly R1 | 42,982.52 | 353.94 | |
| Monthly Pivot | 43,032.72 | 50.20 | |
| Weekly R2 | 43,667.92 | 635.20 | |
| Monthly R1 | 44,188.14 | 520.22 | |
| Monthly R2 | 46,079.16 | 1,891.02 |
$ $ $
I show another slider trading quiz featuring Verisign: VRSN stock.
$ $ $
Here's a symbol list of 135 chart and candlestick patterns (13 "investment grade" candle patterns) found in today's securities using my version of Patternz: MMM, ANF, ABM, ALRM, ALKS, AFG, APH, ARCB, AWI, ADSK, BMRN, BRC, BFH, CBT, CAL, CENX, CF, CSCO, CGNX, CMCO, CMTL, GLW, DECK, DDS, DSGR, EVRG, FDS, FARO, FIVN, FLS, GAP, IT, GL, GOOGL, GPRO, GGG, GFF, HNI, HWM, HUM, JBHT, ILMN, INFN, INTC, IPAR, TILE, JBLU, KLAC, KSS, KLIC, LDOS, RAMP, M, MRTN, MLM, MTRN, MU, MUR, MYGN, NTAP, NJR, NI, JWN, NUS, NVDA, OMCL, OMI, PANW, PKE, PCTY, PCG, KWR, RJF, RTX, ROG, ROP, SIGI, SRE, SLGN, SKX, SXI, SCS, TJX, TOL, TDG, TZOO, VMI, VECO, VC, WEX, WOLF, WDAY, ITA, IYM, IYC, FTEC, FXL, BOTZ, ICF, IAT, IEV, IGV, MXI, IXN, EWO, EEM, EWG, EWH, EWJ, EWM, EZA, EWD, EWT, THD, TUR, EWU, PJP, ROBO, XRT, XLK, XLU, UNG, VAW, VONG. Click this link for details (pattern type, start and end dates).
For a list of small patterns (those a few days wide) click this link.
$ $ $
The following table shows where Fibonacci retrace values of the day's high-low range are plus pivot points, calculated on the Dow industrials, sorted by value. When several are near each other (small differences), the area might act as support or resistance.
-- Thomas Bulkowski
![]()
| © 2025 ThePatternSite.com Metric | Value | Diff | Close (within 10% of the high-low range for the day)? |
| Monthly S2 | 39,986.28 | ||
| Monthly S1 | 41,141.70 | 1,155.42 | |
| Weekly S2 | 41,191.90 | 50.20 | |
| Daily S2 | 41,679.16 | 487.26 | |
| Weekly S1 | 41,744.51 | 65.35 | |
| Low | 41,844.89 | 100.38 | |
| Open | 41,924.68 | 79.79 | |
| Daily S1 | 41,988.14 | 63.46 | |
| 61.8% Down from Intraday High | 42,026.23 | 38.09 | Yes! The 61.8% Down from Intraday High is close to the Daily S1. |
| 50% Down from Intraday High | 42,082.25 | 56.02 | |
| 38.2% Down from Intraday High | 42,138.26 | 56.02 | |
| Daily Pivot | 42,153.87 | 15.61 | Yes! The Daily Pivot is close to the 38.2% Down from Intraday High. |
| Close | 42,297.12 | 143.25 | |
| High | 42,319.60 | 22.48 | Yes! The High is close to the Close. |
| Weekly Pivot | 42,429.91 | 110.31 | |
| Daily R1 | 42,462.85 | 32.94 | Yes! The Daily R1 is close to the Weekly Pivot. |
| Daily R2 | 42,628.58 | 165.73 | |
| Weekly R1 | 42,982.52 | 353.94 | |
| Monthly Pivot | 43,032.72 | 50.20 | |
| Weekly R2 | 43,667.92 | 635.20 | |
| Monthly R1 | 44,188.14 | 520.22 | |
| Monthly R2 | 46,079.16 | 1,891.02 |
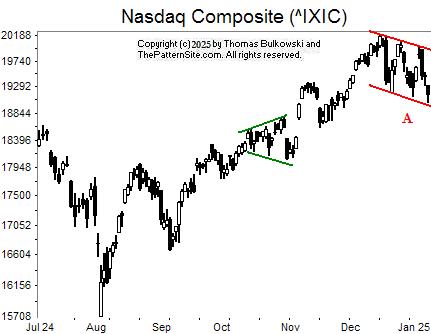
The pattern highlighted in green is a broadening top. Those breakout upward 60% of the time, according to my book, Encyclopedia of Chart Patterns, 3rd Edition (#ad). After a throwback to the breakout price, the index continued rising. It more than met the measure rule target, which was the height of the pattern added to the top of it.
Now, we're in a down-sloping channel (A). The Nasdaq is holding its value much better than the Dow industrials. Maybe that's a small consolation to your wallet or purse.
You might consider this a long flag. I think the reason for the drop from the peak about a month ago is a strong economy, forcing the FED to delay dropping interest rates. I think the market's decline is overblown, so I'm looking for a reversal. However, I'm waiting to see what the market does in the next few days before I buy more.
![]()
The following is a brief review of how the markets performed over time. The numbers refer to the close-to-close move in the Dow industrials.
Many options expire this week, so traders will be looking to close out their positions, and that suggests increased volatility (large daily price swings).
![]()
The following is based on an SFO article in December 2004 by John Seekinger, titled, "Take a two-dimensional approach." He offers these tips.
| Index | S2 | S1 | Pivot | R1 | R2 |
| Dow Industrials (^DJI): Daily | 41,456 | 41,697 | 42,119 | 42,360 | 42,782 |
| Weekly | 41,072 | 41,505 | 42,310 | 42,743 | 43,548 |
| Monthly | 39,867 | 40,903 | 42,913 | 43,949 | 45,960 |
| S&P500 (^GSPC): Daily | 5,759 | 5,793 | 5,842 | 5,876 | 5,924 |
| Weekly | 5,672 | 5,750 | 5,885 | 5,963 | 6,099 |
| Monthly | 5,619 | 5,723 | 5,912 | 6,015 | 6,204 |
| Nasdaq (^IXIC): Daily | 18,869 | 19,015 | 19,165 | 19,312 | 19,462 |
| Weekly | 18,407 | 18,784 | 19,396 | 19,773 | 20,385 |
| Monthly | 18,276 | 18,719 | 19,462 | 19,905 | 20,647 |
Here are the formulas:
![]()
Earnings season will be starting in about 3 days.
Here's a symbol list of 144 chart and candlestick patterns (13 "investment grade" candle patterns) found in today's securities using my version of Patternz: ADBE, AMD, AES, APD, ALRM, ALKS, ALL, AIG, AR, APOG, ADM, AGO, ADSK, AVNT, BIIB, BOOT, CACI, CALM, CNP, CINF, CLNE, CL, CMCO, CMTL, CTS, DVN, DFS, ^DJT, EIX, EOG, FDS, FIVN, GNW, GPN, GFS, GOOGL, THG, HTLD, HSII, HP, HUN, HURC, ILMN, IIIN, INTC, IPAR, TILE, IPG, KBH, KMB, KLIC, LRCX, LNC, RAMP, MGY, MRTN, MTDR, META, MU, MSFT, MUR, NFLX, NJR, OMCL, ON, ORCL, PKE, PAYX, PCTY, PCG, QTWO, RRC, RNG, RLI, RHI, ROG, CRM, SAND, SLB, SIGI, SRE, NOW, STR, SKX, SMAR, SR, SXI, SSYS, TFX, TG, UHAL, VLO, VEEV, VC, WAT, WEX, WOLF, XEL, IYC, IHE, IDU, FTEC, QTEC, FXI, ICF, IAT, IGV, IXN, ILF, IEO, EWK, EWZ, EEM, EWQ, EWH, EWJ, EWM, EZA, EWD, EWT, THD, IBB, DBA, PEJ, GLD, XLK, XLU, UNG, USO, VONG. Click this link for details (pattern type, start and end dates).
For a list of small patterns (those a few days wide) click this link.
The below industries were the best (rank 1) or worst performing of those I follow.
|
-- Thomas Bulkowski
![]()
Here's a symbol list of 4 chart and candlestick patterns (13 "investment grade" candle patterns) found in today's securities using my version of Patternz: HBI, ILMN, MU, NWL. Click this link for details (pattern type, start and end dates).
For a list of small patterns (those a few days wide) click this link.
$ $ $
You can find setups based on a Fibonacci retrace by clicking on the link.
The following patterns were found manually, not using Patternz. Mr. Bulkowski has excluded any securities he owns from appearing in the list. However, he may add any of the securities listed to his portfolio at any time, just as you can.
In the table below, the red and green colors are based on the historical breakout direction for the associated chart pattern. If a high and tight flag appears, the start and end dates highlight the flagpole only and not the flag.
For details about the chart patterns, click here.
-- Thomas Bulkowski, author: Invest for Two-Comma Wealth and the novel (fiction), Foresight (#Ad)
![]()
| Symbol | Chart Pattern | Bullish Bearish | Start | End | Industry |
| AEIS | Double Bottom, Eve and Adam | 12/20/2024 | 12/30/2024 | Semiconductor | |
| AMD | Double Bottom, Eve and Eve | 12/20/2024 | 01/02/2025 | Semiconductor | |
| A | Double Bottom, Adam and Eve | 12/19/2024 | 01/03/2025 | Precision Instrument | |
| APOG | Head-and-shoulders top | 10/04/2024 | 11/25/2024 | Building Materials | |
| AMAT | Double Bottom, Adam and Eve | 12/20/2024 | 12/30/2024 | Semiconductor Cap Equip. | |
| ADSK | Triangle, descending | 11/29/2024 | 01/07/2025 | Computer Software and Svcs | |
| BERY | Double Bottom, Adam and Eve | 12/20/2024 | 12/30/2024 | Packaging and Container | |
| BFH | Pipe top | 12/09/2024 | 12/16/2024 | Information Services | |
| BR | Double Bottom, Eve and Adam | 12/20/2024 | 12/30/2024 | Information Services | |
| CNP | Triple top | 12/03/2024 | 12/20/2024 | Electric Utility (Central) | |
| CRL | Double Bottom, Adam and Eve | 12/19/2024 | 12/30/2024 | Biotechnology | |
| CLNE | Triple bottom | 12/20/2024 | 12/30/2024 | Natural Gas (Distributor) | |
| CGNX | Double Bottom, Adam and Adam | 12/18/2024 | 12/30/2024 | Precision Instrument | |
| GLW | Double Bottom, Eve and Eve | 12/18/2024 | 01/02/2025 | Telecom. Equipment | |
| CROX | Roof, inverted | 12/04/2024 | 01/07/2025 | Shoe | |
| ELV | Double Bottom, Eve and Eve | 12/19/2024 | 01/02/2025 | Medical Services | |
| EMR | Head-and-shoulders top | 11/13/2024 | 12/13/2024 | Computers and Peripherals | |
| FFIV | Double Bottom, Eve and Adam | 12/20/2024 | 01/02/2025 | Internet | |
| FDS | Triple top | 11/14/2024 | 12/19/2024 | Information Services | |
| FMC | Double Bottom, Adam and Adam | 12/19/2024 | 12/30/2024 | Chemical (Basic) | |
| FNV | Double Bottom, Eve and Eve | 11/14/2024 | 12/20/2024 | Metals and Mining (Div.) | |
| FCX | Double Bottom, Adam and Eve | 12/19/2024 | 01/03/2025 | Metals and Mining (Div.) | |
| GAP | Double Top, Adam and Eve | 11/22/2024 | 12/09/2024 | Apparel | |
| GILD | Triple top | 12/02/2024 | 12/26/2024 | Biotechnology | |
| GOOGL | Double Bottom, Adam and Eve | 12/20/2024 | 01/02/2025 | Internet | |
| HLIT | Triangle, ascending | 12/12/2024 | 01/08/2025 | Telecom. Equipment | |
| HE | Triple top | 11/05/2024 | 12/09/2024 | Electric Utility (West) | |
| HL | Double Bottom, Eve and Eve | 12/19/2024 | 12/30/2024 | Metals and Mining (Div.) | |
| HON | Double Top, Adam and Adam | 11/12/2024 | 12/17/2024 | Aerospace/Defense | |
| IDXX | Double Bottom, Adam and Eve | 12/20/2024 | 12/30/2024 | Drug | |
| ILMN | Double Bottom, Adam and Eve | 12/19/2024 | 01/02/2025 | Biotechnology | |
| INCY | Double Bottom, Adam and Eve | 12/19/2024 | 12/30/2024 | Drug | |
| INTC | Head-and-shoulders bottom | 12/11/2024 | 12/30/2024 | Semiconductor | |
| ISRG | Double Bottom, Eve and Eve | 12/20/2024 | 12/31/2024 | Medical Supplies | |
| KEYS | Double Bottom, Adam and Eve | 12/19/2024 | 01/02/2025 | Precision Instrument | |
| KLAC | Double Bottom, Eve and Adam | 11/19/2024 | 12/20/2024 | Semiconductor Cap Equip. | |
| LH | Double Bottom, Eve and Adam | 12/19/2024 | 01/03/2025 | Medical Services | |
| LDOS | Double Bottom, Eve and Eve | 12/20/2024 | 12/30/2024 | IT Services | |
| LXU | Double Top, Adam and Adam | 11/25/2024 | 12/03/2024 | Building Materials | |
| MTDR | Pipe bottom | 12/16/2024 | 12/23/2024 | Petroleum (Producing) | |
| MDT | Double Bottom, Eve and Eve | 12/19/2024 | 12/30/2024 | Medical Supplies | |
| META | Double Bottom, Adam and Eve | 12/20/2024 | 12/31/2024 | E-Commerce | |
| MU | Double Bottom, Eve and Adam | 12/20/2024 | 12/31/2024 | Semiconductor | |
| MOS | Head-and-shoulders complex top | 09/19/2024 | 12/13/2024 | Chemical (Diversified) | |
| MLI | Triangle, symmetrical | 12/05/2024 | 01/06/2025 | Metal Fabricating | |
| MYGN | Double Bottom, Eve and Eve | 12/19/2024 | 12/30/2024 | Biotechnology | |
| NFLX | Head-and-shoulders top | 12/06/2024 | 12/24/2024 | Internet | |
| NVDA | Ugly double bottom | 12/17/2024 | 12/31/2024 | Semiconductor | |
| QCOM | Head-and-shoulders bottom | 11/20/2024 | 01/02/2025 | Telecom. Equipment | |
| RMBS | Double Bottom, Adam and Eve | 12/20/2024 | 12/30/2024 | Semiconductor Cap Equip. | |
| RGLD | Head-and-shoulders bottom | 12/23/2024 | 01/06/2025 | Metals and Mining (Div.) | |
| SAIC | Double Bottom, Adam and Adam | 12/19/2024 | 12/30/2024 | IT Services | |
| SMTC | Rectangle top | 11/27/2024 | 01/08/2025 | Semiconductor Cap Equip. | |
| SHOP | Double Bottom, Adam and Eve | 12/20/2024 | 12/30/2024 | E-Commerce | |
| SKX | Double Bottom, Adam and Adam | 12/20/2024 | 12/30/2024 | Shoe | |
| SCCO | Double Bottom, Adam and Eve | 12/19/2024 | 12/30/2024 | Metals and Mining (Div.) | |
| SSYS | Double Top, Adam and Adam | 11/13/2024 | 12/13/2024 | Electronics | |
| SRDX | Triple top | 12/11/2024 | 01/06/2025 | Medical Supplies | |
| TGT | Ugly double bottom | 11/20/2024 | 12/20/2024 | Retail Store | |
| TECH | Double Bottom, Adam and Eve | 12/19/2024 | 01/03/2025 | Biotechnology | |
| TDC | Scallop, ascending and inverted | 11/19/2024 | 01/03/2025 | Computer Software and Svcs | |
| TMO | Head-and-shoulders bottom | 12/13/2024 | 12/30/2024 | Precision Instrument | |
| TKR | Double Bottom, Adam and Eve | 12/20/2024 | 01/03/2025 | Metal Fabricating | |
| WWD | Double Bottom, Adam and Adam | 12/20/2024 | 12/31/2024 | Precision Instrument |
![]()
$ $ $
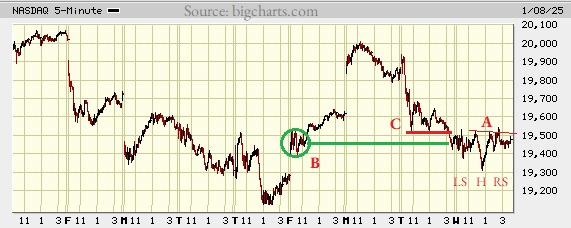
I show a picture of the Nasdaq composite on the 5-minute scale.
At A, we see the shape of a chart pattern called a head-and-shoulders bottom. Depending on what you think is the right shoulder (and neckline), the pattern either confirmed as valid or it hasn't.
I think it might have confirmed. A closer look of the chart shows that it closed above the neckline today around 2:30. You can see that on the chart as a little nubbin above the red line to the lower right of A.
At B, we see a knot of congestion that I believe has acted as support. The pattern at A seems to be hung up at or near the price of B.
At C, is a small pattern with a few valleys bottoming near the same price level. This might act as overhead resistance to a move higher. It has already impeded upward movement today, but maybe the index can push through it going higher, Frday.
Alternatively, we might see the index plummet to tie the low price on the chart. My guess is the index will rise.
$ $ $
Here's a symbol list of 141 chart and candlestick patterns (13 "investment grade" candle patterns) found in today's securities using my version of Patternz: AEIS, AMD, AES, ALRM, ALK, ALB, AA, ALKS, AMWD, ANIK, AR, APOG, ACGL, ADM, ATO, ADP, BSX, CE, CNC, CENX, CDAY, CINF, CSCO, CL, CMCO, CMTL, CAG, CXW, CRH, CSGS, CTS, XRAY, DFS, ^DJT, EBAY, EIX, ELV, EVH, EXC, EZPW, FIVN, GNW, GFS, GPRO, HBI, HE, HTLD, HL, HSII, JBHT, HUN, IDXX, ILMN, NSP, IIIN, PODD, TILE, IPG, JBLU, KBH, MAN, MU, MUR, ^IXIC, NJR, NWL, NKE, NWPX, NVDA, OMCL, ON, OMI, PKG, PANW, PKE, PCTY, PYPL, PPL, PEG, KWR, RNG, RLI, RCKY, ROG, R, SMG, SIGI, SRE, SMAR, SCCO, LUV, SR, SSYS, TJX, TSCO, TG, VC, WRB, WEX, WPM, WMB, WOLF, FTEC, QTEC, FXL, FXI, SOXX, EWO, EWH, EWM, EWD, EWL, EWT, TUR, PPA, PBE, ROBO, XRT, XLK, XLU, USO, SMH. Click this link for details (pattern type, start and end dates).
For a list of small patterns (those a few days wide) click this link.
$ $ $
The following table shows where Fibonacci retrace values of the day's high-low range are plus pivot points, calculated on the Nasdaq composite, sorted by value. When several are near each other (small differences), the area might act as support or resistance.
-- Thomas Bulkowski
![]()
| © 2025 ThePatternSite.com Metric | Value | Diff | Close (within 10% of the high-low range for the day)? |
| Monthly S2 | 18,513.36 | ||
| Weekly S2 | 18,890.64 | 377.28 | |
| Monthly S1 | 18,996.12 | 105.48 | |
| Weekly S1 | 19,184.76 | 188.64 | |
| Daily S2 | 19,208.01 | 23.25 | Yes! The Daily S2 is close to the Weekly S1. |
| Low | 19,308.54 | 100.53 | |
| Daily S1 | 19,343.45 | 34.91 | |
| 61.8% Down from Intraday High | 19,398.68 | 55.23 | |
| Weekly Pivot | 19,411.71 | 13.04 | Yes! The Weekly Pivot is close to the 61.8% Down from Intraday High. |
| 50% Down from Intraday High | 19,426.52 | 14.81 | Yes! The 50% Down from Intraday High is close to the Weekly Pivot. |
| Daily Pivot | 19,443.97 | 17.45 | Yes! The Daily Pivot is close to the 50% Down from Intraday High. |
| 38.2% Down from Intraday High | 19,454.36 | 10.39 | Yes! The 38.2% Down from Intraday High is close to the Daily Pivot. |
| Open | 19,469.36 | 15.00 | Yes! The Open is close to the 38.2% Down from Intraday High. |
| Close | 19,478.88 | 9.52 | Yes! The Close is close to the Open. |
| High | 19,544.50 | 65.62 | |
| Daily R1 | 19,579.41 | 34.91 | |
| Monthly Pivot | 19,600.35 | 20.94 | Yes! The Monthly Pivot is close to the Daily R1. |
| Daily R2 | 19,679.93 | 79.58 | |
| Weekly R1 | 19,705.83 | 25.90 | |
| Weekly R2 | 19,932.78 | 226.95 | |
| Monthly R1 | 20,083.11 | 150.33 | |
| Monthly R2 | 20,687.34 | 604.23 |
This is a picture of the chart pattern indicator on the daily scale. The indicator is the line chart below a chart of the S&P 500 composite.
The indicator slid from neutral to bearish today (Tuesday). The chart shows the signals, where a red vertical bar is bearish and the white ones are neutral.
Notice that on the prior red bar, about 2 weeks ago, it took 3 days before the index made a new low. Will that happen again?
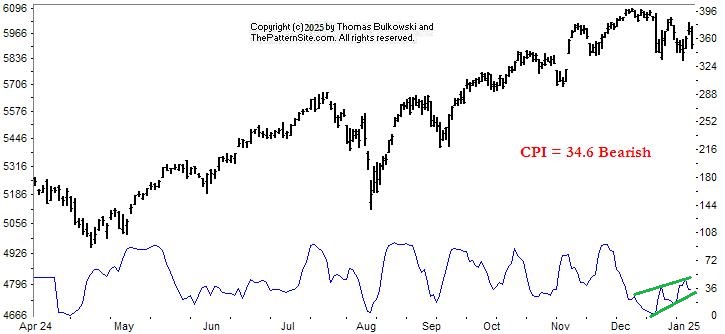
Here's the same chart without signal changes shown. A bearish CPI has a reading of 35 so this 34.6 tucked under that value.
Notice that the CPI line looks like a rising wedge pattern, where trendlines drawn along the peaks and valleys converge. A rising wedge has a downward breakout 60% of the time (in stocks, bull market).
What does this mean? I'd be cautious here and wait to see if the market begins a sustained retrace (move down).
$ $ $
Here's a symbol list of 179 chart and candlestick patterns (13 "investment grade" candle patterns) found in today's securities using my version of Patternz: DDD, MMM, ACIW, AMD, AES, ALRM, ALB, ALKS, ALL, AMZN, APOG, ANET, AGO, AVA, BFH, BCO, BLDR, BG, CALM, CX, CDAY, CIEN, CLNE, CLX, CNX, CL, CMCO, CMTL, CSGS, CTS, CW, DFS, EXP, EME, EXC, EZPW, FISV, FIVN, FCX, GFS, GPRO, HBI, THG, HLIT, HE, HQY, HTLD, HOLX, ILMN, INFN, IBKR, TILE, IPI, ISRG, JBLU, KALU, K, KSS, LZB, LH, LAMR, RAMP, LMT, LOW, MTSI, MAN, MCHX, MLM, MU, MS, ^IXIC, NWL, NOC, NWPX, NTNX, NVDA, OXY, OMCL, ASGN, ON, OXM, PATK, PCTY, PYPL, PG, PRU, PEG, PSTG, KWR, RMBS, RNG, RLI, RHI, ROG, RGLD, SAND, SCHW, SRE, SHOP, SLGN, SKX, SR, SXI, SSYS, SRDX, SNPS, TPR, TECH, TJX, TG, TREX, TWLO, UHAL, UNM, MDRX, VRSN, V, VC, WMT, WEX, WMB, XEL, ITA, IDU, FTEC, FDN, QTEC, FXL, FXI, BOTZ, QQQ, ICF, IXN, SOXX, EWO, EWK, EIS, EWD, EWL, EWT, THD, TUR, QLD, SSO, ROBO, XLK, XLU, SMH, MGK, VONG. Click this link for details (pattern type, start and end dates).
For a list of small patterns (those a few days wide) click this link.
-- Thomas Bulkowski
![]()
$ $ $
I show another slider trading quiz featuring Verisign 2: VRSN stock.
$ $ $
Here's a symbol list of 190 chart and candlestick patterns (13 "investment grade" candle patterns) found in today's securities using my version of Patternz: DDD, ACIW, ADTN, AEIS, AES, APD, ALK, ALGT, ALL, AEE, AMWD, ANIK, APA, APOG, AMAT, ANET, AGO, BSET, BCO, BRKR, CALM, CLS, CX, CENX, CF, CVX, CHD, CSCO, CLNE, CLF, CNX, CL, CMTL, COP, CTS, DDS, DFS, D, EXP, EME, EMR, EFX, EL, EVH, EZPW, FFIV, FIS, FISV, FLEX, FMC, FTNT, FWRD, FNV, FCX, GNW, GFS, GL, GOOGL, GPRO, GGG, GFF, THG, HOV, HURC, ITW, INCY, NSP, INTC, KEYS, KLAC, KSS, LRCX, LEN, LLY, LMT, LXU, MHO, MTSI, M, MGY, MAN, MKTX, MTDR, MRK, MU, MS, NOVT, NTNX, NVDA, OXY, OTEX, OMI, OXM, PTEN, PYPL, PEN, PCG, PNW, PINC, PG, PRU, QCOM, RL, RMBS, RGS, ROG, RGLD, RES, R, ^GSPC, CRM, SAND, SRE, SMTC, SHOP, SKX, SR, SXI, SNPS, TDY, TER, TOL, TDG, TG, UGI, MDRX, VRSN, V, WU, WMB, WSM, WOLF, WWD, XEL, ZBRA, ITA, IAI, IYE, IHE, IDU, QTEC, FXL, FXI, BOTZ, ICF, IXN, ILF, SOXX, IEO, EWA, EWZ, EWC, ECH, EWH, EIS, EWJ, EWW, EPP, EWY, EWD, EWT, THD, TUR, PPA, DBA, PXJ, SSO, ROBO, XLE, XLF, SPY, XLU, UNG, USO, SMH. Click this link for details (pattern type, start and end dates).
For a list of small patterns (those a few days wide) click this link.
$ $ $
The following table shows where Fibonacci retrace values of the day's high-low range are plus pivot points, calculated on the Dow industrials, sorted by value. When several are near each other (small differences), the area might act as support or resistance.
-- Thomas Bulkowski
![]()
| © 2025 ThePatternSite.com Metric | Value | Diff | Close (within 10% of the high-low range for the day)? |
| Monthly S2 | 40,381.54 | ||
| Monthly S1 | 41,544.05 | 1,162.51 | |
| Weekly S2 | 41,865.19 | 321.14 | |
| Weekly S1 | 42,285.88 | 420.68 | |
| Daily S2 | 42,306.86 | 20.98 | Yes! The Daily S2 is close to the Weekly S1. |
| Daily S1 | 42,506.71 | 199.85 | |
| Weekly Pivot | 42,595.48 | 88.77 | |
| Low | 42,611.16 | 15.68 | Yes! The Low is close to the Weekly Pivot. |
| Close | 42,706.56 | 95.40 | |
| 61.8% Down from Intraday High | 42,803.75 | 97.19 | |
| Daily Pivot | 42,811.01 | 7.27 | Yes! The Daily Pivot is close to the 61.8% Down from Intraday High. |
| Open | 42,835.52 | 24.51 | Yes! The Open is close to the Daily Pivot. |
| 50% Down from Intraday High | 42,863.23 | 27.71 | Yes! The 50% Down from Intraday High is close to the Open. |
| 38.2% Down from Intraday High | 42,922.73 | 59.49 | |
| Daily R1 | 43,010.86 | 88.13 | |
| Weekly R1 | 43,016.17 | 5.31 | Yes! The Weekly R1 is close to the Daily R1. |
| High | 43,115.31 | 99.14 | |
| Monthly Pivot | 43,308.84 | 193.53 | |
| Daily R2 | 43,315.16 | 6.32 | Yes! The Daily R2 is close to the Monthly Pivot. |
| Weekly R2 | 43,325.77 | 10.61 | Yes! The Weekly R2 is close to the Daily R2. |
| Monthly R1 | 44,471.35 | 1,145.58 | |
| Monthly R2 | 46,236.14 | 1,764.79 |
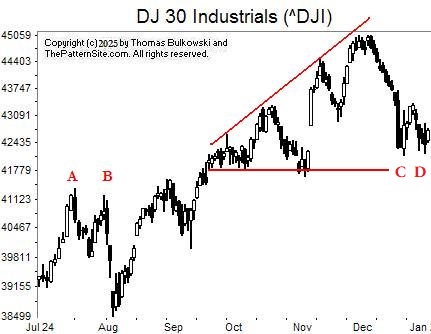
I show the Dow industrials on the daily charts.
At AB, we see a nice image of an Adam & Adam double top. It confirms as a valid chart pattern when the index closes below the valley between the two peaks.
The drop that followed looks to have met the measure rule target. The target is the height of the pattern subtracted from the low between the two peaks.
I drew a horizontal red line across support in October and early November, just to show where the index might find support should it fall that far.
For grins, I drew another trendline along the peaks. Together, a pattern forms, called a broadening formation, right-angled and ascending. Yes, it's not ideal because of no bottom trendline touches after November. However, the top trendline has a number of spread out touches. This would be a better looking pattern if I chopped it off after the bottom November touch, but sometimes it helps to extended the trendlines.
If the index drops, look for it to bounce off the bottom trendline. I think it might rise from here and form a double bottom. I highlight those bottoms at CD.
![]()
The following is a brief review of how the markets performed over time. The numbers refer to the close-to-close move in the Dow industrials.
No options expire this week.
![]()
The following is based on an SFO article in December 2004 by John Seekinger, titled, "Take a two-dimensional approach." He offers these tips.
| Index | S2 | S1 | Pivot | R1 | R2 |
| Dow Industrials (^DJI): Daily | 42,305 | 42,518 | 42,651 | 42,864 | 42,996 |
| Weekly | 41,874 | 42,303 | 42,604 | 43,033 | 43,334 |
| Monthly | 40,390 | 41,561 | 43,317 | 44,488 | 46,245 |
| S&P500 (^GSPC): Daily | 5,866 | 5,904 | 5,927 | 5,965 | 5,988 |
| Weekly | 5,787 | 5,865 | 5,907 | 5,985 | 6,027 |
| Monthly | 5,687 | 5,815 | 5,957 | 6,085 | 6,228 |
| Nasdaq (^IXIC): Daily | 19,288 | 19,455 | 19,547 | 19,714 | 19,806 |
| Weekly | 18,938 | 19,280 | 19,459 | 19,801 | 19,980 |
| Monthly | 18,561 | 19,091 | 19,648 | 20,178 | 20,735 |
Here are the formulas:
![]()
Earnings season will be starting in about 10 days.
Here's a symbol list of 110 chart and candlestick patterns (13 "investment grade" candle patterns) found in today's securities using my version of Patternz: ADBE, ALRM, ALB, AA, AEO, APA, APOG, ATR, BAH, BRKR, CACI, CX, COR, CENX, CTAS, CLF, CNX, CL, CXW, CSGS, EBAY, EVH, EZPW, FAST, FMC, IT, GL, GPRO, HTLD, HUBG, ITW, TILE, JAZZ, K, KELYA, KEYS, LHX, LDOS, MKTX, MTDR, MS, NTAP, JWN, NWPX, NUS, ORI, PATK, PRU, PHM, QCOM, RGS, RNG, ROG, R, SCHW, SIGI, SMAR, SCCO, LUV, SPSC, SSYS, SRDX, TRGP, TDC, TER, TXN, TMO, TJX, TOL, TSCO, TZOO, TREX, WERN, WSC, ZBRA, IYC, FXL, FXI, IXN, ILF, IYF, EWA, EWO, ECH, EIS, EWI, EWW, EPP, EZA, EWY, EWL, TUR, EWU, SSO, XLF, XRT, SPY, XLK. Click this link for details (pattern type, start and end dates).
For a list of small patterns (those a few days wide) click this link.
The below industries were the best (rank 1) or worst performing of those I follow.
|
-- Thomas Bulkowski
![]()
Here's a symbol list of 157 chart and candlestick patterns (13 "investment grade" candle patterns) found in today's securities using my version of Patternz: AYI, AFL, ALRM, ALGT, ALL, AEP, AFG, APH, ANIK, AON, APA, APOG, AAPL, ATR, ARCB, ASH, AIZ, AGO, BIIB, BRC, BCO, BBW, CBT, CPB, CE, CRL, CHKP, CHD, CI, CINF, CGNX, CL, GLW, CCK, CSGS, CTS, XRAY, DVN, FANG, DSGR, DOV, DTE, EL, EZPW, FDS, FAST, FRD, GME, GE, GGG, GES, HIG, HTLD, HP, HWM, HUBG, IEX, ITW, IPAR, TILE, KMT, LAMR, LDOS, LMT, M, MRTN, MTDR, META, MLKN, MUR, NFG, NTGR, NKE, NI, NWPX, NUS, NTNX, OUT, PKE, PTEN, PETS, PCG, POR, PPL, PG, PRU, RMBS, RHI, RCKY, ROG, RES, SAND, SCHW, SEE, SRE, SHW, SLGN, STR, SMAR, LUV, SWX, SCS, TDY, TER, TKR, TSCO, RIG, TZOO, TREX, UPS, VMI, WAT, WU, WLK, WWD, XEL, IYM, IYK, IYC, DDM, FXI, ICF, IGV, IEO, EWO, ECH, EWH, EIS, EWJ, EWM, EWY, THD, TUR, PXJ, SSO, XLP, XLB, XRT, UNG, USO, SMH, VAW. Click this link for details (pattern type, start and end dates).
For a list of small patterns (those a few days wide) click this link.
$ $ $
You can find setups based on a Fibonacci retrace by clicking on the link.
The following patterns were found manually, not using Patternz. Mr. Bulkowski has excluded any securities he owns from appearing in the list. However, he may add any of the securities listed to his portfolio at any time, just as you can.
In the table below, the red and green colors are based on the historical breakout direction for the associated chart pattern. If a high and tight flag appears, the start and end dates highlight the flagpole only and not the flag.
For details about the chart patterns, click here.
-- Thomas Bulkowski, author: Invest for Two-Comma Wealth and the novel (fiction), Foresight (#Ad)
![]()
| Symbol | Chart Pattern | Bullish Bearish | Start | End | Industry |
| AEO | Double Bottom, Adam and Adam | 12/20/2024 | 12/30/2024 | Apparel | |
| AR | Double Bottom, Eve and Eve | 12/06/2024 | 12/18/2024 | Natural Gas (Diversified) | |
| APA | Pipe bottom | 12/16/2024 | 12/23/2024 | Petroleum (Producing) | |
| ARW | Broadening top | 11/25/2024 | 12/16/2024 | Electronics | |
| CALM | Double Bottom, Adam and Adam | 12/23/2024 | 12/27/2024 | Food Processing | |
| CF | Double Bottom, Adam and Adam | 12/20/2024 | 12/30/2024 | Chemical (Basic) | |
| DSGR | Double Top, Eve and Eve | 10/16/2024 | 11/11/2024 | Metal Fabricating | |
| EPAM | Head-and-shoulders top | 11/25/2024 | 12/19/2024 | IT Services | |
| EQT | Double Bottom, Eve and Eve | 12/10/2024 | 12/19/2024 | Natural Gas (Diversified) | |
| FTV | Triple top | 11/25/2024 | 12/06/2024 | Industrial Services | |
| GIS | Triangle, symmetrical | 12/18/2024 | 01/02/2025 | Food Processing | |
| LOW | Double Top, Eve and Adam | 11/12/2024 | 12/09/2024 | Retail Building Supply | |
| M | Pipe bottom | 12/09/2024 | 12/16/2024 | Retail Store | |
| MANH | Double Top, Eve and Adam | 10/15/2024 | 12/12/2024 | IT Services | |
| MOS | Double Bottom, Eve and Adam | 12/23/2024 | 12/30/2024 | Chemical (Diversified) | |
| PEN | Falling wedge | 12/09/2024 | 12/30/2024 | Medical Supplies | |
| PSTG | Triangle, symmetrical | 12/05/2024 | 12/26/2024 | Computers and Peripherals | |
| ROP | Triple top | 07/23/2024 | 12/04/2024 | Industrial Services | |
| WDAY | Pipe top | 12/09/2024 | 12/16/2024 | Computer Software and Svcs |
![]()
$ $ $
Here's the updated 2025 market forecast, presented in slider format.
$ $ $
Here's a symbol list of 6 chart and candlestick patterns (13 "investment grade" candle patterns) found in today's securities using my version of Patternz: APA, EZPW, MTDR, ROG, TZOO, EWM. Click this link for details (pattern type, start and end dates).
For a list of small patterns (those a few days wide) click this link.
$ $ $
The following table shows where Fibonacci retrace values of the day's high-low range are plus pivot points, calculated on the Nasdaq composite, sorted by value. When several are near each other (small differences), the area might act as support or resistance.
-- Thomas Bulkowski
![]()
| © 2025 ThePatternSite.com Metric | Value | Diff | Close (within 10% of the high-low range for the day)? |
| Monthly S2 | 18,216.81 | ||
| Monthly S1 | 18,763.80 | 546.99 | |
| Weekly S2 | 19,063.12 | 299.32 | |
| Daily S2 | 19,105.66 | 42.55 | |
| Weekly S1 | 19,186.95 | 81.29 | |
| Daily S1 | 19,208.23 | 21.27 | Yes! The Daily S1 is close to the Weekly S1. |
| Low | 19,283.41 | 75.18 | |
| Close | 19,310.79 | 27.38 | Yes! The Close is close to the Low. |
| Daily Pivot | 19,385.97 | 75.18 | |
| 61.8% Down from Intraday High | 19,390.49 | 4.52 | Yes! The 61.8% Down from Intraday High is close to the Daily Pivot. |
| 50% Down from Intraday High | 19,423.56 | 33.08 | |
| 38.2% Down from Intraday High | 19,456.64 | 33.08 | |
| Monthly Pivot | 19,484.19 | 27.55 | Yes! The Monthly Pivot is close to the 38.2% Down from Intraday High. |
| Daily R1 | 19,488.54 | 4.35 | Yes! The Daily R1 is close to the Monthly Pivot. |
| Open | 19,551.36 | 62.82 | |
| High | 19,563.72 | 12.36 | Yes! The High is close to the Open. |
| Weekly Pivot | 19,628.52 | 64.80 | |
| Daily R2 | 19,666.28 | 37.77 | |
| Weekly R1 | 19,752.35 | 86.07 | |
| Monthly R1 | 20,031.18 | 278.83 | |
| Weekly R2 | 20,193.92 | 162.74 | |
| Monthly R2 | 20,751.57 | 557.65 |
Support this site! Clicking any of the books (below) takes you to
Amazon.com If you buy ANYTHING while there, they pay for the referral.
Legal notice for paid links: "As an Amazon Associate I earn from qualifying purchases."
|
My Stock Market Books
|
My Novels
Orb Foresight Rewrite Coming!
|