As of 04/17/2026
Indus: 49,447 +868.71 +1.8%
Trans: 22,422 +609.39 +2.8%
Utils: 1,158 -6.73 -0.6%
Nasdaq: 24,468 +365.78 +1.5%
S&P 500: 7,126 +84.78 +1.2%
|
YTD
+2.9%
+29.2%
+8.4%
+5.3%
+4.1%
|
|
As of 04/17/2026
Indus: 49,447 +868.71 +1.8%
Trans: 22,422 +609.39 +2.8%
Utils: 1,158 -6.73 -0.6%
Nasdaq: 24,468 +365.78 +1.5%
S&P 500: 7,126 +84.78 +1.2%
|
YTD
+2.9%
+29.2%
+8.4%
+5.3%
+4.1%
|
|
As of 04/17/2026
Indus: 49,447 +868.71 +1.8%
Trans: 22,422 +609.39 +2.8%
Utils: 1,158 -6.73 -0.6%
Nasdaq: 24,468 +365.78 +1.5%
S&P 500: 7,126 +84.78 +1.2%
|
YTD
+2.9%
+29.2%
+8.4%
+5.3%
+4.1%
| |
|
| ||
Below is the updated forecast for 2025 as of the close on February 3, 2025. Captions appear below the pictures for guidance, so be sure to scroll down far enough to read them.
On some of the charts (all except the CPI chart) the prediction in red is based on the work of Edgar Lawrence Smith in the 1930s. Smith said that the stock market followed a 10-year cycle. Each year tended to repeat the behavior of the year a decade earlier. In other words, if you averaged all years ending in 1 (2001, 1991, 1981 and so on), that would give you a forecast for 2011. For 2012, you'd make a similar average, only use 2002, 1992, 1982, and so on. That's what I did for the market forecast charts which follow.
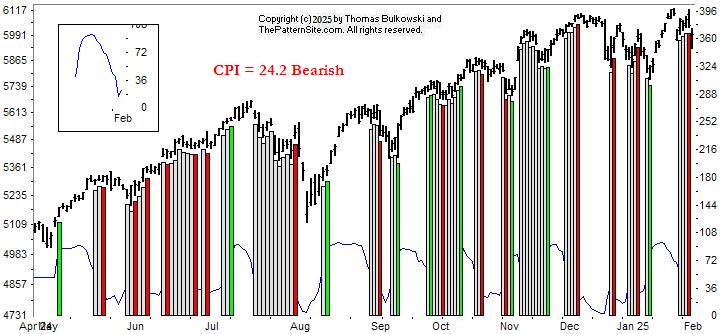
This is a chart of the Chart Pattern Indicator (CPI) on the daily scale.
The indicator turned bearish yesterday, but remember that signals can change for up to a week. So the bearish reading might not be bearish at all.
The inset on the upper left of the chart shows the CPI without signal changes. It hit a low and now sits at 24.2, which is bearish.
If you look at prior bottoms, those you can see on the thin blue line, the indicator doesn't stay down for long, so expect a bounce in the index.
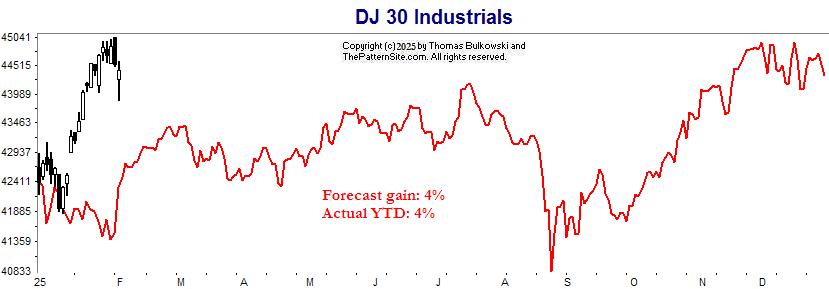
The Dow industrials are performing well this year by climbing 4%, meeting the forecast gain of 4% for the entire year. Notice that the forecast shows weakness during the first month even as a index climbed.
The forecast tumbles in late summer (August) with a sharp recovery thereafter.
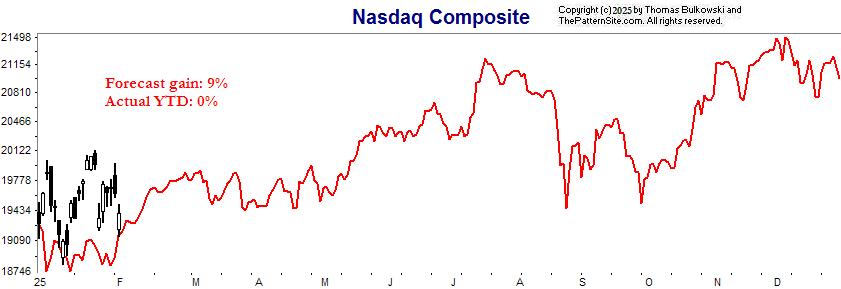
The forecast wobbled up and down during January. The Nasdaq had taller swings but has joined the forecast this month (so far).
The red forecast shows the index rising in a choppy manner, suffering during the summer to end the year 9% higher (if the prediction is correct).
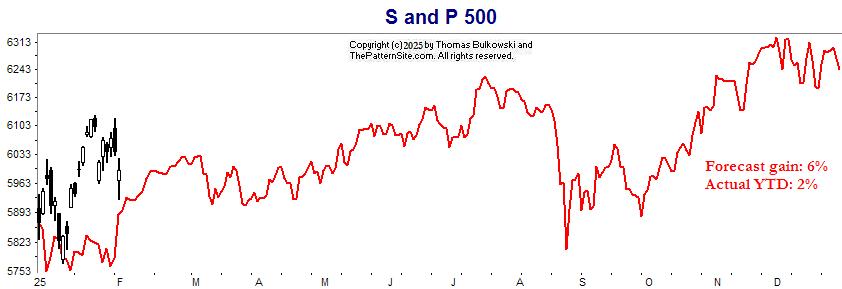
The forecast is close to the actual movement of the S&P index, although the paths diverged. The forecast gain for the year is 6%. We'll have to see how accurate it is next year.
Support this site! Clicking any of the books (below) takes you to
Amazon.com If you buy ANYTHING while there, they pay for the referral.
Legal notice for paid links: "As an Amazon Associate I earn from qualifying purchases."
|
My Stock Market Books
|
My Novels
Orb Foresight Rewrite Coming!
|