
As of 04/30/2026
Indus: 49,652 +790.33 +1.6%
Trans: 20,794 +262.22 +1.3%
Utils: 1,165 +22.58 +2.0%
Nasdaq: 24,892 +219.07 +0.9%
S&P 500: 7,209 +73.06 +1.0%
|
YTD
+3.3%
+19.8%
+9.1%
+7.1%
+5.3%
|
|
As of 04/30/2026
Indus: 49,652 +790.33 +1.6%
Trans: 20,794 +262.22 +1.3%
Utils: 1,165 +22.58 +2.0%
Nasdaq: 24,892 +219.07 +0.9%
S&P 500: 7,209 +73.06 +1.0%
|
YTD
+3.3%
+19.8%
+9.1%
+7.1%
+5.3%
| |
|
| ||
$ $ $
I show another slider trading quiz featuring Tribune Co. 2: TRB stock.
$ $ $
Here's a symbol list of 142 chart and candlestick patterns (13 "investment grade" candle patterns) found in today's securities using my version of Patternz: ABM, AXDX, AES, APD, AEE, AXP, AMN, ATR, ANET, AVNT, BAX, BIG, BIO, BIIB, BA, BRC, BRKR, BBW, BLDR, CBT, CACI, CAL, CNP, CVX, CMCO, CMTL, ED, CAG, CXW, COST, CCRN, CSGS, CTS, DHR, XRAY, DDS, DSGR, DUK, EIX, EL, EXPD, FLS, FWRD, GME, IT, GIS, GL, GES, HSC, HQY, HSII, HELE, HSIC, HOV, IPG, IPI, KFRC, KSS, LZB, LDOS, LNC, L, LXU, MRTN, MTRN, MSFT, MS, MOS, MLI, MUR, NTGR, NTAP, NEU, NEE, NI, ORI, OMC, ON, OTEX, OUT, OMI, PANW, PTEN, PCTY, PRFT, PETS, PFE, PPG, QCOM, DGX, RTX, RGA, RNG, RLI, RCKY, SLB, SCHW, SAIC, SMTC, SR, SPSC, SCS, SUM, TRGP, TJX, TZOO, TWLO, UIS, MDRX, VC, WEX, WOLF, WWW, IYM, IEZ, IHE, FXL, IHF, SLV, EWZ, EIS, TUR, DBA, XLP, XLB, UNG, VHT, VAW. Click this link for details (pattern type, start and end dates).
For a list of small patterns (those a few days wide) click this link.
$ $ $
The following table shows where Fibonacci retrace values of the day's high-low range are plus pivot points, calculated on the Dow industrials, sorted by value. When several are near each other (small differences), the area might act as support or resistance.
-- Thomas Bulkowski
![]()
| © 2023 ThePatternSite.com Metric | Value | Diff | Close (within 10% of the high-low range for the day)? |
| Monthly S2 | 31,597.87 | ||
| Weekly S2 | 32,021.21 | 423.34 | |
| Monthly S1 | 32,243.48 | 222.27 | |
| Weekly S1 | 32,455.15 | 211.67 | |
| Daily S2 | 32,589.08 | 133.93 | |
| Daily S1 | 32,739.09 | 150.00 | |
| Low | 32,814.18 | 75.09 | |
| Close | 32,889.09 | 74.91 | |
| Open | 32,906.16 | 17.07 | Yes! The Open is close to the Close. |
| 61.8% Down from Intraday High | 32,957.47 | 51.31 | |
| Daily Pivot | 32,964.18 | 6.71 | Yes! The Daily Pivot is close to the 61.8% Down from Intraday High. |
| 50% Down from Intraday High | 33,001.73 | 37.55 | |
| 38.2% Down from Intraday High | 33,045.99 | 44.26 | |
| Weekly Pivot | 33,077.42 | 31.43 | Yes! The Weekly Pivot is close to the 38.2% Down from Intraday High. |
| Daily R1 | 33,114.19 | 36.77 | Yes! The Daily R1 is close to the Weekly Pivot. |
| High | 33,189.28 | 75.09 | |
| Monthly Pivot | 33,289.09 | 99.81 | |
| Daily R2 | 33,339.29 | 50.20 | |
| Weekly R1 | 33,511.36 | 172.07 | |
| Monthly R1 | 33,934.70 | 423.34 | |
| Weekly R2 | 34,133.63 | 198.93 | |
| Monthly R2 | 34,980.31 | 846.68 |
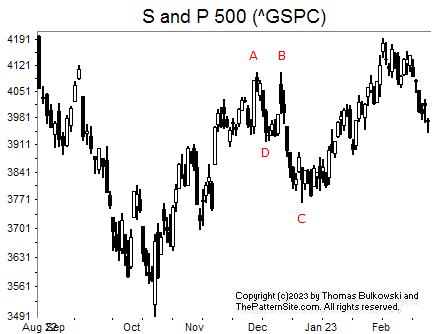
This is a chart of the S&P 500 index on the daily scale.
There's not a lot going on in this chart. At AB, we see a double top that confirms when the index closes below the low between the two peaks (D).
The height of the pattern from A (the higher of the two peaks) to D subtracted from D gives a target. A stock (not an index) reaches the target 64% of the time in a bull market. (I measured this).
In this case, the drop to C is either at or certainly near the target.
Since then, the index has climbed to the top of the chart and then retraced. No pattern appears during the span, at least none that come to mind.
To me, it looks as if the retrace of the climb from C to the top of the chart, is about halfway of the move. And that suggests we'll see a reversal here (meaning price should rise).
![]()
The following is a brief review of how the markets performed over time. The numbers refer to the close-to-close move in the Dow industrials.
No options expire this week.
![]()
The following is based on an SFO article in December 2004 by John Seekinger, titled, "Take a two-dimensional approach." He offers these tips.
| Index | S2 | S1 | Pivot | R1 | R2 |
| Dow Industrials (^DJI): Daily | 32,464 | 32,641 | 32,820 | 32,996 | 33,176 |
| Weekly | 31,997 | 32,407 | 33,053 | 33,463 | 34,110 |
| Monthly | 31,574 | 32,195 | 33,265 | 33,887 | 34,956 |
| S&P500 (^GSPC): Daily | 3,929 | 3,949 | 3,964 | 3,985 | 3,999 |
| Weekly | 3,879 | 3,925 | 3,988 | 4,034 | 4,098 |
| Monthly | 3,724 | 3,847 | 4,021 | 4,144 | 4,319 |
| Nasdaq (^IXIC): Daily | 11,288 | 11,341 | 11,388 | 11,441 | 11,488 |
| Weekly | 11,122 | 11,258 | 11,471 | 11,608 | 11,821 |
| Monthly | 10,133 | 10,764 | 11,517 | 12,148 | 12,901 |
Here are the formulas:
![]()
Earnings season is either underway or should be starting soon. The sessions could be more volatile.
Here's a symbol list of 188 chart and candlestick patterns (13 "investment grade" candle patterns) found in today's securities using my version of Patternz: AXDX, ACN, ADBE, ATSG, AKAM, ALK, AA, AYX, AME, APOG, AAPL, ATR, ARW, AIZ, AGO, AVNT, BBBY, BBY, BKH, BA, BRKR, BBW, CAL, CIEN, CINF, CTAS, CLX, CNO, CMCO, CXW, CSGP, CSGS, CMI, D, DTE, EIX, EMR, EOG, EFX, EL, EXC, FFIV, FARO, FWRD, FCX, FRD, GPS, GE, GILD, GPN, GGG, GFF, HBI, HIG, HE, HSII, HELE, HSIC, HURC, IEX, IDXX, INFN, NSP, IIIN, IPG, IPI, KALU, KELYA, LNC, RAMP, LXU, MAN, MAS, MDT, MSFT, NCR, NFLX, NTGR, NEWR, JWN, NUS, OLN, ON, OXM, PANW, PDCO, PCTY, PKI, PFE, PLXS, PPL, PSTG, DGX, RRC, RGS, RNG, SBH, SMTC, SCI, SHW, SWX, SWN, SUM, TMO, TKR, TREX, TWLO, SLCA, VLO, VRSN, WERN, WU, WEX, WWW, IYK, IYC, IHE, DDM, FTEC, FXI, IYH, IHF, IAT, IYZ, IGV, SLV, IGE, IYF, EWA, EWO, EWK, EWZ, ECH, EEM, EWQ, EWG, EWH, EWI, EWJ, EPP, EWS, EZA, EWD, EWL, EWT, THD, TUR, EWU, DBA, PBE, PEJ, PJP, PHO, IEV, IXN, ILF, MXI, GLD, XHB, XLI, MGK. Click this link for details (pattern type, start and end dates).
For a list of small patterns (those a few days wide) click this link.
The below industries were the best (rank 1) or worst performing of those I follow.
|
-- Thomas Bulkowski
![]()
$ $ $
Here's a symbol list of 144 chart and candlestick patterns (13 "investment grade" candle patterns) found in today's securities using my version of Patternz: ADTN, AFL, ALGT, AYX, AEL, AFG, ABC, AME, AON, ATR, AIZ, AVNT, BBBY, BIIB, BMRN, BRKR, BBW, CAL, CRL, CINF, CTAS, CXW, CSGP, CCRN, CSGS, CTS, CW, DECK, ^DJI, DUK, EBAY, EIX, EME, EMR, EFX, EVH, FDX, FISV, FWRD, FCX, FRD, GPS, GD, GPRO, HELE, HSIC, HUM, IDA, IEX, INFN, NSP, IBKR, IPG, IPI, KALU, KEYS, KLIC, RAMP, LPLA, LXU, M, MSFT, MYGN, NFLX, NTGR, NI, JWN, NUS, NVDA, ON, PANW, PDCO, PYPL, PETS, PCG, PPL, PSTG, KWR, DGX, RL, RGA, RNG, RCKY, ROP, SCHW, SHW, STR, SR, SXI, SCS, SUM, TRGP, TGT, TEVA, TJX, RIG, TWLO, UGI, UPS, WU, WEX, WWW, WWD, IAI, IYK, IYC, DDM, FXI, ICF, IHF, IAT, IYZ, IYF, EWH, EWJ, EWM, EWS, TUR, EWU, DBA, PEJ, PXJ, PHO, MXI, XLP, XLI, XLB, USO. Click this link for details (pattern type, start and end dates).
For a list of small patterns (those a few days wide) click this link.
$ $ $
You can find setups based on a Fibonacci retrace by clicking on the link.
The following patterns were found manually, not using Patternz. Mr. Bulkowski has excluded any securities he owns from appearing in the list. However, he may add any of the securities listed to his portfolio at any time, just as you can.
In the table below, the red and green colors are based on the historical breakout direction for the associated chart pattern. If a high and tight flag appears, the start and end dates highlight the flagpole only and not the flag.
For details about the chart patterns, click here.
-- Thomas Bulkowski
![]()
| Symbol | Chart Pattern | Bullish Bearish | Start | End | Industry |
| ABM | Three Rising Valleys | 12/14/2022 | 02/10/2023 | Industrial Services | |
| ACIW | Triple top | 01/23/2023 | 02/07/2023 | IT Services | |
| ALB | Double Top, Eve and Adam | 02/03/2023 | 02/16/2023 | Chemical (Diversified) | |
| ARCB | Double Top, Eve and Eve | 02/07/2023 | 02/16/2023 | Trucking/Transp. Leasing | |
| AGO | Triangle, symmetrical | 01/19/2023 | 02/23/2023 | Insurance (Life) | |
| BAH | Triangle, symmetrical | 01/26/2023 | 02/15/2023 | IT Services | |
| BLDR | Triple top | 02/02/2023 | 02/15/2023 | Retail Building Supply | |
| CHS | Head-and-shoulders top | 01/26/2023 | 02/16/2023 | Apparel | |
| CXW | Pipe top | 02/06/2023 | 02/13/2023 | Industrial Services | |
| CSGP | Triangle, symmetrical | 01/06/2023 | 02/21/2023 | Information Services | |
| FANG | Triple bottom | 12/09/2022 | 01/04/2023 | Petroleum (Producing) | |
| ^DJI | Broadening top | 02/02/2023 | 02/17/2023 | None | |
| FLEX | Rectangle top | 01/11/2023 | 02/23/2023 | Electronics | |
| GMS | Double Top, Adam and Eve | 02/02/2023 | 02/16/2023 | Cement and Aggregates | |
| GOOGL | Pipe top | 01/30/2023 | 02/06/2023 | Internet | |
| GPRO | Pipe top | 01/30/2023 | 01/30/2023 | Electronics | |
| GFF | Pipe top | 01/30/2023 | 02/06/2023 | Building Materials | |
| GES | Head-and-shoulders top | 01/18/2023 | 02/15/2023 | Apparel | |
| TILE | Dead-cat bounce | 02/22/2023 | 02/22/2023 | Furn/Home Furnishings | |
| IPI | Horn top | 01/30/2023 | 02/13/2023 | Chemical (Diversified) | |
| KALU | Head-and-shoulders top | 01/18/2023 | 02/16/2023 | Metals and Mining (Div.) | |
| KEYS | Triple top | 12/13/2022 | 02/16/2023 | Precision Instrument | |
| LHX | Head-and-shoulders top | 02/01/2023 | 02/21/2023 | Aerospace/Defense | |
| RAMP | Pipe top | 01/30/2023 | 02/06/2023 | Computer Software and Svcs | |
| LXU | Big W | 01/20/2023 | 02/10/2023 | Building Materials | |
| NOC | Ugly double bottom | 01/27/2023 | 02/16/2023 | Aerospace/Defense | |
| NTNX | Head-and-shoulders top | 02/03/2023 | 02/15/2023 | E-Commerce | |
| OUT | Pipe top | 01/30/2023 | 02/06/2023 | Advertising | |
| PAYX | Triple top | 01/13/2023 | 02/02/2023 | IT Services | |
| PKI | Double Top, Adam and Adam | 02/02/2023 | 02/14/2023 | Precision Instrument | |
| POR | Double Bottom, Adam and Adam | 01/20/2023 | 02/16/2023 | Electric Utility (West) | |
| PPG | Triangle, descending | 01/26/2023 | 02/23/2023 | Chemical (Diversified) | |
| SRE | Triangle, symmetrical | 12/13/2022 | 02/23/2023 | Electric Utility (West) | |
| LUV | Head-and-shoulders top | 01/18/2023 | 02/02/2023 | Air Transport | |
| SUM | Double Top, Eve and Adam | 02/02/2023 | 02/15/2023 | Cement and Aggregates | |
| TJX | Double Top, Eve and Eve | 01/09/2023 | 01/26/2023 | Retail Store | |
| UGI | Pipe top | 01/30/2023 | 02/06/2023 | Natural Gas (Distributor) | |
| V | Head-and-shoulders top | 01/27/2023 | 02/09/2023 | Financial Services | |
| VC | Broadening top | 02/02/2023 | 02/16/2023 | Electronics | |
| WLK | Double Top, Eve and Eve | 02/03/2023 | 02/16/2023 | Chemical (Basic) | |
| QTEC | Double Top, Adam and Adam | 02/02/2023 | 02/15/2023 | Electronics | |
| SOXX | Three Falling Peaks | 02/02/2023 | 02/15/2023 | Semiconductor | |
| XLK | Triple top | 02/03/2023 | 02/14/2023 | IT Services |
![]()
Since I post this the night before, check how the futures are trading before market open. Large moves can affect the opening direction.
$ $ $
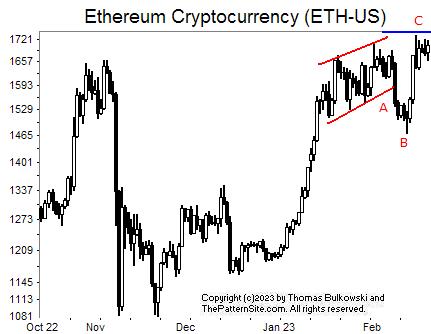
I show a picture of Ethereum on the daily scale.
The cryptocurrency formed a channel at A. They can slope either up or down, but not horizontally. If they travel horizontally, they are rectangles.
This one slopes up and it has a downward breakout that takes price down to B. Following that, the currency pulls back to C. There, it forms a knot (directly under C) as it bumps up against overhead resistance. I show that resistance with a horizontal blue line.
What comes next? Usually after a pullback, the stock continues rising, but the percentages of advancing versus dropping are nearly 50-50 (47% move lower). Cryptocurrencies may act differently.
My guess: Because the currency is at overhead resistance, I vote for a drop.
$ $ $
Here's a symbol list of 152 chart and candlestick patterns (13 "investment grade" candle patterns) found in today's securities using my version of Patternz: AXDX, ACN, ALGT, AYX, AEL, ABC, AME, APH, ATR, AIZ, AVNT, AVA, BMI, BSET, BBY, BMRN, BFH, BCO, BRKR, BBW, CAL, CRL, CHD, CTSH, COP, CXW, CSGP, COST, ^DJT, ^DJI, DRQ, EMR, EXPI, EXPD, FDX, FORM, FTV, FWRD, FDP, GME, GPS, GS, GOOGL, GFF, HLIT, HELE, HSIC, HSY, HD, HWM, IDXX, IIIN, INTC, IBKR, TILE, IPI, IRM, K, KEYS, KFRC, LZB, RAMP, LXU, MRO, MKTX, MTDR, MTRX, MGEE, MSFT, MOS, MYGN, NWL, NXGN, OXY, ON, OXM, PANW, PDCO, PAYX, PSTG, RTX, RNG, RCKY, CRM, SLB, SMTC, SLGN, LUV, SUM, TTD, TJX, TDG, RIG, TWLO, UGI, UPS, VMI, MDRX, VRSN, WEX, WWW, WDAY, IAI, IYE, DDM, FXL, FXI, IAT, IGE, IEO, IYF, EIS, EWI, EWJ, EWM, EPP, EWS, EZA, EWY, EWT, TUR, DBA, PBE, PXJ, PHO, IXN, MXI, XLP, XLE, XHB, XLI. Click this link for details (pattern type, start and end dates).
For a list of small patterns (those a few days wide) click this link.
$ $ $
The following table shows where Fibonacci retrace values of the day's high-low range are plus pivot points, calculated on the Nasdaq composite, sorted by value. When several are near each other (small differences), the area might act as support or resistance.
-- Thomas Bulkowski
![]()
| © 2023 ThePatternSite.com Metric | Value | Diff | Close (within 10% of the high-low range for the day)? |
| Monthly S2 | 10,062.08 | ||
| Monthly S1 | 10,784.58 | 722.49 | |
| Weekly S2 | 11,352.44 | 567.87 | |
| Daily S2 | 11,374.24 | 21.79 | |
| Weekly S1 | 11,429.76 | 55.52 | |
| Daily S1 | 11,440.65 | 10.90 | Yes! The Daily S1 is close to the Weekly S1. |
| Low | 11,445.17 | 4.52 | Yes! The Low is close to the Daily S1. |
| 61.8% Down from Intraday High | 11,497.64 | 52.47 | |
| Close | 11,507.07 | 9.43 | Yes! The Close is close to the 61.8% Down from Intraday High. |
| Daily Pivot | 11,511.59 | 4.52 | Yes! The Daily Pivot is close to the Close. |
| 50% Down from Intraday High | 11,513.84 | 2.26 | Yes! The 50% Down from Intraday High is close to the Daily Pivot. |
| Open | 11,517.20 | 3.36 | Yes! The Open is close to the 50% Down from Intraday High. |
| Monthly Pivot | 11,527.06 | 9.86 | Yes! The Monthly Pivot is close to the Open. |
| 38.2% Down from Intraday High | 11,530.05 | 2.99 | Yes! The 38.2% Down from Intraday High is close to the Monthly Pivot. |
| Daily R1 | 11,578.00 | 47.95 | |
| High | 11,582.52 | 4.52 | Yes! The High is close to the Daily R1. |
| Daily R2 | 11,648.94 | 66.42 | |
| Weekly Pivot | 11,750.52 | 101.59 | |
| Weekly R1 | 11,827.84 | 77.31 | |
| Weekly R2 | 12,148.60 | 320.77 | |
| Monthly R1 | 12,249.56 | 100.95 | |
| Monthly R2 | 12,992.04 | 742.49 |
This is a picture of the chart pattern indicator on the daily scale. The indicator is the line chart below a chart of the S&P 500 composite.
The CPI has turned bearish when the recent retrace began (that is, three days ago). I expect this to have lasting power, judging by what happened in December when we got a dual bearish signal, separated only by the neutral zone.
This chart is bearish.
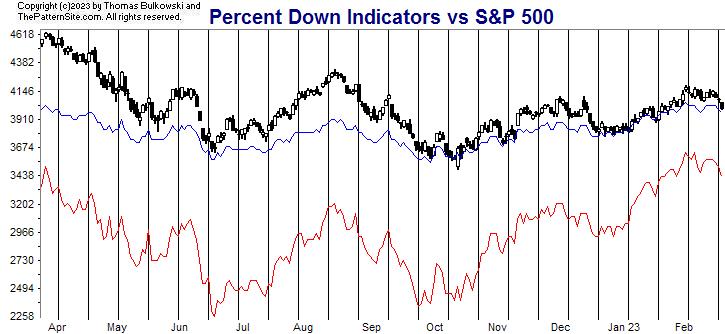
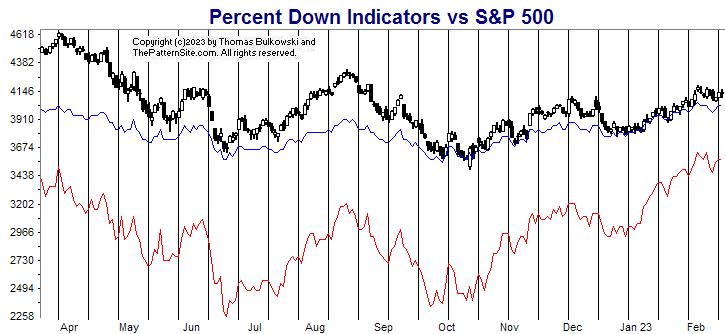
The red line is the percentage of stocks at least 20% below their 1-year high (plotted upside down). The blue line is the average percentage drop of stocks below their 1-year high (plotted upside down).
On Tuesday, 39% of stocks in my database are in bear market territory (down at least 20% from their 1-year high).A week ago, it was 34%.The fewest was 32% on 02/02/2023.And the most was 81% on 06/17/2022.
The 520 stocks in my database are down an average of 20% from their yearly high.A week ago, the average was 18%.The peak was 17% on 02/02/2023.And the bottom was 34% on 09/30/2022.
Both the red and blue lines are bearish this week compared to the same day last week. Notice that we hit a peak in the red line in late January and the index also shared a high. Since then, both have retraced.
That retrace suggests the red line might drop to 3202, the site of the late November peak. I don't know what that would equate to on the index, but it appears to be where the index resides now. I say that by finding the red line peak and looking at the index directly above it.
I'm looking for the journey back to the corrective phase of a measured move up chart pattern. In stocks, we see that kind of retrace often and it's reliable. Maybe we'll see that here in the red line.
$ $ $
Here's a symbol list of 191 chart and candlestick patterns (13 "investment grade" candle patterns) found in today's securities using my version of Patternz: ANF, AXDX, ACN, ACIW, ADBE, ADTN, AMD, ATSG, AA, AYX, AMZN, AEL, AMN, ANIK, AR, APOG, BMI, BECN, BZH, BIG, BMRN, BBW, BLDR, CAL, CE, CVX, CLNE, CGNX, CTSH, CMCO, CXW, CRH, CCK, CTS, FANG, DRQ, EMR, EQT, EXPI, EXPD, FARO, FAST, FORM, FTV, FCX, FRD, GPS, GL, GS, GOOGL, GFF, HLIT, HD, HON, HWM, HUN, HURC, IIIN, INTC, IBKR, INTU, IRM, KMT, KSS, KLIC, LRCX, LNC, RAMP, MGY, MTDR, MTRX, MSFT, MLI, MUR, MYGN, NOV, NTAP, NVDA, OXY, ON, OMI, PKG, PANW, PAYX, PKI, PXD, POR, PPG, PFG, PGR, PRU, PSTG, QCOM, RTX, RCKY, RES, SRE, SMTC, SHW, SHOP, SLGN, STR, LUV, SSYS, SUM, TPR, TRGP, TGT, RIG, TZOO, TREX, TWLO, SLCA, UPS, WU, WMB, WOLF, ITA, IYM, IYC, IYE, IEZ, IDU, DDM, FTEC, FDN, QTEC, FXL, FXI, BOTZ, IAT, IGV, SOXX, IGE, IYF, EWK, EEM, EWH, EIS, EWW, EPP, EWS, EZA, EWD, EWT, TUR, QLD, DBA, PBE, PXJ, PJP, PHO, ROBO, IXC, IXN, MXI, XLE, XHB, XLB, XLK, UNG, SMH, MGK. Click this link for details (pattern type, start and end dates).
For a list of small patterns (those a few days wide) click this link.
-- Thomas Bulkowski
![]()
$ $ $
I show another slider trading quiz featuring Tribune Co.: TRB stock.
$ $ $
I posted a new pre-release version of Patternz (version 7.0.0.47) to the website. It supports Weinstein Stages (or my version of them). If you're a stage user, then let me know what you think. You'll find it on the List Form, Filters button.
$ $ $
Here's a symbol list of 146 chart and candlestick patterns (13 "investment grade" candle patterns) found in today's securities using my version of Patternz: ABT, AXDX, ADBE, AMD, AJRD, AA, AYX, AMZN, AEL, AXP, AIG, APA, AWI, BECN, BZH, BIG, BIO, BA, BCO, CBT, CVX, CLF, CL, COP, CXW, CCRN, CCK, DVN, FANG, DFS, ^DJI, DTE, EME, EOG, RE, XOM, FDS, FARO, FAST, FORM, FWRD, FCX, FDP, FRD, GPS, GL, GOOGL, GFF, HSII, HWM, ITGR, INTC, IPG, INTU, KMT, KLIC, LNC, RAMP, LXU, MGY, MTDR, MTRX, MSFT, MCO, MUR, NOV, NFLX, NEU, NXGN, JWN, OXY, OUT, OMI, PCTY, PYPL, PRFT, PXD, PPL, PG, PRU, PEG, QCOM, RMBS, RES, ^GSPC, CRM, SLB, SMTC, SHW, SHOP, STR, SR, TSCO, TWLO, SLCA, UGI, VLO, VRSN, V, WMT, WERN, WWW, ITA, IYM, IYE, IEZ, IHE, IDU, DDM, FXI, BOTZ, IYH, IGE, IEO, EWK, ECH, EEM, EWH, EIS, EWM, EPP, DBA, PXJ, IXN, SSO, XLP, XLE, XLB, SPY, XAR, UNG, USO. Click this link for details (pattern type, start and end dates).
For a list of small patterns (those a few days wide) click this link.
$ $ $
The following table shows where Fibonacci retrace values of the day's high-low range are plus pivot points, calculated on the Dow industrials, sorted by value. When several are near each other (small differences), the area might act as support or resistance.
-- Thomas Bulkowski
![]()
| © 2023 ThePatternSite.com Metric | Value | Diff | Close (within 10% of the high-low range for the day)? |
| Monthly S2 | 32,312.59 | ||
| Monthly S1 | 33,069.64 | 757.05 | |
| Weekly S2 | 33,078.22 | 8.58 | Yes! The Weekly S2 is close to the Monthly S1. |
| Daily S2 | 33,401.44 | 323.22 | |
| Weekly S1 | 33,452.46 | 51.02 | |
| Low | 33,517.73 | 65.27 | |
| Daily S1 | 33,614.07 | 96.34 | |
| 61.8% Down from Intraday High | 33,643.38 | 29.31 | Yes! The 61.8% Down from Intraday High is close to the Daily S1. |
| Open | 33,677.01 | 33.64 | |
| 50% Down from Intraday High | 33,682.18 | 5.17 | Yes! The 50% Down from Intraday High is close to the Open. |
| Monthly Pivot | 33,705.98 | 23.80 | Yes! The Monthly Pivot is close to the 50% Down from Intraday High. |
| 38.2% Down from Intraday High | 33,721.00 | 15.02 | Yes! The 38.2% Down from Intraday High is close to the Monthly Pivot. |
| Daily Pivot | 33,730.35 | 9.36 | Yes! The Daily Pivot is close to the 38.2% Down from Intraday High. |
| Close | 33,826.69 | 96.34 | |
| High | 33,846.64 | 19.95 | Yes! The High is close to the Close. |
| Weekly Pivot | 33,891.96 | 45.32 | |
| Daily R1 | 33,942.98 | 51.01 | |
| Daily R2 | 34,059.26 | 116.29 | |
| Weekly R1 | 34,266.20 | 206.93 | |
| Monthly R1 | 34,463.03 | 196.84 | |
| Weekly R2 | 34,705.70 | 242.67 | |
| Monthly R2 | 35,099.37 | 393.67 |
$ $ $
Here's a symbol list of 88 chart and candlestick patterns (13 "investment grade" candle patterns) found in today's securities using my version of Patternz: ABT, AKAM, ALK, ALKS, AYX, AEE, AIG, AMN, AWI, AIZ, AVNT, BZH, BKH, BMY, CBT, CVX, CI, CSCO, CXW, CROX, CCRN, DVN, FANG, D, DUK, EME, FWRD, GME, GPS, GOOGL, GFF, HSII, HD, INCY, IPG, IPI, NVTA, KELYA, KMT, KEYS, LH, LDOS, LLY, RAMP, MTRN, MTRX, MGEE, NEU, JWN, NWPX, OUT, OMI, PKE, PCTY, PEN, PINC, DGX, RMBS, REGN, RNG, SAIA, SLB, SMG, SHW, SR, TG, TWLO, UGI, UNM, VLO, VMI, WAT, WSO, WERN, ZBRA, IYE, IEZ, IHE, EWM, USO. Click this link for details (pattern type, start and end dates).
For a list of small patterns (those a few days wide) click this link.
$ $ $
You can find setups based on a Fibonacci retrace by clicking on the link.
The following patterns were found manually, not using Patternz. Mr. Bulkowski has excluded any securities he owns from appearing in the list. However, he may add any of the securities listed to his portfolio at any time, just as you can.
In the table below, the red and green colors are based on the historical breakout direction for the associated chart pattern. If a high and tight flag appears, the start and end dates highlight the flagpole only and not the flag.
For details about the chart patterns, click here.
-- Thomas Bulkowski
![]()
| Symbol | Chart Pattern | Bullish Bearish | Start | End | Industry |
| ANF | Scallop, ascending | 12/13/2022 | 01/09/2023 | Apparel | |
| A | Triangle, symmetrical | 01/26/2023 | 02/14/2023 | Precision Instrument | |
| AMED | Ugly double bottom | 01/11/2023 | 01/25/2023 | Medical Services | |
| BALL | Diamond top | 01/19/2023 | 02/16/2023 | Packaging and Container | |
| BMRN | Pipe top | 01/23/2023 | 01/30/2023 | Biotechnology | |
| BA | Broadening top, right-angled and ascending | 01/10/2023 | 02/14/2023 | Aerospace/Defense | |
| CPB | Triangle, symmetrical | 01/31/2023 | 02/16/2023 | Food Processing | |
| CLS | Triangle, symmetrical | 01/26/2023 | 02/16/2023 | Electronics | |
| CTAS | Head-and-shoulders bottom | 01/05/2023 | 02/07/2023 | Industrial Services | |
| CSCO | Head-and-shoulders bottom | 01/05/2023 | 02/09/2023 | Computers and Peripherals | |
| EMN | Roof, inverted | 01/09/2023 | 02/15/2023 | Chemical (Diversified) | |
| EME | Pipe bottom | 06/13/2022 | 06/21/2022 | Industrial Services | |
| FLEX | Scallop, ascending | 12/14/2022 | 01/17/2023 | Electronics | |
| HSIC | Double Top, Adam and Eve | 02/02/2023 | 02/14/2023 | Medical Supplies | |
| HON | Triangle, descending | 01/20/2023 | 02/16/2023 | Aerospace/Defense | |
| IEX | Double Top, Eve and Eve | 01/17/2023 | 01/31/2023 | Machinery | |
| MTRX | Pipe top | 01/30/2023 | 02/06/2023 | Oilfield Svcs/Equipment | |
| NOV | Triangle, descending | 01/24/2023 | 02/16/2023 | Oilfield Svcs/Equipment | |
| POR | Triple top | 12/13/2022 | 01/12/2023 | Electric Utility (West) | |
| PRU | Diamond top | 01/27/2023 | 02/16/2023 | Insurance (Life) | |
| PSTG | Big W | 01/24/2022 | 02/24/2022 | Computers and Peripherals | |
| DGX | Head-and-shoulders bottom | 01/25/2023 | 02/14/2023 | Medical Services | |
| RNG | Dead-cat bounce | 02/16/2023 | 02/16/2023 | Computer Software and Svcs | |
| RES | Triangle, symmetrical | 11/11/2022 | 02/16/2023 | Oilfield Svcs/Equipment | |
| SHOP | Triple bottom | 06/14/2022 | 07/15/2022 | E-Commerce | |
| TECH | Triple top | 11/11/2022 | 01/11/2023 | Biotechnology | |
| TTD | Ugly double bottom | 07/14/2022 | 07/29/2022 | Advertising | |
| ZBRA | Triple top | 11/23/2022 | 12/13/2022 | Computers and Peripherals |
![]()
Since I post this the night before, check how the futures are trading before market open. Large moves can affect the opening direction.
$ $ $
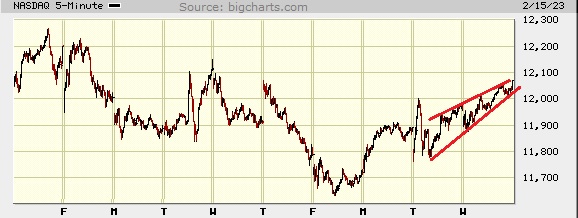
I show a picture of the Nasdaq composite on the 5-minute scale.
I identified and highlight one chart pattern, shown here in red. Do you know it's name?
Answer: a rising wedge. Those breakout downward most often (60% of the time). Will this one be the same?
If you believe the CPI (chart pattern indicator), the the answer is probably. The CPI turned neutral, erasing a bullish signal a few days ago and changing it bearish. That makes me believe the bias is downward.
$ $ $
Here's a symbol list of 155 chart and candlestick patterns (13 "investment grade" candle patterns) found in today's securities using my version of Patternz: ABT, ACN, AJRD, ALL, AYX, DOX, AIG, AME, APOG, ATR, ARCB, AWI, AGO, ADP, AVY, AVNT, AZTA, BCPC, BZH, BKNG, BAH, BFH, BBW, CBT, CAL, CNP, CENX, CVX, CLNE, CLX, CNA, CCRN, CCK, CW, DVN, FANG, DSGR, DTE, EXP, WIRE, EOG, RE, FDS, FAST, FIVN, FLS, FMC, FWRD, FDP, GPS, GILD, GS, GOOGL, GGG, GFF, HAYN, HTLD, HSII, HELE, HSY, HURC, IEX, ITW, ILMN, NSP, PODD, IPG, IPI, KMT, LAMR, LEG, LNC, RAMP, MRO, MLM, MAS, MTRX, NFG, NOV, NCR, NJR, NEU, NXGN, JWN, NUS, OUT, PCTY, PETS, PXD, PLXS, PGR, PRU, PEG, PHM, RMBS, REGN, RGA, RNG, SAIA, SLB, SAIC, SIGI, SMTC, SLGN, STR, SKYW, SWX, SR, SSYS, TDY, TPX, TTD, UGI, VLO, WMT, WAT, WERN, WLK, WSM, XEL, IYE, IDU, DDM, FXI, IHF, IAT, IEO, EWA, ECH, EEM, EWH, EWJ, EPP, EWS, EZA, EWY, EWT, THD, TUR, PBE, ILF, XLE, GLD, USO. Click this link for details (pattern type, start and end dates).
For a list of small patterns (those a few days wide) click this link.
$ $ $
The following table shows where Fibonacci retrace values of the day's high-low range are plus pivot points, calculated on the Nasdaq composite, sorted by value. When several are near each other (small differences), the area might act as support or resistance.
-- Thomas Bulkowski
![]()
| © 2023 ThePatternSite.com Metric | Value | Diff | Close (within 10% of the high-low range for the day)? |
| Monthly S2 | 9,530.55 | ||
| Monthly S1 | 10,800.57 | 1,270.02 | |
| Weekly S2 | 11,430.77 | 630.20 | |
| Monthly Pivot | 11,535.06 | 104.29 | |
| Weekly S1 | 11,750.68 | 215.62 | |
| Daily S2 | 11,811.76 | 61.08 | |
| Low | 11,876.82 | 65.06 | |
| Open | 11,905.12 | 28.30 | |
| Daily S1 | 11,941.18 | 36.06 | |
| Weekly Pivot | 11,950.45 | 9.27 | Yes! The Weekly Pivot is close to the Daily S1. |
| 61.8% Down from Intraday High | 11,951.11 | 0.66 | Yes! The 61.8% Down from Intraday High is close to the Weekly Pivot. |
| 50% Down from Intraday High | 11,974.05 | 22.95 | |
| 38.2% Down from Intraday High | 11,997.00 | 22.95 | |
| Daily Pivot | 12,006.23 | 9.23 | Yes! The Daily Pivot is close to the 38.2% Down from Intraday High. |
| Close | 12,070.59 | 64.36 | |
| High | 12,071.29 | 0.70 | Yes! The High is close to the Close. |
| Daily R1 | 12,135.65 | 64.36 | |
| Daily R2 | 12,200.70 | 65.06 | |
| Weekly R1 | 12,270.36 | 69.66 | |
| Weekly R2 | 12,470.13 | 199.77 | |
| Monthly R1 | 12,805.08 | 334.95 | |
| Monthly R2 | 13,539.57 | 734.49 |
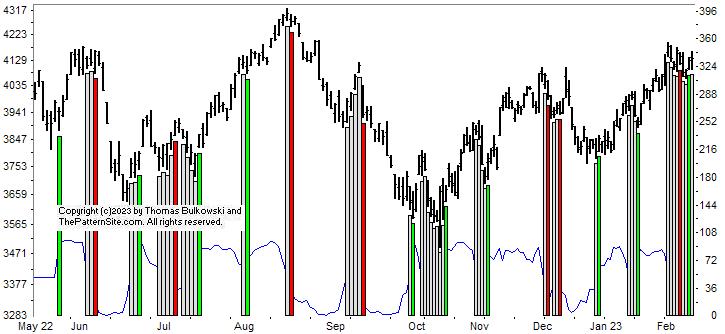
This is a picture of the chart pattern indicator on the daily scale. The indicator is the line chart below a chart of the S&P 500 composite.
The bullish signal we saw a week ago flipped to red when the market dropped. Signals can change for up to a week.
Now, we see a vertical green bar on the far right of the screen, indicating a bullish stance that has eased back into the neutral zone. Again, the signal can disappear and new ones appear.
The chart is neutral, trying to decide on a direction. The index looks like a flag, so maybe this is just a short retrace in an uptrend.
The red line is the percentage of stocks at least 20% below their 1-year high (plotted upside down). The blue line is the average percentage drop of stocks below their 1-year high (plotted upside down).
On Tuesday, 34% of stocks in my database are in bear market territory (down at least 20% from their 1-year high).A week ago, it was 32%.The fewest was 32% on 02/02/2023.And the most was 81% on 06/17/2022.
The 520 stocks in my database are down an average of 18% from their yearly high.A week ago, the average was 17%.The peak was 17% on 02/02/2023.And the bottom was 34% on 09/30/2022.
Both the red line blue lines are worse off this week than a week ago. The red line is at the highest point it has seen in months (highest on this chart). That shows strength. The minor retrace below the M-shaped high is no cause for concern, I think.
The prior chart is neutral. This chart is bullish but cautious. I'm not sure what to make of this and perhaps that in itself is a warning sign. Maybe we'll see a big drop here.
$ $ $
Here's a symbol list of 123 chart and candlestick patterns (13 "investment grade" candle patterns) found in today's securities using my version of Patternz: ABT, AJRD, AA, ALGT, AYX, DOX, AIG, ANIK, AON, ANET, AWI, AIZ, ATO, AVA, AXS, BCPC, BSET, CBT, CNP, CDAY, CMCO, COP, CCRN, DHR, DVN, FANG, DDS, D, EXP, EOG, RE, EVRG, EXC, FARO, FLEX, FMC, FORM, FWRD, GPS, GILD, GFS, GOOGL, GFF, HSII, HELE, HSY, HUBG, HURC, ITW, NSP, IPG, NVTA, JBLU, KALU, K, KELYA, KMT, KFRC, KMB, KSS, RAMP, LPLA, MRO, MTRX, NCR, NEU, JWN, ON, OUT, PKE, PCTY, PCG, PXD, PEG, PSTG, DGX, RMBS, RTX, REGN, RGA, RLI, RES, SAIA, SBH, SLB, SEIC, SMTC, SLGN, STR, SKYW, SR, SRDX, TDOC, TPX, TMO, TRV, TG, TREX, UGI, VLO, WERN, WEX, WSM, XEL, ITA, IAI, IYE, IEO, EPP, EWD, THD, DBA, PBE, IXC, XLE, XRT, USO. Click this link for details (pattern type, start and end dates).
For a list of small patterns (those a few days wide) click this link.
-- Thomas Bulkowski
![]()
$ $ $
I show another slider trading quiz featuring Trex: (TREX) stock.
$ $ $
Here's a symbol list of 90 chart and candlestick patterns (13 "investment grade" candle patterns) found in today's securities using my version of Patternz: AXDX, ACN, AJRD, AA, AYX, AFG, AIG, AWI, ARW, AVY, AXS, BERY, BMRN, BKNG, BFH, CBT, CTAS, CSCO, CTSH, CONN, GLW, COTY, ^DJI, EFX, RE, FDS, FIS, FISV, FIVN, FMC, FCX, FRD, GPS, GNW, GPRO, HBI, HLIT, HAYN, HWM, IDXX, IBP, IIIN, IRM, LXU, MKTX, NTAP, OLN, ASGN, OUT, PKE, PCG, PSTG, RCKY, ROL, RES, SMTC, SKYW, SWX, SRDX, TRGP, TDC, TXT, TTD, TOL, TSCO, UIS, VRTX, WMT, WEX, IHE, IDU, DDM, FXL, ICF, IYF, EWG, EWS, EWT, THD, EWU, PPA, PEJ, PJP, PHO, IXC, XLY, XLV, VIS. Click this link for details (pattern type, start and end dates).
For a list of small patterns (those a few days wide) click this link.
$ $ $
The following table shows where Fibonacci retrace values of the day's high-low range are plus pivot points, calculated on the Dow industrials, sorted by value. When several are near each other (small differences), the area might act as support or resistance.
-- Thomas Bulkowski
![]()
| © 2023 ThePatternSite.com Metric | Value | Diff | Close (within 10% of the high-low range for the day)? |
| Monthly S2 | 32,452.34 | ||
| Monthly S1 | 33,349.13 | 896.80 | |
| Weekly S2 | 33,369.58 | 20.45 | Yes! The Weekly S2 is close to the Monthly S1. |
| Daily S2 | 33,765.43 | 395.85 | |
| Weekly S1 | 33,807.76 | 42.33 | |
| Monthly Pivot | 33,845.73 | 37.97 | |
| Low | 33,887.39 | 41.66 | |
| Open | 33,887.39 | 0.00 | Yes! The Open is close to the Low. |
| Daily S1 | 34,005.68 | 118.29 | |
| 61.8% Down from Intraday High | 34,025.75 | 20.07 | Yes! The 61.8% Down from Intraday High is close to the Daily S1. |
| Weekly Pivot | 34,030.16 | 4.41 | Yes! The Weekly Pivot is close to the 61.8% Down from Intraday High. |
| 50% Down from Intraday High | 34,068.50 | 38.33 | |
| 38.2% Down from Intraday High | 34,111.23 | 42.74 | |
| Daily Pivot | 34,127.64 | 16.41 | Yes! The Daily Pivot is close to the 38.2% Down from Intraday High. |
| Close | 34,245.93 | 118.29 | |
| High | 34,249.60 | 3.67 | Yes! The High is close to the Close. |
| Daily R1 | 34,367.89 | 118.29 | |
| Weekly R1 | 34,468.34 | 100.45 | |
| Daily R2 | 34,489.85 | 21.52 | Yes! The Daily R2 is close to the Weekly R1. |
| Weekly R2 | 34,690.74 | 200.89 | |
| Monthly R1 | 34,742.52 | 51.78 | |
| Monthly R2 | 35,239.12 | 496.59 |
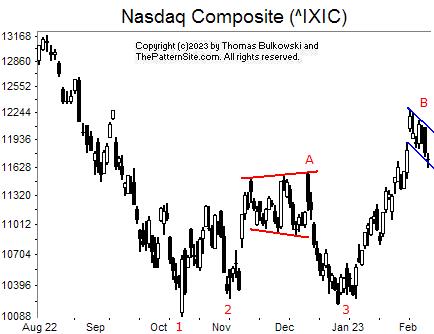
I show a chart of the Nasdaq index on the daily scale.
At A, I highlight in red a chart pattern called a broadening top. The two red lines diverge, forming a megaphone shape. This one acted as a reversal of the short-term upward rise from 2 to the pattern.
Below that, at 1, 2, and 3, is a triple bottom. It confirms as a valid chart pattern when the index closes above peak A, the highest peak in the pattern. If the pattern works as it's supposed to, the index should climb above A the height of the pattern (from A to 1). That hasn't happened yet. The move to B is about halfway there.
At B, we see a flag. With this chart pattern, the measure rule suggests the target would be the climb from 3 to B added to the bottom of the flag. That move hasn't happened yet. That move assumes an upward breakout from the flag.
![]()
The following is a brief review of how the markets performed over time. The numbers refer to the close-to-close move in the Dow industrials.
Many options expire this week, so traders will be looking to close out their positions, and that suggests increased volatility (large daily price swings).
![]()
The following is based on an SFO article in December 2004 by John Seekinger, titled, "Take a two-dimensional approach." He offers these tips.
| Index | S2 | S1 | Pivot | R1 | R2 |
| Dow Industrials (^DJI): Daily | 33,481 | 33,675 | 33,786 | 33,980 | 34,092 |
| Weekly | 33,244 | 33,557 | 33,905 | 34,217 | 34,565 |
| Monthly | 32,327 | 33,098 | 33,720 | 34,491 | 35,114 |
| S&P500 (^GSPC): Daily | 4,048 | 4,069 | 4,082 | 4,103 | 4,115 |
| Weekly | 3,994 | 4,042 | 4,109 | 4,158 | 4,225 |
| Monthly | 3,646 | 3,868 | 4,032 | 4,254 | 4,418 |
| Nasdaq (^IXIC): Daily | 11,563 | 11,641 | 11,708 | 11,786 | 11,853 |
| Weekly | 11,313 | 11,516 | 11,833 | 12,035 | 12,353 |
| Monthly | 9,413 | 10,566 | 11,418 | 12,570 | 13,422 |
Here are the formulas:
![]()
Earnings season is either underway or should be starting soon. The sessions could be more volatile.
Here's a symbol list of 117 chart and candlestick patterns (13 "investment grade" candle patterns) found in today's securities using my version of Patternz: ABM, AXDX, AJRD, AES, ATSG, ALRM, ALK, AA, ALGT, AYX, AMED, APH, APA, ATR, ADM, AWI, ADP, AXS, AZTA, BALL, BIO, BMRN, BFH, CNC, CRL, CONN, CXW, CSGP, DVN, DSGR, DUK, BOOM, ELV, EPAM, EFX, EL, EZPW, FLS, FTV, FCX, GPS, GD, GNW, GPRO, GGG, GES, HBI, HIG, HAYN, IDA, NSP, PODD, NVTA, LANC, LXU, M, MGY, MRO, MKTX, MUR, NUS, NTNX, OUT, OMI, PKE, PRFT, PXD, PLXS, PPG, PSTG, QTWO, KWR, RRC, RHI, ROL, SEE, SIGI, SMTC, SHW, LUV, SWX, TRGP, TECH, TDY, TOL, VRTX, WMB, WSM, WSC, ITA, IHE, IDU, FDN, FXI, IGE, EEM, EWQ, EIS, EWM, EPP, EZA, EWL, THD, ILF, MXI, XLB. Click this link for details (pattern type, start and end dates).
For a list of small patterns (those a few days wide) click this link.
The below industries were the best (rank 1) or worst performing of those I follow.
|
-- Thomas Bulkowski
![]()
$ $ $
Here's a symbol list of 155 chart and candlestick patterns (13 "investment grade" candle patterns) found in today's securities using my version of Patternz: ABT, ABM, AXDX, ADTN, AEIS, AES, A, ALKS, ALL, AYX, AEE, AEL, APH, AON, APA, AWI, AVY, AZTA, BAX, BMRN, BA, BFH, BBW, BLDR, CLS, CRL, CHD, CLF, CGNX, CL, CAG, CONN, CXW, CR, DFS, DSGR, D, DUK, BOOM, ELV, EME, EMR, EOG, EPAM, EFX, EL, RE, EXC, EZPW, FDX, FORM, FTV, FRD, GPS, GE, GFS, GL, GS, GPRO, HBI, HLIT, HAYN, HSIC, HWM, HUBG, INFN, NSP, ITGR, NVTA, JNJ, KBAL, KMB, LEG, LDOS, M, MGY, MKTX, MLM, MTRX, MS, MUR, NCR, NWL, NUS, NTNX, OTEX, OMI, PRFT, PKI, PFE, PPG, PGR, PEG, PSTG, RJF, RLI, RHI, RCKY, SAIC, SEE, SIGI, SRE, SHW, SUM, TRGP, TEVA, TTD, TMO, TOL, TSCO, TREX, SLCA, UNM, VFC, VRTX, WERN, WU, WEX, ITA, IAI, IEZ, IHE, IDU, ICF, IYF, EWO, EWK, EWZ, EWH, EIS, EWI, EZA, EWL, THD, PPA, DBA, PXJ, PJP, ILF, XLF, XLV, XLU. Click this link for details (pattern type, start and end dates).
For a list of small patterns (those a few days wide) click this link.
$ $ $
You can find setups based on a Fibonacci retrace by clicking on the link.
The following patterns were found manually, not using Patternz. Mr. Bulkowski has excluded any securities he owns from appearing in the list. However, he may add any of the securities listed to his portfolio at any time, just as you can.
In the table below, the red and green colors are based on the historical breakout direction for the associated chart pattern. If a high and tight flag appears, the start and end dates highlight the flagpole only and not the flag.
For details about the chart patterns, click here.
-- Thomas Bulkowski
![]()
| Symbol | Chart Pattern | Bullish Bearish | Start | End | Industry |
| ALL | Double Bottom, Adam and Adam | 01/19/2023 | 02/02/2023 | Insurance (Prop/Casualty) | |
| AFG | Double Top, Eve and Eve | 01/13/2023 | 02/02/2023 | Insurance (Prop/Casualty) | |
| AZTA | Rectangle top | 11/16/2022 | 02/08/2023 | Semiconductor Cap Equip. | |
| BKH | Double Top, Adam and Adam | 01/12/2023 | 02/02/2023 | Electric Utility (West) | |
| CNP | Triple top | 12/01/2022 | 01/13/2023 | Electric Utility (Central) | |
| CF | Rectangle bottom | 01/05/2023 | 02/09/2023 | Chemical (Basic) | |
| ED | Triple top | 12/01/2022 | 01/11/2023 | Electric Utility (East) | |
| CCRN | Broadening bottom | 12/16/2022 | 02/09/2023 | Human Resources | |
| ^DJT | Flag | 02/03/2023 | 02/07/2023 | None | |
| DTE | Double Top, Adam and Eve | 12/13/2022 | 01/11/2023 | Electric Utility (Central) | |
| DUK | Head-and-shoulders top | 12/14/2022 | 02/02/2023 | Electric Utility (East) | |
| EXC | Head-and-shoulders top | 12/14/2022 | 02/02/2023 | Electric Utility (East) | |
| FDS | Triangle, ascending | 01/18/2023 | 02/09/2023 | Information Services | |
| FE | Double Top, Adam and Eve | 12/13/2022 | 01/17/2023 | Electric Utility (East) | |
| GPS | V Bottom Extension | 12/06/2022 | 01/30/2023 | Apparel | |
| GS | Pipe bottom | 01/17/2023 | 01/23/2023 | Securities Brokerage | |
| HQY | Triple bottom | 01/12/2023 | 02/02/2023 | Healthcare Information | |
| HUM | Broadening bottom | 01/18/2023 | 02/07/2023 | Medical Services | |
| NSP | Double Bottom, Adam and Eve | 01/10/2023 | 02/01/2023 | Human Resources | |
| NVTA | Triple top | 01/18/2023 | 02/02/2023 | Medical Services | |
| MA | Diamond top | 01/09/2023 | 02/07/2023 | Financial Services | |
| MTRX | Dead-cat bounce | 02/09/2023 | 02/09/2023 | Oilfield Svcs/Equipment | |
| MYGN | Double Top, Adam and Adam | 01/23/2023 | 02/02/2023 | Biotechnology | |
| NTAP | Ugly double bottom | 12/28/2022 | 01/31/2023 | Computers and Peripherals | |
| OUT | Flag | 02/03/2023 | 02/09/2023 | Advertising | |
| PSTG | Double Bottom, Adam and Adam | 01/24/2022 | 02/24/2022 | Computers and Peripherals | |
| SMG | Flag | 02/03/2023 | 02/09/2023 | Chemical (Basic) | |
| SRE | Double Top, Eve and Eve | 01/17/2023 | 01/27/2023 | Electric Utility (West) | |
| SKX | Double Top, Adam and Adam | 01/23/2023 | 02/01/2023 | Shoe | |
| SKYW | Dead-cat bounce | 02/03/2023 | 02/03/2023 | Air Transport | |
| TMO | Diamond top | 01/12/2023 | 02/02/2023 | Precision Instrument | |
| UGI | Double Bottom, Eve and Adam | 01/20/2023 | 01/31/2023 | Natural Gas (Distributor) | |
| UIS | Dead-cat bounce | 11/08/2022 | 11/08/2022 | Computers and Peripherals | |
| VRTX | Pipe top | 01/23/2023 | 01/30/2023 | Biotechnology |
![]()
Since I post this the night before, check how the futures are trading before market open. Large moves can affect the opening direction.
$ $ $
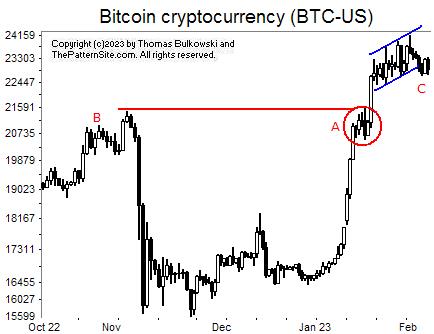
I show a picture of bitcoin on the daily scale.
At B, you can see price moving sideways, forming a resistance zone. That resistance causes the cryptocurrency to move sideways for a time at A. The currency has enough juice to push upward, through that overhead resistance. It does so in a robust manner as the tall white candle shows.
Highlighted in blue is a channel. Notice that the coin pushes out the bottom of the channel at C. We see the slide halt and slide along the bottom of the channel, but I think that's just a pause before the decline resumes.
In the coming days, I expect the coin to drop and find support at A.
$ $ $
Here's a symbol list of 73 chart and candlestick patterns (13 "investment grade" candle patterns) found in today's securities using my version of Patternz: APD, ALL, AEE, APA, ATR, ANET, AWI, BALL, BSET, BMRN, BKH, BFH, CONN, CCK, DDS, DSGR, D, ELV, EXC, FTNT, FTV, GPS, GPRO, GES, HAYN, HL, HURC, ITW, ITGR, JKHY, JAZZ, RAMP, MHO, MKTX, NCR, NTGR, NEWR, NI, OTEX, PANW, RL, SRE, NOW, SKX, SSYS, SRDX, TPR, TTD, TOL, VRTX, VC, VMC, WSO, WERN, WU, IAI, IDU, IHF, EWO, ECH, EZA, EWY, TUR, EWU, PJP, XAR, XLU. Click this link for details (pattern type, start and end dates).
For a list of small patterns (those a few days wide) click this link.
$ $ $
The following table shows where Fibonacci retrace values of the day's high-low range are plus pivot points, calculated on the Nasdaq composite, sorted by value. When several are near each other (small differences), the area might act as support or resistance.
-- Thomas Bulkowski
![]()
| © 2023 ThePatternSite.com Metric | Value | Diff | Close (within 10% of the high-low range for the day)? |
| Monthly S2 | 9,477.19 | ||
| Monthly S1 | 10,693.86 | 1,216.66 | |
| Weekly S2 | 10,975.19 | 281.34 | |
| Weekly S1 | 11,442.86 | 467.66 | |
| Monthly Pivot | 11,481.70 | 38.85 | |
| Daily S2 | 11,759.37 | 277.66 | |
| Daily S1 | 11,834.94 | 75.58 | |
| Weekly Pivot | 11,856.20 | 21.26 | |
| Low | 11,890.09 | 33.89 | |
| Close | 11,910.52 | 20.43 | Yes! The Close is close to the Low. |
| Daily Pivot | 11,965.67 | 55.15 | |
| 61.8% Down from Intraday High | 11,968.90 | 3.23 | Yes! The 61.8% Down from Intraday High is close to the Daily Pivot. |
| 50% Down from Intraday High | 11,993.24 | 24.34 | |
| 38.2% Down from Intraday High | 12,017.58 | 24.34 | |
| Daily R1 | 12,041.24 | 23.66 | |
| Open | 12,069.12 | 27.88 | |
| High | 12,096.39 | 27.27 | |
| Daily R2 | 12,171.97 | 75.58 | |
| Weekly R1 | 12,323.87 | 151.90 | |
| Monthly R1 | 12,698.37 | 374.50 | |
| Weekly R2 | 12,737.21 | 38.85 | |
| Monthly R2 | 13,486.21 | 749.00 |
This is a picture of the chart pattern indicator on the daily scale. The indicator is the line chart below a chart of the S&P 500 composite.
Much to my surprise, the CPI continued to rise instead of retracing. The chart shows three pairs of white and green bars, a pattern I can't recall seeing before.
The chart shows one of strength but let me issue this warning that the indicator signals can change for up to a week. So the recent green bar can switch to red if the index were to plunge.
Will that happen? It could, of course. The index has climbed to a resistance area so I anticipate weakness going forward.
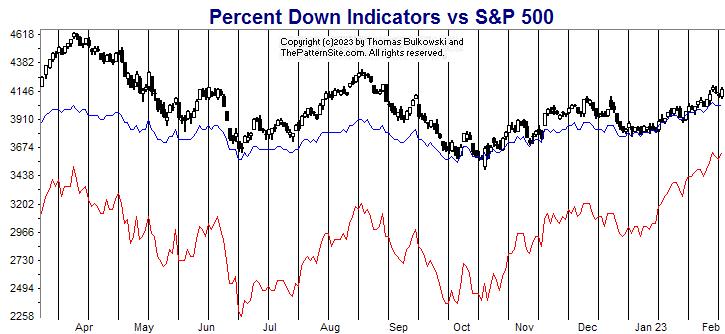
The red line is the percentage of stocks at least 20% below their 1-year high (plotted upside down). The blue line is the average percentage drop of stocks below their 1-year high (plotted upside down).
On Tuesday, 32% of stocks in my database are in bear market territory (down at least 20% from their 1-year high).A week ago, it was 37%.The fewest was 32% on 02/02/2023.And the most was 81% on 06/17/2022.
The 520 stocks in my database are down an average of 17% from their yearly high.A week ago, the average was 18%.The peak was 17% on 02/02/2023.And the bottom was 34% on 09/30/2022.
Both the red and blue lines show improvement from a week ago. The red line, the more sensitive of the two, made a big gain.
If you think of the red line's pattern as a measured move up, then we'd expect to see a retrace back to what's called the corrective phase. That's a return to the location where the red line went flat in mid to late December.
That suggests weakness going forward. Although both charts are bullish, they are signaling caution.
$ $ $
Here's a symbol list of 96 chart and candlestick patterns (13 "investment grade" candle patterns) found in today's securities using my version of Patternz: MMM, ACIW, ADTN, AJRD, ALGT, AXP, AIG, APOG, AAPL, ATR, ARCB, AWI, ASH, AIZ, BALL, BSET, BBBY, BMRN, BFH, CLS, CINF, CTAS, CLF, CNX, CTSH, CONN, ELV, EME, EMR, EPAM, FTV, GPS, GPRO, HE, HAYN, HD, ITW, NSP, IIIN, NVTA, JKHY, KMT, KEYS, LEG, MHO, MAN, MKTX, MTDR, META, MOS, NWL, NEE, NUS, OUT, OMI, PKE, PFG, PG, RGA, SEIC, SRE, SKX, TECH, TDY, TTD, TJX, TOL, TZOO, UNH, VRTX, WRB, WERN, WSC, ITA, IAI, IHF, IAT, EWZ, ECH, EWM, EWW, EZA, EWY, TUR, IBB, PJP, XLV, VHT. Click this link for details (pattern type, start and end dates).
For a list of small patterns (those a few days wide) click this link.
-- Thomas Bulkowski
![]()
$ $ $
I show another slider trading quiz featuring Tredegar 2: TG stock.
$ $ $
Here's a symbol list of 97 chart and candlestick patterns (13 "investment grade" candle patterns) found in today's securities using my version of Patternz: ADBE, ADTN, AES, ALL, AMZN, ANIK, AON, APA, AWI, AXS, BSET, BBBY, BSX, CACI, CNP, CHD, CNX, CRH, CCRN, CMI, DECK, DVN, DDS, DSGR, XOM, FARO, FIS, FMC, FTV, GPS, GILD, GPN, GS, GPRO, HSY, HOV, INTU, NVTA, IRM, KALU, LMT, L, LXU, MGY, MTRX, ORI, PKE, PDCO, PCTY, PGR, RRC, ROG, RES, SHW, SWX, TECH, TTD, TSCO, RIG, TRV, SLCA, UIS, VRSN, FXI, IGV, SLV, EWA, EWO, EWK, EWZ, EEM, EWH, EWJ, EWM, EPP, EZA, EWY, EWT, THD, TUR, EWU, PPA, PBE, ILF, MXI, GLD, XLV, XLB. Click this link for details (pattern type, start and end dates).
For a list of small patterns (those a few days wide) click this link.
$ $ $
The following table shows where Fibonacci retrace values of the day's high-low range are plus pivot points, calculated on the Dow industrials, sorted by value. When several are near each other (small differences), the area might act as support or resistance.
-- Thomas Bulkowski
![]()
| © 2023 ThePatternSite.com Metric | Value | Diff | Close (within 10% of the high-low range for the day)? |
| Monthly S2 | 32,151.90 | ||
| Monthly S1 | 33,021.46 | 869.56 | |
| Weekly S2 | 33,182.43 | 160.97 | |
| Weekly S1 | 33,536.73 | 354.29 | |
| Daily S2 | 33,566.55 | 29.83 | |
| Monthly Pivot | 33,681.89 | 115.34 | |
| Low | 33,683.58 | 1.69 | Yes! The Low is close to the Monthly Pivot. |
| Daily S1 | 33,728.79 | 45.21 | |
| 61.8% Down from Intraday High | 33,790.26 | 61.47 | |
| 50% Down from Intraday High | 33,823.21 | 32.95 | |
| Daily Pivot | 33,845.81 | 22.60 | Yes! The Daily Pivot is close to the 50% Down from Intraday High. |
| 38.2% Down from Intraday High | 33,856.16 | 10.35 | Yes! The 38.2% Down from Intraday High is close to the Daily Pivot. |
| Open | 33,874.44 | 18.28 | Yes! The Open is close to the 38.2% Down from Intraday High. |
| Close | 33,891.02 | 16.58 | Yes! The Close is close to the Open. |
| Weekly Pivot | 33,935.71 | 44.70 | |
| High | 33,962.84 | 27.13 | Yes! The High is close to the Weekly Pivot. |
| Daily R1 | 34,008.05 | 45.21 | |
| Daily R2 | 34,125.07 | 117.03 | |
| Weekly R1 | 34,290.01 | 164.93 | |
| Monthly R1 | 34,551.45 | 261.44 | |
| Weekly R2 | 34,688.99 | 137.54 | |
| Monthly R2 | 35,211.88 | 522.89 |
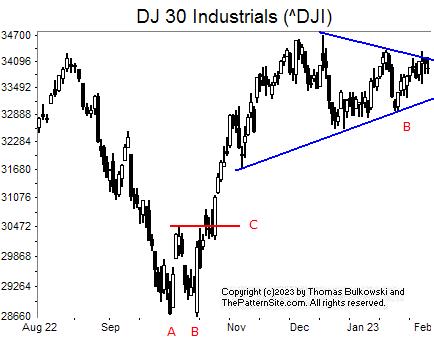
I show the Dow industrials on the daily scale.
At AB, we see a wonderful looking double bottom. That means we see two valleys (AB) which bottom near the same price. It confirms as a valid double bottom when the index closes above line C. If the index didn't close above C, the double bottom would be just squiggles on the chart.
You can see how the market reacted after the double bottom (it climbed to the top of the chart).
At B, in blue, is another chart pattern called a symmetrical triangle. Because it closed today near the top of the pattern, I'd expect an upward breakout. A breakout would mean the index has closed above the top blue line. After that, I'm not so sure the index will rise much farther.
![]()
The following is a brief review of how the markets performed over time. The numbers refer to the close-to-close move in the Dow industrials.
No options expire this week.
![]()
The following is based on an SFO article in December 2004 by John Seekinger, titled, "Take a two-dimensional approach." He offers these tips.
| Index | S2 | S1 | Pivot | R1 | R2 |
| Dow Industrials (^DJI): Daily | 33,607 | 33,767 | 33,973 | 34,132 | 34,339 |
| Weekly | 33,194 | 33,560 | 33,947 | 34,313 | 34,701 |
| Monthly | 32,164 | 33,045 | 33,694 | 34,575 | 35,224 |
| S&P500 (^GSPC): Daily | 4,088 | 4,112 | 4,147 | 4,171 | 4,206 |
| Weekly | 3,936 | 4,036 | 4,116 | 4,216 | 4,296 |
| Monthly | 3,641 | 3,889 | 4,042 | 4,290 | 4,443 |
| Nasdaq (^IXIC): Daily | 11,777 | 11,892 | 12,062 | 12,177 | 12,346 |
| Weekly | 11,007 | 11,507 | 11,888 | 12,388 | 12,769 |
| Monthly | 9,509 | 10,758 | 11,514 | 12,763 | 13,518 |
Here are the formulas:
![]()
Earnings season is either underway or should be starting soon. The sessions could be more volatile.
Here's a symbol list of 92 chart and candlestick patterns (13 "investment grade" candle patterns) found in today's securities using my version of Patternz: AXDX, AES, AMED, AEE, AEL, AXP, AME, ANIK, ATR, AWI, BMI, BSET, BA, BBW, CBT, CACI, CALM, CPB, CNC, CF, CIEN, CI, CSCO, CLNE, CLX, CNA, CAG, DECK, DSGR, DTE, EVRG, EXC, EZPW, FTV, FDP, FRD, GPS, GD, GIS, GILD, GS, HBI, HSY, HWM, HUBG, IDXX, IIIN, IBKR, M, MANH, MTRX, MRK, JWN, NUS, OLN, OTEX, PCTY, PCG, PLXS, PPL, PGR, PRU, RGS, ROL, RES, SRE, SKYW, SCS, TECH, TXT, UNH, WLK, ITA, IAI, IDU, IYZ, EWZ, EWC, TUR, PBE, ILF, XLV, XLU. Click this link for details (pattern type, start and end dates).
For a list of small patterns (those a few days wide) click this link.
The below industries were the best (rank 1) or worst performing of those I follow.
|
-- Thomas Bulkowski
![]()
$ $ $
Here's a symbol list of 220 chart and candlestick patterns (13 "investment grade" candle patterns) found in today's securities using my version of Patternz: DDD, AXDX, ACN, ADBE, AFL, ALRM, ALGT, AYX, AMZN, AMED, AEO, AEL, AXP, AFG, AME, AAPL, AMAT, ATR, AWI, ARW, ATO, ADSK, AVNT, BSET, BECN, BBBY, BERY, BBY, BIO, BIIB, BA, BFH, CBT, CPB, CX, CNP, CIEN, CLNE, CNA, CGNX, CTSH, CONN, COST, CMI, DECK, XRAY, DSGR, DOV, DTE, EFX, RE, EVRG, EXPI, FFIV, FDX, FIS, FRD, GME, GPS, GIS, GNW, GILD, GL, GS, GOOGL, GPRO, GGG, HBI, HELE, HD, DHI, HOV, HWM, ITW, ILMN, IBP, IIIN, INTU, NVTA, IRM, JBLU, KBH, K, KELYA, KLIC, LZB, LAMR, LEN, LLY, RAMP, LOW, MHO, M, MCHX, MLM, MTRX, MDC, MRK, META, MSFT, MCO, MS, ^IXIC, NTAP, NJR, NEWR, NXGN, NWPX, NOVT, NUS, OMCL, OMC, ASGN, OUT, PANW, PCTY, PYPL, PEN, PRFT, PETS, PPL, PGR, PRU, PEG, PHM, QTWO, RJF, RGS, RNG, ROL, RES, SCHW, SMG, SIGI, SCI, NOW, SHW, SHOP, SMAR, SPLK, SXI, SCS, SSYS, TDOC, TDY, TER, TXT, TKR, TOL, TDG, TREX, TWLO, UPS, UNH, UNM, VFC, VMI, VEEV, WSO, WSM, WOLF, WDAY, ZBRA, ITA, IAI, IYC, ITB, IEZ, FTEC, FDN, QTEC, FXL, QQQ, ICF, IYZ, IGV, SLV, EWK, EWZ, EWC, EWQ, EWW, EWD, TUR, EWU, QLD, DBA, PBE, PEJ, ROBO, IXN, XLY, XLI, XRT, XLK, VAW, MGK. Click this link for details (pattern type, start and end dates).
For a list of small patterns (those a few days wide) click this link.
$ $ $
You can find setups based on a Fibonacci retrace by clicking on the link.
The following patterns were found manually, not using Patternz. Mr. Bulkowski has excluded any securities he owns from appearing in the list. However, he may add any of the securities listed to his portfolio at any time, just as you can.
In the table below, the red and green colors are based on the historical breakout direction for the associated chart pattern. If a high and tight flag appears, the start and end dates highlight the flagpole only and not the flag.
For details about the chart patterns, click here.
-- Thomas Bulkowski
![]()
| Symbol | Chart Pattern | Bullish Bearish | Start | End | Industry |
| AES | Triangle, symmetrical | 01/03/2023 | 01/27/2023 | Electric Utility (East) | |
| AKAM | Ugly double bottom | 12/22/2022 | 01/25/2023 | E-Commerce | |
| AMZN | Ugly double bottom | 01/06/2023 | 01/25/2023 | Internet | |
| AIG | Double Top, Adam and Eve | 12/13/2022 | 01/09/2023 | Insurance (Prop/Casualty) | |
| AMWD | Head-and-shoulders bottom | 12/07/2022 | 01/20/2023 | Building Materials | |
| APH | Double Bottom, Eve and Adam | 12/22/2022 | 01/25/2023 | Electronics | |
| ANET | Double Bottom, Adam and Adam | 01/06/2023 | 01/24/2023 | E-Commerce | |
| ASH | Broadening bottom | 12/16/2022 | 01/25/2023 | Chemical (Basic) | |
| ATO | Head-and-shoulders bottom | 12/22/2022 | 01/20/2023 | Natural Gas (Diversified) | |
| AVNT | Scallop, ascending | 12/13/2022 | 01/11/2023 | Chemical (Specialty) | |
| BCPC | Ugly double bottom | 01/05/2023 | 01/19/2023 | Chemical (Specialty) | |
| BOOT | Flag | 01/27/2023 | 02/01/2023 | Shoe | |
| BFH | Double Bottom, Adam and Adam | 01/19/2023 | 02/01/2023 | Information Services | |
| CINF | Double Bottom, Adam and Adam | 12/19/2022 | 01/20/2023 | Insurance (Prop/Casualty) | |
| CLNE | Head-and-shoulders complex bottom | 12/12/2022 | 01/20/2023 | Natural Gas (Distributor) | |
| GLW | Double Top, Adam and Adam | 01/12/2023 | 01/30/2023 | Telecom. Equipment | |
| CSGS | Double Bottom, Adam and Adam | 01/10/2023 | 01/20/2023 | IT Services | |
| ^DJT | Triangle, symmetrical | 01/18/2023 | 01/30/2023 | None | |
| EXPD | Triple bottom | 01/19/2023 | 01/31/2023 | Air Transport | |
| FAST | Double Bottom, Adam and Adam | 01/05/2023 | 01/19/2023 | Retail Building Supply | |
| FDX | Double Bottom, Eve and Adam | 01/19/2023 | 01/31/2023 | Air Transport | |
| IT | Triple bottom | 01/05/2023 | 01/25/2023 | IT Services | |
| GFS | Ugly double bottom | 01/03/2023 | 01/20/2023 | Semiconductor | |
| HBI | Dead-cat bounce | 02/02/2023 | 02/02/2023 | Apparel | |
| HD | Double Bottom, Eve and Eve | 01/06/2023 | 01/20/2023 | Retail Building Supply | |
| IPI | Ugly double bottom | 01/05/2023 | 01/19/2023 | Chemical (Diversified) | |
| KBAL | Ugly double bottom | 12/19/2022 | 01/20/2023 | Furn/Home Furnishings | |
| RAMP | Rising wedge | 12/14/2022 | 01/19/2023 | Computer Software and Svcs | |
| MTSI | Double Bottom, Eve and Adam | 01/05/2023 | 01/20/2023 | Semiconductor | |
| MLM | Double Bottom, Eve and Adam | 12/23/2022 | 01/26/2023 | Cement and Aggregates | |
| MTRX | Pipe bottom | 01/17/2023 | 01/23/2023 | Oilfield Svcs/Equipment | |
| MGEE | Triple bottom | 12/16/2022 | 01/20/2023 | Electric Utility (Central) | |
| NWPX | Double Bottom, Eve and Adam | 01/05/2023 | 01/19/2023 | Building Materials | |
| NUS | Double Bottom, Eve and Adam | 01/19/2023 | 01/31/2023 | Toiletries/Cosmetics | |
| PKG | Double Bottom, Eve and Adam | 12/22/2022 | 01/25/2023 | Packaging and Container | |
| PCTY | Head-and-shoulders bottom | 12/27/2022 | 01/25/2023 | E-Commerce | |
| PNW | Double Bottom, Adam and Adam | 01/24/2023 | 01/31/2023 | Electric Utility (West) | |
| PPG | Triple bottom | 12/22/2022 | 01/19/2023 | Chemical (Diversified) | |
| PGR | Pipe bottom | 01/17/2023 | 01/23/2023 | Insurance (Prop/Casualty) | |
| SCHW | Diamond bottom | 01/19/2023 | 02/02/2023 | Securities Brokerage | |
| TDC | Double Bottom, Eve and Eve | 12/20/2022 | 01/19/2023 | Computer Software and Svcs | |
| TXN | Triangle, symmetrical | 01/12/2023 | 01/31/2023 | Semiconductor | |
| UNM | Head-and-shoulders bottom | 11/17/2022 | 01/19/2023 | Insurance (Diversified) | |
| VFC | Ugly double bottom | 12/22/2022 | 01/19/2023 | Apparel | |
| VEEV | Triple bottom | 12/28/2022 | 01/19/2023 | Healthcare Information | |
| VMC | Double Bottom, Eve and Eve | 12/22/2022 | 01/25/2023 | Cement and Aggregates |
![]()
Since I post this the night before, check how the futures are trading before market open. Large moves can affect the opening direction.
$ $ $
I released another version (7.0.0.46) of Patternz, my free pattern finding software. This one expands the filters to include big price and volume moves.
$ $ $
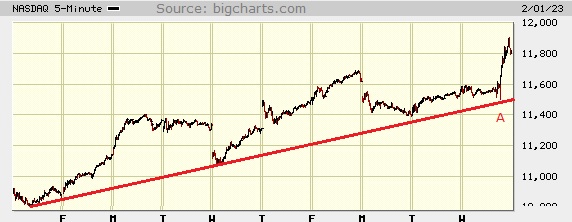
I show a picture of the Nasdaq composite on the 5-minute scale.
The Nasdaq has been following an up-sloping trend as the red line shows. However, at A, the index spiked. Why?
The answer is the FED told the world what they did with interest rates (raised them 1/4 point again) and also described what the rest of the year might look like. The market liked what they said.
Look near the end of today's trading. The index dropped marginally, suggesting tomorrow the index will open lower.
$ $ $
Here's a symbol list of 105 chart and candlestick patterns (13 "investment grade" candle patterns) found in today's securities using my version of Patternz: ABM, AXDX, AEIS, AMD, AEO, AMGN, ANIK, ARCB, ATO, AVNT, BFH, BMY, CBT, CENX, CRL, CNO, CTSH, GLW, CCK, CMI, DDS, DSGR, ^DJT, ^DJI, EME, WIRE, EVRG, FFIV, FTV, FCX, GNW, GILD, GFS, GS, GGG, HELE, IEX, IIIN, IRM, JBLU, KELYA, LANC, LOW, M, MAS, MTRN, MTRX, MS, NEU, NOVT, OXY, ON, PTEN, PKI, PFG, PGR, PEG, RTX, RGS, RNG, RES, R, ^GSPC, SAIA, SMG, SEIC, SRE, SMTC, SCI, SWN, SNPS, TPX, TMO, RIG, UNH, VFC, VMI, VECO, ITA, IAI, IHE, QTEC, FXL, IYZ, SLV, EWA, EWK, ECH, EIS, EWP, TUR, IBB, PBE, PJP, IEV, MXI, XLI, SPY. Click this link for details (pattern type, start and end dates).
For a list of small patterns (those a few days wide) click this link.
$ $ $
The following table shows where Fibonacci retrace values of the day's high-low range are plus pivot points, calculated on the Nasdaq composite, sorted by value. When several are near each other (small differences), the area might act as support or resistance.
-- Thomas Bulkowski
![]()
| © 2023 ThePatternSite.com Metric | Value | Diff | Close (within 10% of the high-low range for the day)? |
| Monthly S2 | 9,754.14 | ||
| Monthly S1 | 10,785.23 | 1,031.09 | |
| Weekly S2 | 10,903.09 | 117.86 | |
| Monthly Pivot | 11,238.56 | 335.47 | |
| Daily S2 | 11,336.53 | 97.97 | |
| Weekly S1 | 11,359.70 | 23.17 | Yes! The Weekly S1 is close to the Daily S2. |
| Low | 11,500.33 | 140.63 | |
| Weekly Pivot | 11,525.80 | 25.47 | Yes! The Weekly Pivot is close to the Low. |
| Open | 11,573.14 | 47.34 | |
| Daily S1 | 11,576.43 | 3.29 | Yes! The Daily S1 is close to the Open. |
| 61.8% Down from Intraday High | 11,654.54 | 78.11 | |
| 50% Down from Intraday High | 11,702.17 | 47.63 | |
| Daily Pivot | 11,740.22 | 38.05 | Yes! The Daily Pivot is close to the 50% Down from Intraday High. |
| 38.2% Down from Intraday High | 11,749.81 | 9.59 | Yes! The 38.2% Down from Intraday High is close to the Daily Pivot. |
| Close | 11,816.32 | 66.51 | |
| High | 11,904.02 | 87.70 | |
| Daily R1 | 11,980.12 | 76.10 | |
| Weekly R1 | 11,982.41 | 2.30 | Yes! The Weekly R1 is close to the Daily R1. |
| Daily R2 | 12,143.91 | 161.50 | |
| Weekly R2 | 12,148.51 | 4.59 | Yes! The Weekly R2 is close to the Daily R2. |
| Monthly R1 | 12,269.65 | 121.14 | |
| Monthly R2 | 12,722.98 | 453.33 |
I pre-released a new version of Patternz (twice. I'm up to 7.0.0.45). It has the ability to filter chart patterns by various traits. See the List Form, Filter button (middle bottom of the form). I'm still working on enhancements to the program so send me your ideas for improvement and maybe you'll see it soon. Version 45 has some important bug fixes.
$ $ $
Here's the updated 2023 forecast, presented in slider format.
$ $ $
Based on sector performance from Fidelity, the best performing sectors for year-to-date performance as of 1/30/2023 were... (The numbering is how they ranked a month ago.)
The folks at two firms polled by Fidelity weigh the sectors in this order, as of 1/31/23.
Here's how they rank the industries, but only the top 10 appear. One-year change, as of 1/30/23. The numbering is how they ranked a month ago.
$ $ $
Here's a symbol list of 134 chart and candlestick patterns (13 "investment grade" candle patterns) found in today's securities using my version of Patternz: DDD, AEIS, AJRD, AA, AEO, AFG, ANIK, ATR, ARCB, ANET, ARW, AVNT, AVA, BKH, BOOT, BFH, BCO, BBW, CNP, CRL, CLF, CTSH, GLW, XRAY, DRQ, BOOM, RE, EVRG, FICO, FAST, FE, FDP, GNW, GPN, GS, GOOGL, GPRO, GGG, HLIT, HAYN, HSII, HELE, HUBG, IIIN, PODD, ITGR, TILE, NVTA, JBLU, KELYA, KFRC, KBAL, LAMR, L, LXU, MTSI, MCHX, MAS, MTRX, MDC, MLI, NEU, NEE, OXM, PTEN, PAYX, PNW, PGR, PHM, QTWO, RMBS, RGS, ROG, ROST, RES, SRE, SCI, SMAR, SPSC, SSYS, SNPS, TFX, TEVA, TDG, RIG, TREX, UNM, VMI, MDRX, VRTX, V, WERN, WMB, WOLF, IAI, IHE, ICF, SOXX, IYF, EWK, EWC, EEM, EWG, EWH, EWJ, EWM, EWS, EWY, EWD, EWL, EWT, TUR, DBA, PBE, PEJ, PJP, IXN, XLY, XLI, XLK, USO, SMH, VHT, VIS. Click this link for details (pattern type, start and end dates).
For a list of small patterns (those a few days wide) click this link.
-- Thomas Bulkowski
![]()
Support this site! Clicking any of the books (below) takes you to
Amazon.com If you buy ANYTHING while there, they pay for the referral.
Legal notice for paid links: "As an Amazon Associate I earn from qualifying purchases."
|
My Stock Market Books
|
My Novels
Orb Foresight Rewrite Coming!
|