As of 04/30/2026
Indus: 49,652 +790.33 +1.6%
Trans: 20,794 +262.22 +1.3%
Utils: 1,165 +22.58 +2.0%
Nasdaq: 24,892 +219.07 +0.9%
S&P 500: 7,209 +73.06 +1.0%
|
YTD
+3.3%
+19.8%
+9.1%
+7.1%
+5.3%
|
|
As of 04/30/2026
Indus: 49,652 +790.33 +1.6%
Trans: 20,794 +262.22 +1.3%
Utils: 1,165 +22.58 +2.0%
Nasdaq: 24,892 +219.07 +0.9%
S&P 500: 7,209 +73.06 +1.0%
|
YTD
+3.3%
+19.8%
+9.1%
+7.1%
+5.3%
|
|
As of 04/30/2026
Indus: 49,652 +790.33 +1.6%
Trans: 20,794 +262.22 +1.3%
Utils: 1,165 +22.58 +2.0%
Nasdaq: 24,892 +219.07 +0.9%
S&P 500: 7,209 +73.06 +1.0%
|
YTD
+3.3%
+19.8%
+9.1%
+7.1%
+5.3%
| |
|
| ||
Released 1/31/2022.
Below is the updated forecast for 2023 as of the close on January 31, 2023. Captions appear below the pictures for guidance, so be sure to scroll down far enough to read them.
On some of the charts (all except the CPI chart) the prediction in red is based on the work of Edgar Lawrence Smith in the 1930s. Smith said that the stock market followed a 10-year cycle. Each year tended to repeat the behavior of the year a decade earlier. In other words, if you averaged all years ending in 1 (2001, 1991, 1981 and so on), that would give you a forecast for 2011. For 2012, you'd make a similar average, only use 2002, 1992, 1982, and so on. That's what I did for the market forecast charts which follow.
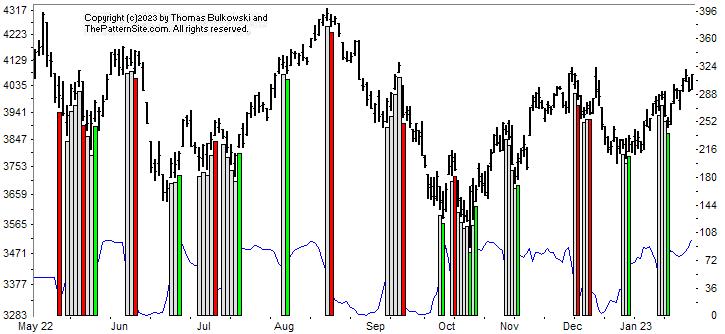
The chart pattern indicator, shown here, remains bullish as the green bar on the far right of the chart shows. This does not predict what will happen in the future like the remaining charts do, but we can make a guess.
The chart shows the index hitting overhead resistance, so we can expect the markets to head lower in the next few weeks. However, earnings could cause the index to spike upward or downward.
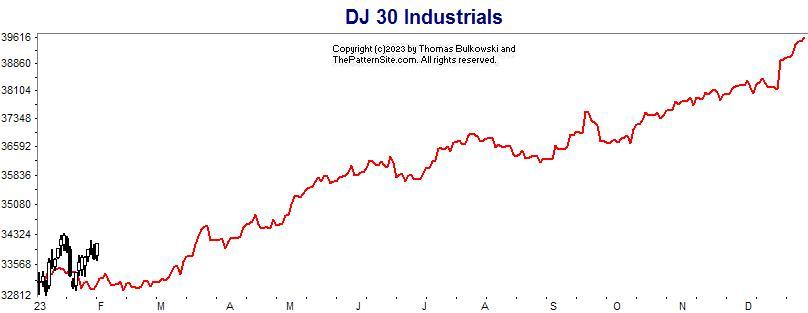
This is a chart of the Dow industrials on the daily scale. The 2023 forecast is in red, made at the start of January.
The forecast for the Dow is the most robust because my data for the index goes back to the 1920s. We see the Dow tracking the forecast as it moves sideways. Going into March, I expect the index to begin its trend upward, if the Dow follows what has happened over the last 90 years.
Looking ahead, we know that the Dow follows January 76% of the time as of a study I did in 2017. Breaking that down, if January closes higher (which it has), expect the Dow to also close higher 53% of the time. If January closed lower, the Dow followed it almost 23% of the time, giving a combined correct score of 76%.
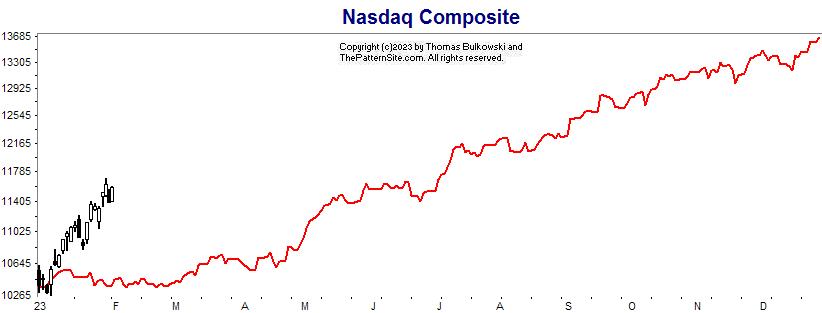
This is the Nasdaq on the daily chart.
The index is outperforming the forecast by a wide margin as the chart shows. I believe this is a recovery from the slide that started in November 2021. This shows the index closing about 30% higher from the predicted February low.
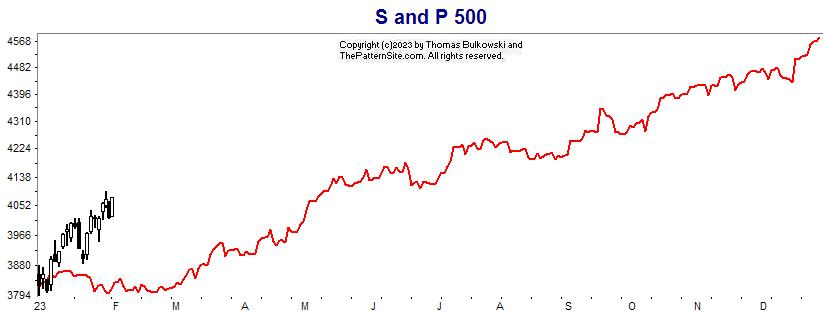
Here's the S&P 500 index on the daily scale.
The index looks similar to the Nasdaq, which we just reviewed. The S&P index peaked in January 2022 (a year ago), and it's bouncing back from that tumble.
Look for the index to close about 20% higher than the predicted February low.
Support this site! Clicking any of the books (below) takes you to
Amazon.com If you buy ANYTHING while there, they pay for the referral.
Legal notice for paid links: "As an Amazon Associate I earn from qualifying purchases."
|
My Stock Market Books
|
My Novels
Orb Foresight Rewrite Coming!
|