
As of 04/28/2026
Indus: 49,142 -25.86 -0.1%
Trans: 20,733 -111.00 -0.5%
Utils: 1,157 +1.83 +0.2%
Nasdaq: 24,664 -223.30 -0.9%
S&P 500: 7,139 -35.11 -0.5%
|
YTD
+2.2%
+19.4%
+8.3%
+6.1%
+4.3%
|
|
As of 04/28/2026
Indus: 49,142 -25.86 -0.1%
Trans: 20,733 -111.00 -0.5%
Utils: 1,157 +1.83 +0.2%
Nasdaq: 24,664 -223.30 -0.9%
S&P 500: 7,139 -35.11 -0.5%
|
YTD
+2.2%
+19.4%
+8.3%
+6.1%
+4.3%
| |
|
| ||
$ $ $
I show another slider trading quiz featuring Bump-and-run reversal bottom.
$ $ $
Here's a symbol list of 139 chart and candlestick patterns (13 "investment grade" candle patterns) found in today's securities using my version of Patternz: ABM, AXDX, ALRM, ALGT, ALL, DOX, AXP, AMN, AMAT, AIZ, AGO, AVNT, BIO, BAH, BMY, CDNS, CDAY, CHKP, CLNE, CLX, CNA, CNO, DSGR, ^DJI, EFX, EQT, EL, EVH, FAST, FCX, FDP, GPS, GPN, GES, HP, HNI, HOLX, JBHT, IIIN, IBKR, TILE, IRM, KMT, KFRC, KLAC, LZB, LH, LANC, LLY, MCHX, MTRX, MRCY, MLKN, MOS, MLI, NOV, NFLX, NTAP, NJR, NWL, NKE, JWN, NTNX, ON, OR, PANW, PTEN, POR, ^GSPC, SBH, SAIC, SCI, SKYW, SXI, SCS, SNPS, TPR, TDOC, TEVA, TXN, TKR, TRV, TREX, SLCA, WSM, WOLF, WWW, WWD, IYK, IYE, IHE, DDM, BOTZ, IHF, IYZ, IEV, MXI, EWA, EWO, EWC, EEM, EWQ, EWG, EWI, EWJ, EWM, EPP, EWS, EZA, EWY, EWP, EWD, EWL, EWT, THD, EWU, PXJ, PJP, ROBO, XLP, XLE, VHT, VIS. Click this link for details (pattern type, start and end dates).
For a list of small patterns (those a few days wide) click this link.
$ $ $
The following table shows where Fibonacci retrace values of the day's high-low range are plus pivot points, calculated on the Dow industrials, sorted by value. When several are near each other (small differences), the area might act as support or resistance.
-- Thomas Bulkowski
![]()
| © 2023 ThePatternSite.com Metric | Value | Diff | Close (within 10% of the high-low range for the day)? |
| Monthly S2 | 31,314.17 | ||
| Weekly S2 | 31,897.79 | 583.63 | |
| Monthly S1 | 32,121.56 | 223.77 | |
| Daily S2 | 32,357.73 | 236.16 | |
| Weekly S1 | 32,413.38 | 55.65 | |
| Low | 32,537.54 | 124.16 | |
| Open | 32,537.54 | 0.00 | Yes! The Open is close to the Low. |
| Daily S1 | 32,643.34 | 105.80 | |
| 61.8% Down from Intraday High | 32,715.33 | 71.99 | |
| 50% Down from Intraday High | 32,770.25 | 54.92 | |
| Daily Pivot | 32,823.16 | 52.90 | |
| 38.2% Down from Intraday High | 32,825.18 | 2.02 | Yes! The 38.2% Down from Intraday High is close to the Daily Pivot. |
| Weekly Pivot | 32,842.79 | 17.61 | Yes! The Weekly Pivot is close to the 38.2% Down from Intraday High. |
| Close | 32,928.96 | 86.18 | |
| High | 33,002.97 | 74.01 | |
| Daily R1 | 33,108.77 | 105.80 | |
| Monthly Pivot | 33,134.60 | 25.82 | Yes! The Monthly Pivot is close to the Daily R1. |
| Daily R2 | 33,288.59 | 153.99 | |
| Weekly R1 | 33,358.37 | 69.78 | |
| Weekly R2 | 33,787.77 | 429.41 | |
| Monthly R1 | 33,941.99 | 154.22 | |
| Monthly R2 | 34,955.03 | 1,013.04 |
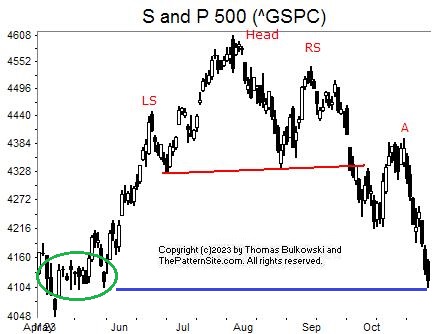
This is a chart of the S&P 500 index on the daily scale.
The index is making a straight line run down to 0. My guess, is that it'll stop before it crashes.
September was not an easy month and October is ending hard, too. Will the trend change?
Yes!
When? I'm thinking this coming week. Why? Because of that congestion (support) we see on the far left of the chart in May (circled in green). That should support the index. However, we're at the bottom of the circle now. Hmmm.
I show a head-and-shoulders top. at the labels. It's not pretty, is it? The left shoulder should be near in price to the right one, but it's not. At A, we see the index pull back to the neckline (the sloping red line) and coast above it.
All in all, I expect to see the index turn higher this week.
![]()
The following is a brief review of how the markets performed over time. The numbers refer to the close-to-close move in the Dow industrials.
No options expire this week.
![]()
The following is based on an SFO article in December 2004 by John Seekinger, titled, "Take a two-dimensional approach." He offers these tips.
| Index | S2 | S1 | Pivot | R1 | R2 |
| Dow Industrials (^DJI): Daily | 32,050 | 32,234 | 32,511 | 32,694 | 32,971 |
| Weekly | 31,727 | 32,072 | 32,672 | 33,017 | 33,617 |
| Monthly | 31,144 | 31,781 | 32,964 | 33,601 | 34,785 |
| S&P500 (^GSPC): Daily | 4,073 | 4,095 | 4,126 | 4,148 | 4,179 |
| Weekly | 4,005 | 4,061 | 4,160 | 4,217 | 4,316 |
| Monthly | 3,915 | 4,016 | 4,205 | 4,306 | 4,495 |
| Nasdaq (^IXIC): Daily | 12,500 | 12,572 | 12,672 | 12,743 | 12,844 |
| Weekly | 12,159 | 12,401 | 12,786 | 13,028 | 13,412 |
| Monthly | 11,797 | 12,220 | 12,967 | 13,390 | 14,137 |
Here are the formulas:
![]()
Earnings season is either underway or should be starting soon. The sessions could be more volatile.
Here's a symbol list of 191 chart and candlestick patterns (13 "investment grade" candle patterns) found in today's securities using my version of Patternz: ABT, ABM, AMD, AFL, A, ALRM, ALK, ALGT, AMED, AEL, ATR, ACGL, ASH, AVA, BCPC, BBY, BIG, BIO, BIIB, BAH, BRC, BFH, BMY, BR, BRKR, CBT, CDNS, CLS, CNP, CDAY, CF, CRL, CHKP, CVX, CHS, CLNE, GLW, COTY, CCK, DECK, XRAY, DVN, DDS, DRQ, EXP, EIX, EOG, EFX, EQT, EL, EVH, XOM, FAST, FLS, FCX, GPS, GS, GOOGL, HL, HP, HNI, HOLX, HOV, HUBG, IDA, IDXX, INFN, PODD, TILE, NVTA, IRM, JBLU, JNJ, KLAC, KSS, LZB, LAMR, LANC, LEG, LLY, RAMP, MA, MRCY, MLKN, MOS, NBR, NFLX, NJR, NEWR, NKE, JWN, NWPX, NTNX, OXY, OMC, OUT, PANW, PAYX, PETS, PFE, PCG, PNW, PXD, POR, PPG, PRU, QTWO, ROK, ROP, SBH, SLB, SAIC, SKYW, SXI, SCS, SNPS, TPR, TECH, TDOC, TTD, TKR, TOL, UHAL, SLCA, UIS, UNM, VFC, VMI, VRSN, V, WERN, WSM, WOLF, WWW, WWD, ITA, IYK, IYE, IEZ, IHE, IYH, IHF, IYZ, IEO, EWO, EWZ, EIS, EWS, EZA, EWY, EWP, EWD, THD, PPA, DBA, PJP, XLY, XLP, XLE, XLV, XRT, XAR, VHT, MGK. Click this link for details (pattern type, start and end dates).
For a list of small patterns (those a few days wide) click this link.
The below industries were the best (rank 1) or worst performing of those I follow.
|
-- Thomas Bulkowski
![]()
I released an article that tests the Weinstein setup.
$ $ $
Here's a symbol list of 189 chart and candlestick patterns (13 "investment grade" candle patterns) found in today's securities using my version of Patternz: ABM, AXDX, AFL, ATSG, ALRM, ALGT, AYX, AEL, AFG, APA, AAPL, ATR, ACGL, ANET, ARW, ASH, ATO, AVA, AZTA, BECN, BBY, BOOT, BAH, BFH, BMY, BR, BLDR, CACI, CDNS, CPB, CE, CLS, CDAY, CF, CLNE, CLF, CGNX, COTY, CRH, XRAY, DRQ, EXP, EOG, EPAM, EQT, EVH, EXPD, FAST, FIS, FLEX, FLS, FORM, FTNT, FNV, GNW, GPN, GL, GOOGL, THG, HE, HQY, HTLD, HP, HNI, HOLX, IEX, IDXX, ILMN, IBP, PODD, ITGR, TILE, ISRG, JBLU, JNJ, KALU, KLAC, LANC, LDOS, LLY, RAMP, LOW, LPLA, LXU, MA, MRCY, META, MU, MLKN, NBR, NOV, NFLX, NTGR, NEWR, NI, NOC, NTNX, OGE, OLN, OMCL, ASGN, OXM, PANW, PTEN, PCTY, PCG, PFG, KWR, DGX, RMBS, RJF, ROL, SBH, SAIC, NOW, SHOP, STR, SWN, SPSC, SCS, SSYS, SUM, SNPS, TRGP, TDOC, TTD, TOL, TSCO, TG, TREX, TWLO, SLCA, VMI, VMC, WU, WSM, WOLF, WWW, WWD, IYK, IYC, IYE, IEZ, IHE, FTEC, FDN, QTEC, ICF, IHF, IYZ, SLV, IGE, IHI, EWK, EEM, EWG, EWH, EIS, EWW, EPP, EWS, EZA, EWY, EWT, TUR, PEJ, PXJ, ROBO, XLP, XLU, MGK. Click this link for details (pattern type, start and end dates).
For a list of small patterns (those a few days wide) click this link.
$ $ $
You can find setups based on a Fibonacci retrace by clicking on the link.
The following patterns were found manually, not using Patternz. Mr. Bulkowski has excluded any securities he owns from appearing in the list. However, he may add any of the securities listed to his portfolio at any time, just as you can.
In the table below, the red and green colors are based on the historical breakout direction for the associated chart pattern. If a high and tight flag appears, the start and end dates highlight the flagpole only and not the flag.
For details about the chart patterns, click here.
-- Thomas Bulkowski
![]()
| Symbol | Chart Pattern | Bullish Bearish | Start | End | Industry |
| ABM | Pipe top | 10/09/2023 | 10/16/2023 | Industrial Services | |
| ADTN | Head-and-shoulders top | 08/14/2023 | 10/02/2023 | Telecom. Equipment | |
| AKAM | Double Top, Eve and Eve | 09/20/2023 | 10/11/2023 | E-Commerce | |
| AYX | Rounding top | 09/05/2023 | 10/26/2023 | Computer Software and Svcs | |
| ANET | Double Top, Eve and Eve | 09/01/2023 | 10/10/2023 | E-Commerce | |
| ATO | Pipe top | 10/09/2023 | 10/16/2023 | Natural Gas (Diversified) | |
| BAH | Pipe top | 10/09/2023 | 10/16/2023 | IT Services | |
| BR | Head-and-shoulders top | 08/14/2023 | 10/10/2023 | Information Services | |
| CDNS | Pipe top | 10/09/2023 | 10/16/2023 | Computer Software and Svcs | |
| CAL | Triple top | 09/01/2023 | 10/17/2023 | Shoe | |
| CPB | Double Bottom, Adam and Adam | 10/06/2023 | 10/12/2023 | Food Processing | |
| CDAY | Pipe top | 10/09/2023 | 10/16/2023 | Information Services | |
| CHD | Double Bottom, Adam and Adam | 10/09/2023 | 10/12/2023 | Household Products | |
| CCRN | Double Top, Adam and Eve | 09/01/2023 | 09/28/2023 | Human Resources | |
| DUK | Head-and-shoulders complex bottom | 09/05/2023 | 10/23/2023 | Electric Utility (East) | |
| EVH | Double Top, Eve and Adam | 10/10/2023 | 10/16/2023 | Healthcare Information | |
| EXPD | Broadening bottom | 08/14/2023 | 10/24/2023 | Air Transport | |
| FE | Head-and-shoulders bottom | 09/06/2023 | 10/23/2023 | Electric Utility (East) | |
| FMC | Dead-cat bounce | 10/23/2023 | 10/23/2023 | Chemical (Basic) | |
| FORM | Triple top | 09/29/2023 | 10/19/2023 | Semiconductor | |
| FTNT | Falling wedge | 09/26/2023 | 10/26/2023 | Computer Software and Svcs | |
| HE | Head-and-shoulders bottom | 09/25/2023 | 10/23/2023 | Electric Utility (West) | |
| HNI | Pipe top | 10/09/2023 | 10/16/2023 | Furn/Home Furnishings | |
| HUBG | Double Top, Adam and Adam | 09/14/2023 | 10/17/2023 | Trucking/Transp. Leasing | |
| HURC | Pipe top | 08/28/2023 | 09/05/2023 | Machinery | |
| INTC | Head-and-shoulders top | 07/31/2023 | 10/12/2023 | Semiconductor | |
| INTU | Double Top, Eve and Eve | 09/08/2023 | 10/12/2023 | Computer Software and Svcs | |
| KLAC | Pipe top | 10/09/2023 | 10/16/2023 | Semiconductor Cap Equip. | |
| MTSI | Triple top | 08/31/2023 | 10/10/2023 | Semiconductor | |
| M | Double Bottom, Eve and Eve | 09/21/2023 | 10/13/2023 | Retail Store | |
| MCHX | Big W | 09/25/2023 | 10/09/2023 | Advertising | |
| MA | Head-and-shoulders top | 07/27/2023 | 10/12/2023 | Financial Services | |
| MRCY | Pipe top | 10/09/2023 | 10/16/2023 | Computers and Peripherals | |
| MLKN | Pipe top | 10/09/2023 | 10/16/2023 | Furn/Home Furnishings | |
| NFLX | Pipe bottom | 10/09/2023 | 10/16/2023 | Internet | |
| NTAP | Head-and-shoulders top | 09/29/2023 | 10/17/2023 | Computers and Peripherals | |
| NWL | Double Bottom, Eve and Adam | 10/12/2023 | 10/23/2023 | Household Products | |
| NEE | Pipe bottom | 10/02/2023 | 10/09/2023 | Electric Utility (East) | |
| NTNX | Pipe top | 10/09/2023 | 10/16/2023 | E-Commerce | |
| NVDA | Head-and-shoulders top | 07/14/2023 | 10/12/2023 | Semiconductor | |
| PKG | Triple top | 09/29/2023 | 10/18/2023 | Packaging and Container | |
| PRU | Head-and-shoulders top | 08/07/2023 | 10/17/2023 | Insurance (Life) | |
| REGN | Double Top, Eve and Adam | 08/23/2023 | 10/13/2023 | Biotechnology | |
| R | Double Top, Adam and Adam | 09/29/2023 | 10/17/2023 | Trucking/Transp. Leasing | |
| SBH | Ugly double bottom | 10/13/2023 | 10/23/2023 | Toiletries/Cosmetics | |
| SAIC | Pipe top | 10/09/2023 | 10/16/2023 | IT Services | |
| SKX | Double Top, Adam and Adam | 09/29/2023 | 10/17/2023 | Shoe | |
| SCS | Pipe top | 10/09/2023 | 10/16/2023 | Furn/Home Furnishings | |
| SNPS | Pipe top | 10/09/2023 | 10/16/2023 | Computer Software and Svcs | |
| TXT | Double Top, Adam and Adam | 09/20/2023 | 10/17/2023 | Diversified Co. | |
| TTD | Double Top, Eve and Eve | 09/12/2023 | 10/11/2023 | Advertising | |
| WAT | Horn top | 08/28/2023 | 09/11/2023 | Precision Instrument | |
| WU | Double Top, Adam and Eve | 09/28/2023 | 10/24/2023 | Financial Services | |
| WEX | Head-and-shoulders top | 08/10/2023 | 10/17/2023 | Information Services | |
| WSM | Pipe top | 10/09/2023 | 10/16/2023 | Retail (Special Lines) | |
| WWD | Triple top | 08/01/2023 | 10/17/2023 | Precision Instrument |
![]()
Since I post this the night before, check how the futures are trading before market open. Large moves can affect the opening direction.
$ $ $
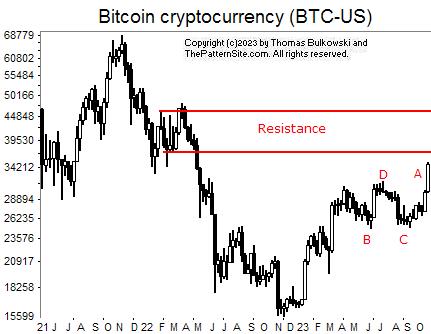
I show a picture of bitcoin on the weekly scale.
BC is a weird looking double bottom. I write 'weird' because the left side fails to extend above the top of the double bottom so that it looks like a bottom. The pattern becomes valid when the currency closes above top D. That happens at A.
A is a tasty rise, however, there's overhead resistance setup by prior peaks/valleys. Even though enthusiasm is high given the rise at A, look for the currency to stall.
$ $ $
Here's a symbol list of 178 chart and candlestick patterns (13 "investment grade" candle patterns) found in today's securities using my version of Patternz: DDD, ABT, ABM, AFL, A, ATSG, ALKS, ALGT, AYX, AMAT, ADM, ANET, ATO, ADP, AVY, BAX, BECN, BIG, BIO, BOOT, BAH, BRC, BFH, BR, CACI, CDNS, CLS, CX, CDAY, CLNE, CLF, CNO, CNX, CGNX, CMTL, CONN, CSGP, CRH, XRAY, ^DJI, EXP, ELV, WIRE, EPAM, EFX, EQT, EL, EVH, EXPD, EZPW, FICO, FAST, FIS, FORM, FTV, GPS, GD, GE, GNW, GPN, GFS, GOOGL, HTLD, HELE, HP, HNI, HOLX, HUN, IEX, ILMN, IBP, PODD, TILE, ISRG, NVTA, IRM, JBLU, KALU, KEYS, KLAC, KLIC, LH, LRCX, LAMR, LANC, LLY, LNC, MAS, MRCY, MU, MSFT, MLKN, MCO, MOS, MYGN, NBR, NFLX, NJR, NI, NOC, NTNX, OMCL, ASGN, ON, PANW, PATK, PDCO, PTEN, PCTY, PYPL, PFE, PPG, KWR, DGX, RJF, ROK, R, SBH, SLB, SAIC, SHOP, SCCO, SCS, SSYS, SNPS, TDOC, TDY, TER, TXN, TTD, TMO, TWLO, SLCA, VEEV, WEX, WSM, WOLF, WWW, WWD, IYE, ITB, IEZ, DDM, FTEC, FDN, QTEC, IHF, IXN, SLV, EWK, EWI, EWJ, EWM, EZA, EWT, DBA, PXJ, PHO, ROBO, XHB, XLK. Click this link for details (pattern type, start and end dates).
For a list of small patterns (those a few days wide) click this link.
$ $ $
The following table shows where Fibonacci retrace values of the day's high-low range are plus pivot points, calculated on the Nasdaq composite, sorted by value. When several are near each other (small differences), the area might act as support or resistance.
-- Thomas Bulkowski
![]()
| © 2023 ThePatternSite.com Metric | Value | Diff | Close (within 10% of the high-low range for the day)? |
| Monthly S2 | 12,390.43 | ||
| Weekly S2 | 12,508.81 | 118.38 | |
| Monthly S1 | 12,605.83 | 97.01 | |
| Daily S2 | 12,651.13 | 45.30 | |
| Weekly S1 | 12,665.02 | 13.89 | Yes! The Weekly S1 is close to the Daily S2. |
| Daily S1 | 12,736.17 | 71.16 | |
| Low | 12,804.30 | 68.13 | |
| Close | 12,821.22 | 16.92 | Yes! The Close is close to the Low. |
| Daily Pivot | 12,889.35 | 68.13 | |
| 61.8% Down from Intraday High | 12,895.30 | 5.95 | Yes! The 61.8% Down from Intraday High is close to the Daily Pivot. |
| 50% Down from Intraday High | 12,923.41 | 28.11 | |
| 38.2% Down from Intraday High | 12,951.52 | 28.11 | |
| Daily R1 | 12,974.39 | 22.87 | Yes! The Daily R1 is close to the 38.2% Down from Intraday High. |
| Open | 13,039.86 | 65.47 | |
| High | 13,042.52 | 2.66 | Yes! The High is close to the Open. |
| Daily R2 | 13,127.57 | 85.05 | |
| Weekly Pivot | 13,133.63 | 6.07 | Yes! The Weekly Pivot is close to the Daily R2. |
| Monthly Pivot | 13,178.55 | 44.92 | |
| Weekly R1 | 13,289.84 | 111.28 | |
| Monthly R1 | 13,393.95 | 104.11 | |
| Weekly R2 | 13,758.45 | 364.51 | |
| Monthly R2 | 13,966.67 | 208.22 |
This is a picture of the chart pattern indicator on the daily scale. The indicator is the line chart below a chart of the S&P 500 composite.
The CPI is still bearish despite Tuesday's lift.
Look at the CPI line. It's the thin blue one near the bottom right of the chart. It has bounced off zero and is heading higher. That suggests we'll see a change to neutral and maybe green if earnings reports continue to be favorable.
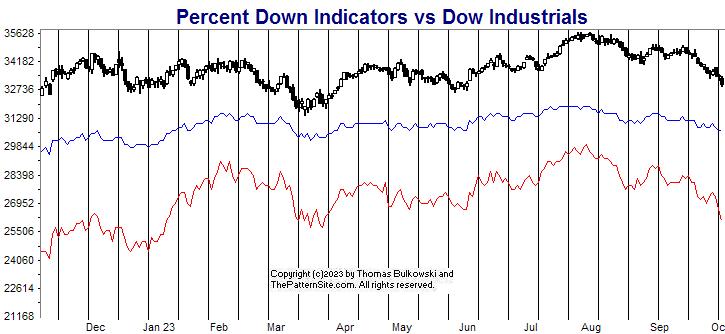
The red line is the percentage of stocks at least 20% below their 1-year high (plotted upside down). The blue line is the average percentage drop of stocks below their 1-year high (plotted upside down).
On Tuesday, 50% of stocks in my database are in bear market territory (down at least 20% from their 1-year high).A week ago, it was 43%.The fewest was 26% on 07/31/2023.And the most was 63% on 10/26/2022.
The 520 stocks in my database are down an average of 23% from their yearly high.A week ago, the average was 20%.The peak was 14% on 07/31/2023.And the bottom was 29% on 11/03/2022.
Both lines are worse off today than they were a week ago. And the difference is by quite a bit, too.
Notice that the most recent low (today's value) on both the red and blue lines are lower than the prior low but price is higher. I show that using green lines for your viewing pleasure.
That divergence suggests the index will drop.
I'm not convinced of that, so I think the index will rise in the coming days. I'm using this dip to add to one of my positions.
$ $ $
Here's a symbol list of 155 chart and candlestick patterns (13 "investment grade" candle patterns) found in today's securities using my version of Patternz: DDD, ABT, ABM, AFL, ATSG, ALRM, ALK, ALGT, AYX, APA, ADM, ATO, ADP, BCPC, BECN, BZH, BIG, BKNG, BAH, BFH, BR, BBW, CACI, CDNS, CDAY, CF, CHKP, CVX, CTAS, CLX, CNO, COP, CR, CROX, CSGS, DHR, XRAY, DVN, FANG, DFS, DRQ, EIX, WIRE, EQT, EVH, EXC, FICO, FAST, FLS, GNW, GPN, HLIT, HTLD, HSII, HELE, HNI, HOLX, IEX, ITW, PODD, INTC, JBLU, JNJ, KALU, KLAC, LHX, LANC, LDOS, LLY, LMT, MHO, MAS, MDC, MRCY, MLKN, MCO, NBR, NFLX, NWL, NXGN, NI, NTNX, NVDA, OXY, ASGN, OUT, PANW, PDCO, PETS, PFE, PPG, PHM, KWR, RJF, RTX, RLI, ROK, ROP, R, SBH, SLB, SAIC, SHW, SMAR, LUV, SCS, SNPS, TRGP, TER, TEVA, TMO, RIG, TG, UHAL, SLCA, UNH, VMI, WRB, WMT, WU, WMB, WSM, WWW, WWD, ZBRA, IAI, IYE, IEZ, IHE, IYZ, IXC, IGE, IEO, EWC, EEM, EIS, EWI, EZA, TUR, PBE, XLE. Click this link for details (pattern type, start and end dates).
For a list of small patterns (those a few days wide) click this link.
-- Thomas Bulkowski
![]()
$ $ $
I show another slider trading quiz featuring Rounding bottoms.
$ $ $
Here's a symbol list of 157 chart and candlestick patterns (13 "investment grade" candle patterns) found in today's securities using my version of Patternz: AXDX, ADTN, AFL, ATSG, ALRM, ALB, ALKS, AYX, AEE, AEP, AFG, AMN, APA, ADM, ADP, AXS, BECN, BIO, BRC, BFH, BR, BBW, CBT, CPB, CX, CDAY, CF, CRL, CNO, CL, CMTL, CONN, CR, CSGS, DVN, D, DOV, DRQ, DTE, EMN, EIX, EVH, XOM, FICO, FARO, FLEX, FLS, FMC, FORM, FTNT, FNV, GPN, GFF, HLIT, HE, HQY, HTLD, HSII, HP, HSY, HOLX, HUN, HURC, IDA, IEX, ITW, NSP, PODD, ITGR, TILE, IPI, NVTA, IRM, KALU, KELYA, KLAC, LAMR, LNC, LXU, MHO, MTSI, MRK, MRCY, MOS, NBR, NFG, NTGR, NEWR, NEE, NOC, NUS, OXY, ON, PTEN, PCG, PPG, PINC, RJF, REGN, RNG, ROK, ROP, R, SBH, SAND, SMG, SMAR, TPR, TGT, TDY, TER, TXT, TTD, TRV, TG, TWLO, SLCA, UGI, UPS, UNM, WMT, IYM, IYC, IYE, IHE, QTEC, IHF, IAT, IYZ, MXI, IGE, EWZ, EIS, EWM, TUR, PBE, XLB, USO, SMH, VAW. Click this link for details (pattern type, start and end dates).
For a list of small patterns (those a few days wide) click this link.
$ $ $
The following table shows where Fibonacci retrace values of the day's high-low range are plus pivot points, calculated on the Dow industrials, sorted by value. When several are near each other (small differences), the area might act as support or resistance.
-- Thomas Bulkowski
![]()
| © 2023 ThePatternSite.com Metric | Value | Diff | Close (within 10% of the high-low range for the day)? |
| Monthly S2 | 31,590.54 | ||
| Monthly S1 | 32,263.47 | 672.94 | |
| Weekly S2 | 32,371.21 | 107.74 | |
| Weekly S1 | 32,653.81 | 282.60 | |
| Daily S2 | 32,678.49 | 24.68 | Yes! The Daily S2 is close to the Weekly S1. |
| Daily S1 | 32,807.45 | 128.96 | |
| Low | 32,892.19 | 84.74 | |
| Close | 32,936.41 | 44.22 | |
| Open | 32,993.02 | 56.61 | |
| Daily Pivot | 33,021.15 | 28.13 | Yes! The Daily Pivot is close to the Open. |
| 61.8% Down from Intraday High | 33,023.09 | 1.94 | Yes! The 61.8% Down from Intraday High is close to the Daily Pivot. |
| 50% Down from Intraday High | 33,063.52 | 40.43 | |
| 38.2% Down from Intraday High | 33,103.95 | 40.43 | |
| Daily R1 | 33,150.11 | 46.16 | |
| High | 33,234.85 | 84.74 | |
| Daily R2 | 33,363.81 | 128.96 | |
| Weekly Pivot | 33,400.72 | 36.91 | |
| Monthly Pivot | 33,519.88 | 119.16 | |
| Weekly R1 | 33,683.32 | 163.45 | |
| Monthly R1 | 34,192.81 | 509.49 | |
| Weekly R2 | 34,430.23 | 237.42 | |
| Monthly R2 | 35,449.21 | 1,018.98 |
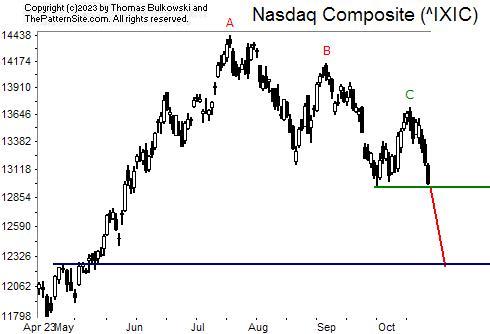
This is a chart of the Nasdaq composite on the daily scale.
ABC is a chart pattern cleverly titled, three falling peaks. It confirms as a valid chart pattern when the index closes below the lowest valley between the three peaks. That's the horizontal green line and it hasn't happened yet.
The green line also represents support setup by prior valleys.
If the index were to close below the line, it could mean a drop to the blue line (which looks black). All of this potential down move rests on how well earnings come in.
I'm cautious. With today's (Friday's) downward plunge, it looks certain that we'll make a lower low on Monday but it may close higher. If that's the case, then the indices could rebound. Otherwise, look out below.
![]()
The following is a brief review of how the markets performed over time. The numbers refer to the close-to-close move in the Dow industrials.
No options expire this week.
![]()
The following is based on an SFO article in December 2004 by John Seekinger, titled, "Take a two-dimensional approach." He offers these tips.
| Index | S2 | S1 | Pivot | R1 | R2 |
| Dow Industrials (^DJI): Daily | 32,916 | 33,022 | 33,224 | 33,329 | 33,531 |
| Weekly | 32,435 | 32,781 | 33,464 | 33,811 | 34,494 |
| Monthly | 31,654 | 32,391 | 33,584 | 34,320 | 35,513 |
| S&P500 (^GSPC): Daily | 4,188 | 4,206 | 4,241 | 4,259 | 4,295 |
| Weekly | 4,110 | 4,167 | 4,280 | 4,337 | 4,451 |
| Monthly | 4,052 | 4,138 | 4,302 | 4,388 | 4,552 |
| Nasdaq (^IXIC): Daily | 12,846 | 12,915 | 13,046 | 13,115 | 13,246 |
| Weekly | 12,563 | 12,773 | 13,188 | 13,398 | 13,813 |
| Monthly | 12,445 | 12,714 | 13,233 | 13,502 | 14,021 |
Here are the formulas:
![]()
Earnings season is either underway or should be starting soon. The sessions could be more volatile.
Here's a symbol list of 155 chart and candlestick patterns (13 "investment grade" candle patterns) found in today's securities using my version of Patternz: ABT, ADTN, AFL, A, ATSG, AKAM, ALRM, ALB, AYX, APA, APOG, ADP, AVNT, BECN, BKH, BKNG, BRC, BR, BBW, BG, CPB, CE, CX, COR, CDAY, CHKP, CL, CMI, DVN, DFS, DRQ, BOOM, EOG, XOM, FLEX, FTNT, IT, GFS, GES, THG, HLIT, HQY, HSII, HP, HSIC, HSY, IEX, ITW, INCY, NSP, IIIN, ITGR, ISRG, NVTA, KELYA, KSS, LHX, LAMR, LNC, LPLA, M, MTRX, MRK, MRCY, MGEE, MOS, MLI, NOV, NEE, NOC, NUS, ASGN, ON, PANW, PYPL, PFE, PCG, POR, PSTG, QTWO, RL, RJF, ROK, ROL, ROP, SBH, SAND, SHOP, STR, SPSC, TGT, TER, TTD, TJX, TWLO, UHAL, UNM, VECO, WMT, WLK, WWW, IYK, IYE, FTEC, FXL, FXI, BOTZ, ICF, IYH, IAT, IEV, MXI, IXN, SLV, IYF, EWA, EWO, EWK, EEM, EWG, EWH, EIS, EPP, EWS, EWY, EWD, EWL, EWT, THD, TUR, EWU, DBA, PEJ, ROBO, XLY, UNG, USO. Click this link for details (pattern type, start and end dates).
For a list of small patterns (those a few days wide) click this link.
The below industries were the best (rank 1) or worst performing of those I follow.
|
-- Thomas Bulkowski
![]()
$ $ $
Here's a symbol list of 165 chart and candlestick patterns (13 "investment grade" candle patterns) found in today's securities using my version of Patternz: ANF, ABM, AYI, ADTN, AKAM, ALRM, ALK, ALB, AMWD, AME, APA, APOG, AAPL, AMAT, BMI, BECN, BIO, BKH, BKNG, BOOT, BAH, BRC, BMY, BR, BBW, BLDR, BG, CPB, CE, CX, CDAY, CHKP, CHD, CGNX, CL, CONN, COP, CSGP, CR, CRH, CMI, DVN, DOV, DUK, BOOM, EXP, EMR, EOG, EFX, XOM, EZPW, FICO, FLEX, FCX, FDP, GNW, GGG, GES, HBI, HLIT, HTLD, HELE, HSIC, HD, HOV, JBHT, ITW, INCY, ITGR, IBKR, ISRG, JNJ, KELYA, KLAC, LHX, LAMR, LEG, LEN, LOW, MTSI, MAN, MRO, MAS, MRK, MU, MS, MOS, MLI, MUR, NOV, NEWR, NEE, NWPX, ON, OMI, PANW, PRFT, PFE, PCG, PPG, QCOM, RJF, REGN, ROK, ROP, SEIC, SMTC, SHW, STR, SKYW, SWX, SXI, SCS, SUM, TGT, TER, TJX, TRV, TZOO, TREX, VECO, WMT, WERN, WLK, WMB, WWW, IAI, IYK, IYE, IHE, FXI, IYH, IXC, EWO, EWK, EEM, EWH, EIS, EWW, EWS, EWD, EWL, THD, TUR, EWU, IBB, DBA, PBE, XLV, USO, VHT. Click this link for details (pattern type, start and end dates).
For a list of small patterns (those a few days wide) click this link.
$ $ $
You can find setups based on a Fibonacci retrace by clicking on the link.
The following patterns were found manually, not using Patternz. Mr. Bulkowski has excluded any securities he owns from appearing in the list. However, he may add any of the securities listed to his portfolio at any time, just as you can.
In the table below, the red and green colors are based on the historical breakout direction for the associated chart pattern. If a high and tight flag appears, the start and end dates highlight the flagpole only and not the flag.
For details about the chart patterns, click here.
-- Thomas Bulkowski
![]()
| Symbol | Chart Pattern | Bullish Bearish | Start | End | Industry |
| AEIS | Double Top, Eve and Adam | 10/02/2023 | 10/12/2023 | Semiconductor | |
| ALB | Double Top, Adam and Adam | 09/29/2023 | 10/12/2023 | Chemical (Diversified) | |
| AA | Triangle, symmetrical | 09/26/2023 | 10/18/2023 | Aerospace/Defense | |
| AFG | Triangle, descending | 08/31/2023 | 10/19/2023 | Insurance (Prop/Casualty) | |
| AMWD | Double Bottom, Adam and Adam | 08/18/2023 | 08/30/2023 | Building Materials | |
| APH | Triple top | 09/29/2023 | 10/12/2023 | Electronics | |
| ANIK | Ugly double bottom | 09/08/2023 | 10/09/2023 | Biotechnology | |
| APA | Pipe bottom | 10/02/2023 | 10/09/2023 | Petroleum (Producing) | |
| AVY | Triple top | 09/20/2023 | 10/11/2023 | Packaging and Container | |
| BKNG | Double Top, Eve and Eve | 08/09/2023 | 09/14/2023 | Internet | |
| BOOT | Double Top, Adam and Adam | 10/11/2023 | 10/17/2023 | Shoe | |
| CI | Three Rising Valleys | 08/17/2023 | 10/04/2023 | Medical Services | |
| CL | Pipe bottom | 10/02/2023 | 10/09/2023 | Household Products | |
| CTS | Double Top, Eve and Adam | 09/19/2023 | 10/06/2023 | Electronics | |
| DECK | Double Bottom, Adam and Adam | 10/06/2023 | 10/13/2023 | Shoe | |
| DVN | Pipe bottom | 10/02/2023 | 10/09/2023 | Natural Gas (Diversified) | |
| DDS | Double Bottom, Adam and Adam | 10/06/2023 | 10/13/2023 | Retail Store | |
| DFS | Triple top | 10/02/2023 | 10/17/2023 | Financial Services | |
| BOOM | Head-and-shoulders top | 08/23/2023 | 09/28/2023 | Metal Fabricating | |
| EXP | Broadening bottom | 09/21/2023 | 10/19/2023 | Cement and Aggregates | |
| ELV | Head-and-shoulders bottom | 09/19/2023 | 10/16/2023 | Medical Services | |
| XOM | Double Bottom, Adam and Adam | 10/06/2023 | 10/11/2023 | Petroleum (Integrated) | |
| FFIV | Broadening bottom | 09/14/2023 | 09/29/2023 | Internet | |
| FDX | Double Top, Eve and Eve | 07/31/2023 | 09/29/2023 | Air Transport | |
| FLEX | Double Top, Eve and Eve | 09/29/2023 | 10/11/2023 | Electronics | |
| GE | Double Top, Eve and Eve | 07/25/2023 | 09/20/2023 | Diversified Co. | |
| GILD | Double Bottom, Adam and Adam | 09/06/2023 | 10/03/2023 | Biotechnology | |
| GES | Head-and-shoulders complex bottom | 09/27/2023 | 10/13/2023 | Apparel | |
| THG | Head-and-shoulders complex bottom | 06/28/2023 | 10/11/2023 | Insurance (Prop/Casualty) | |
| HLIT | Pipe bottom | 10/02/2023 | 10/09/2023 | Telecom. Equipment | |
| HSII | Double Top, Adam and Eve | 09/20/2023 | 10/12/2023 | Human Resources | |
| IEX | Double Top, Adam and Adam | 09/28/2023 | 10/11/2023 | Machinery | |
| ITW | Head-and-shoulders top | 10/06/2023 | 10/17/2023 | Metal Fabricating | |
| IIIN | Head-and-shoulders top | 09/28/2023 | 10/17/2023 | Building Materials | |
| JNJ | Double Top, Eve and Adam | 10/10/2023 | 10/17/2023 | Medical Supplies | |
| KSS | Double Bottom, Adam and Adam | 10/06/2023 | 10/13/2023 | Retail Store | |
| LAMR | Pipe bottom | 10/02/2023 | 10/09/2023 | Advertising | |
| LEG | Double Top, Adam and Eve | 09/29/2023 | 10/11/2023 | Furn/Home Furnishings | |
| L | Triple bottom | 08/22/2023 | 10/04/2023 | Insurance (Prop/Casualty) | |
| MTSI | Double Top, Eve and Eve | 09/28/2023 | 10/10/2023 | Semiconductor | |
| MLM | Triple top | 10/06/2023 | 10/17/2023 | Cement and Aggregates | |
| MRK | Double Top, Adam and Adam | 10/09/2023 | 10/16/2023 | Drug | |
| MLI | Head-and-shoulders top | 09/20/2023 | 10/11/2023 | Metal Fabricating | |
| NJR | Broadening top, right-angled and descending | 08/15/2023 | 10/18/2023 | Natural Gas (Distributor) | |
| NEU | Broadening top, right-angled and descending | 09/20/2023 | 10/19/2023 | Chemical (Specialty) | |
| NKE | Pipe bottom | 09/18/2023 | 09/25/2023 | Shoe | |
| PG | Double Bottom, Adam and Adam | 10/06/2023 | 10/12/2023 | Household Products | |
| DGX | Triangle, symmetrical | 09/26/2023 | 10/19/2023 | Medical Services | |
| RCKY | Double Bottom, Adam and Eve | 10/09/2023 | 10/12/2023 | Shoe | |
| SMTC | Dead-cat bounce | 10/19/2023 | 10/19/2023 | Semiconductor Cap Equip. | |
| SKYW | Big M | 07/28/2023 | 09/01/2023 | Air Transport | |
| SR | Pipe bottom | 09/25/2023 | 10/02/2023 | Natural Gas (Distributor) | |
| TRV | Double Bottom, Eve and Eve | 10/04/2023 | 10/12/2023 | Insurance (Prop/Casualty) | |
| UHAL | Double Top, Eve and Adam | 10/10/2023 | 10/17/2023 | Trucking/Transp. Leasing | |
| VECO | Double Top, Adam and Adam | 09/29/2023 | 10/13/2023 | Precision Instrument | |
| VRTX | Triple bottom | 08/04/2023 | 10/03/2023 | Biotechnology | |
| VMC | Triple top | 10/06/2023 | 10/17/2023 | Cement and Aggregates | |
| WMT | Pipe bottom | 10/02/2023 | 10/09/2023 | Retail Store | |
| WSC | Double Top, Eve and Adam | 09/12/2023 | 10/17/2023 | Industrial Services |
![]()
Since I post this the night before, check how the futures are trading before market open. Large moves can affect the opening direction.
$ $ $
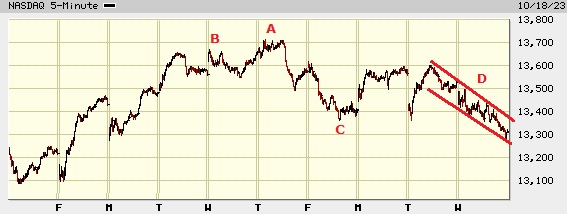
I show a picture of the Nasdaq composite on the 5-minute scale.
There are a number of patterns that I've highlighted on the chart. At A, we see a triple top. The drop after it confirms (becomes valid when price closes below the lowest of the two lows between the three peaks) is significant (all the way down to C).
B is a double top. This one is close to a dud because price didn't drop far.
I debated if C was a double bottom or not. Price made a good climb after it though.
Finally, at D, we see a channel. Notice that the index is at the bottom of the channel. That suggests a move to the top end. I don't know if it'll have enough juice to punch through the top trendline, though.
$ $ $
Here's a symbol list of 139 chart and candlestick patterns (13 "investment grade" candle patterns) found in today's securities using my version of Patternz: AXDX, ADTN, A, APD, ALRM, ALB, AME, APA, APOG, ARCB, AVY, BECN, BIO, BKH, BKNG, BAH, BRC, BMY, BBW, CPB, CX, CENX, CHD, CINF, CGNX, CL, COP, CR, CMI, DVN, ^DJT, DOV, DUK, BOOM, EXP, ELV, EOG, EFX, EG, EXPD, XOM, FLS, GNW, GPRO, HLIT, HQY, HL, HNI, HOV, HUBG, HUN, ITW, IIIN, ITGR, IBKR, JNJ, KMB, LZB, LAMR, LDOS, LLY, LOW, LPLA, MAN, MLM, MTRX, MGEE, MS, MOS, NOV, NEE, NWPX, NVDA, OXY, PKG, PATK, PFE, PCG, PPG, PG, RJF, RGS, ROK, RES, SMTC, SKYW, SXI, TGT, TDOC, TER, RIG, TRV, TZOO, UHAL, WMT, WMB, WWD, IYK, IYE, IEZ, FXL, IYZ, IXC, MXI, ILF, IGE, EWI, EWM, EWW, EWS, EWY, EWD, EWT, TUR, PPA, DBA, PJP, PHO, XLP, GLD, XLV, XLI, XLB, USO, VHT, VAW. Click this link for details (pattern type, start and end dates).
For a list of small patterns (those a few days wide) click this link.
$ $ $
The following table shows where Fibonacci retrace values of the day's high-low range are plus pivot points, calculated on the Nasdaq composite, sorted by value. When several are near each other (small differences), the area might act as support or resistance.
-- Thomas Bulkowski
![]()
| © 2023 ThePatternSite.com Metric | Value | Diff | Close (within 10% of the high-low range for the day)? |
| Monthly S2 | 12,417.27 | ||
| Monthly S1 | 12,865.78 | 448.52 | |
| Weekly S2 | 12,998.65 | 132.86 | |
| Daily S2 | 13,138.67 | 140.03 | |
| Weekly S1 | 13,156.47 | 17.80 | Yes! The Weekly S1 is close to the Daily S2. |
| Daily S1 | 13,226.49 | 70.01 | |
| Low | 13,275.30 | 48.81 | |
| Close | 13,314.30 | 39.00 | |
| 61.8% Down from Intraday High | 13,361.04 | 46.74 | |
| Daily Pivot | 13,363.11 | 2.08 | Yes! The Daily Pivot is close to the 61.8% Down from Intraday High. |
| 50% Down from Intraday High | 13,387.52 | 24.41 | |
| Monthly Pivot | 13,411.68 | 24.16 | |
| 38.2% Down from Intraday High | 13,414.00 | 2.33 | Yes! The 38.2% Down from Intraday High is close to the Monthly Pivot. |
| Weekly Pivot | 13,435.31 | 21.30 | Yes! The Weekly Pivot is close to the 38.2% Down from Intraday High. |
| Open | 13,439.68 | 4.37 | Yes! The Open is close to the Weekly Pivot. |
| Daily R1 | 13,450.93 | 11.25 | Yes! The Daily R1 is close to the Open. |
| High | 13,499.74 | 48.81 | |
| Daily R2 | 13,587.55 | 87.81 | |
| Weekly R1 | 13,593.13 | 5.58 | Yes! The Weekly R1 is close to the Daily R2. |
| Monthly R1 | 13,860.19 | 267.06 | |
| Weekly R2 | 13,871.97 | 11.77 | Yes! The Weekly R2 is close to the Monthly R1. |
| Monthly R2 | 14,406.09 | 534.12 |
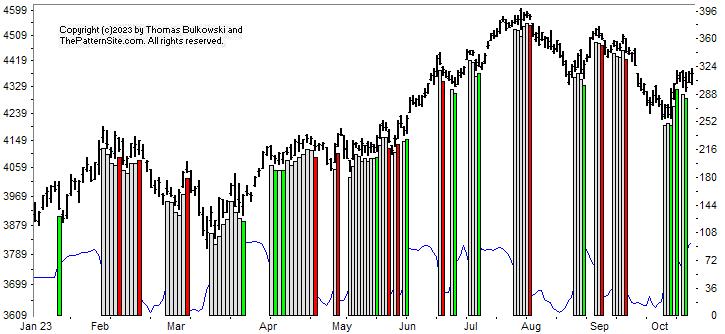
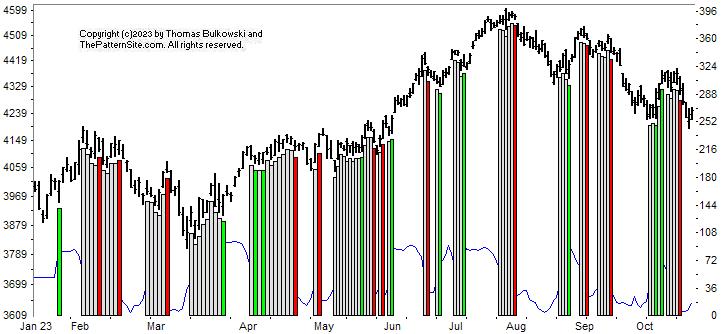
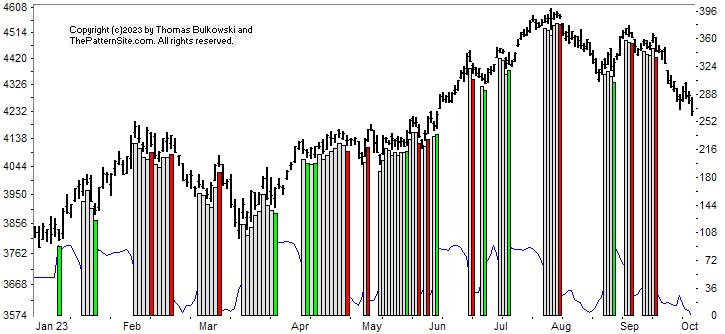
This is a picture of the chart pattern indicator on the daily scale. The indicator is the line chart below a chart of the S&P 500 composite.
We have a cluster of bullish signals as shown by the vertical green bars on the far right of the chart. Below the bars is the CPI line. You can see that it peaks out the right side, showing that it's near the top of the scale (100).
I've mentioned this before, but when the CPI gets near or at the top or bottom ends of the scale, expect a trend change in the index. That's what we might be seeing now.
If you're an Elliott waver, we might see another down leg to complete a 7-wave structure. Having written that, look at the rest of the chart where the CPI line peaks. Notice that the index often continues to rise (there are exceptions, though in late January and August). So maybe the observation of a trend change only applies to bottoms of the scale, and not the top.
Taking in the evidence, it suggests a continued move higher, I think.
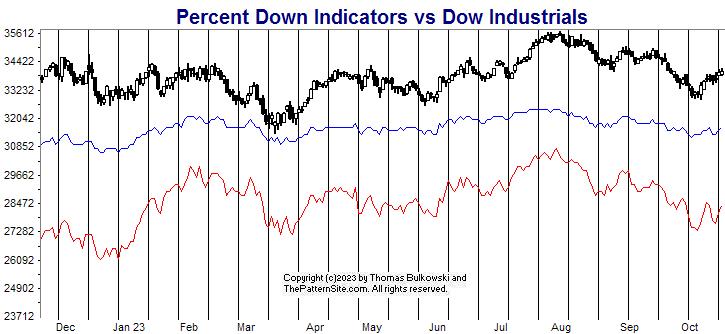
The red line is the percentage of stocks at least 20% below their 1-year high (plotted upside down). The blue line is the average percentage drop of stocks below their 1-year high (plotted upside down).
On Tuesday, 43% of stocks in my database are in bear market territory (down at least 20% from their 1-year high).A week ago, it was 41%.The fewest was 26% on 07/31/2023.And the most was 73% on 10/20/2022.
The 520 stocks in my database are down an average of 20% from their yearly high.A week ago, the average was 20%.The peak was 14% on 07/31/2023.And the bottom was 32% on 10/20/2022.
The red line, which is the more sensitive of the two, is more bearish this week than a week ago.
The red line looks to be resting on support setup by the move in March. So maybe the upward rise continuing is gathering evidence.
Earnings season is upon us, so that will bounce the indices around. I'm still hopeful that we'll see the markets rise.
$ $ $
Here's a symbol list of 111 chart and candlestick patterns (13 "investment grade" candle patterns) found in today's securities using my version of Patternz: ANF, ABM, ATSG, ALB, AR, APA, ATR, ATO, AVNT, BZH, BKH, CALM, CPB, CE, CX, CF, CNA, CNX, CL, COP, CCRN, CW, DVN, FANG, BOOM, EMN, EIX, EOG, EG, XOM, FICO, FLS, FTV, IT, GIS, GFF, GES, HLIT, HTLD, HL, HP, HSIC, IRM, JBLU, LH, LAMR, LLY, LPLA, LXU, MGY, MTDR, MOS, MUR, NBR, NFG, NOV, NFLX, NWL, NEE, NVDA, ORCL, OR, PATK, PCG, PXD, QTWO, RGS, RHI, ROG, RES, SEIC, STR, SKX, SSYS, TRGP, TGT, TER, TWLO, UIS, UPS, UNM, VMI, VEEV, WMT, WU, WSM, WOLF, ITA, IYE, IEZ, IGE, EWS, PPA, DBA, PXJ, UNG, USO, VAW. Click this link for details (pattern type, start and end dates).
For a list of small patterns (those a few days wide) click this link.
-- Thomas Bulkowski
![]()
$ $ $
I show another slider trading quiz featuring Rectangle bottoms.
$ $ $
Here's a symbol list of 92 chart and candlestick patterns (13 "investment grade" candle patterns) found in today's securities using my version of Patternz: ANF, ABM, ACIW, ALRM, AFG, AAPL, AMAT, ARCB, ACGL, AWI, AIZ, BECN, BA, CALM, CAL, COR, CIEN, CL, ED, CONN, COP, COST, CCRN, CW, DRQ, BOOM, ELV, EOG, EG, FFIV, FICO, FIVN, FRD, IT, HBI, THG, HELE, HUBG, ITW, INCY, NSP, IPI, IRM, KSS, LAMR, RAMP, MGY, MAN, MGEE, MUR, NXGN, NOVT, ORCL, OUT, PDCO, PFE, PLXS, RJF, RGA, RES, R, SAIC, SEIC, SIGI, SKX, SR, SRDX, TRGP, VMI, VECO, WU, WLK, WWW, IYC, FXI, IYZ, IGE, EWH, EWI, EWY, TUR, UNG. Click this link for details (pattern type, start and end dates).
For a list of small patterns (those a few days wide) click this link.
$ $ $
The following table shows where Fibonacci retrace values of the day's high-low range are plus pivot points, calculated on the Dow industrials, sorted by value. When several are near each other (small differences), the area might act as support or resistance.
-- Thomas Bulkowski
![]()
| © 2023 ThePatternSite.com Metric | Value | Diff | Close (within 10% of the high-low range for the day)? |
| Monthly S2 | 31,805.45 | ||
| Monthly S1 | 32,895.00 | 1,089.54 | |
| Weekly S2 | 33,027.95 | 132.96 | |
| Weekly S1 | 33,506.25 | 478.29 | |
| Daily S2 | 33,712.09 | 205.84 | |
| Weekly Pivot | 33,731.98 | 19.90 | Yes! The Weekly Pivot is close to the Daily S2. |
| Low | 33,832.42 | 100.44 | |
| Open | 33,832.42 | 0.00 | Yes! The Open is close to the Low. |
| Daily S1 | 33,848.31 | 15.89 | Yes! The Daily S1 is close to the Open. |
| 61.8% Down from Intraday High | 33,930.43 | 82.11 | |
| Monthly Pivot | 33,936.48 | 6.06 | Yes! The Monthly Pivot is close to the 61.8% Down from Intraday High. |
| 50% Down from Intraday High | 33,960.70 | 24.21 | Yes! The 50% Down from Intraday High is close to the Monthly Pivot. |
| Daily Pivot | 33,968.65 | 7.95 | Yes! The Daily Pivot is close to the 50% Down from Intraday High. |
| Close | 33,984.54 | 15.89 | Yes! The Close is close to the Daily Pivot. |
| 38.2% Down from Intraday High | 33,990.97 | 6.43 | Yes! The 38.2% Down from Intraday High is close to the Close. |
| High | 34,088.98 | 98.01 | |
| Daily R1 | 34,104.88 | 15.89 | Yes! The Daily R1 is close to the High. |
| Weekly R1 | 34,210.28 | 105.40 | |
| Daily R2 | 34,225.21 | 14.93 | Yes! The Daily R2 is close to the Weekly R1. |
| Weekly R2 | 34,436.01 | 210.80 | |
| Monthly R1 | 35,026.03 | 590.02 | |
| Monthly R2 | 36,067.51 | 1,041.48 |
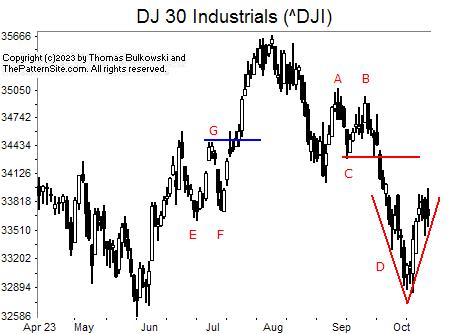
I show the Dow industrials on the daily scale.
At EF, we see a double bottom. It becomes a valid chart pattern when the index closes above the horizontal blue line, G. The index meets the measure rule target (the height of the pattern added to the top of it) almost exactly. However, the target is not a magic number. It's really a way to determine the probability of reaching the target.
Pattern AB is the reverse, a double top. It also confirms and more than exceeds its target.
Now we come to pattern D. This is a V-bottom, but I think it's growing an extension.
What does that mean?
I expect the Dow to retrace a portion of the advance, say, for a week or so, before moving higher.
![]()
The following is a brief review of how the markets performed over time. The numbers refer to the close-to-close move in the Dow industrials.
Many options expire this week, so traders will be looking to close out their positions, and that suggests increased volatility (large daily price swings).
![]()
The following is based on an SFO article in December 2004 by John Seekinger, titled, "Take a two-dimensional approach." He offers these tips.
| Index | S2 | S1 | Pivot | R1 | R2 |
| Dow Industrials (^DJI): Daily | 33,320 | 33,495 | 33,727 | 33,901 | 34,133 |
| Weekly | 32,923 | 33,297 | 33,627 | 34,001 | 34,331 |
| Monthly | 31,701 | 32,685 | 33,832 | 34,817 | 35,963 |
| S&P500 (^GSPC): Daily | 4,274 | 4,301 | 4,339 | 4,366 | 4,404 |
| Weekly | 4,230 | 4,279 | 4,332 | 4,381 | 4,435 |
| Monthly | 4,057 | 4,192 | 4,352 | 4,488 | 4,648 |
| Nasdaq (^IXIC): Daily | 13,205 | 13,306 | 13,463 | 13,564 | 13,721 |
| Weekly | 13,030 | 13,218 | 13,466 | 13,655 | 13,903 |
| Monthly | 12,448 | 12,928 | 13,443 | 13,922 | 14,437 |
Here are the formulas:
![]()
Earnings season will be starting in about 0 days.
Here's a symbol list of 212 chart and candlestick patterns (13 "investment grade" candle patterns) found in today's securities using my version of Patternz: AYI, ADBE, AEIS, APD, ALRM, ALKS, ALGT, ALL, AYX, AMZN, AEL, AXP, AIG, AME, AAPL, AMAT, ACGL, AWI, AZTA, BECN, BMRN, BRC, BR, BBW, CALM, CAL, CE, CLS, CDAY, CVX, CI, CNO, CNX, CTSH, CL, CMCO, CMTL, CAG, COP, CXW, CR, CRH, CROX, CCRN, CCK, DECK, DVN, FANG, ^DJT, DOV, DRQ, BOOM, EXP, EME, EMR, EOG, EG, FDS, FORM, FTV, FDP, FRD, GE, GNW, GFS, GMS, GGG, GFF, GES, THG, HIG, HUM, HUN, INCY, INFN, IIIN, ITGR, IBKR, TILE, JBLU, KALU, KELYA, KEYS, KFRC, LHX, LH, LRCX, LNC, LXU, MTSI, M, MGY, MAN, MRO, MTDR, MTRN, MGEE, MSFT, MLKN, MCO, MLI, MUR, ^IXIC, NFG, NOV, NFLX, NTGR, NTAP, NJR, NOC, NUS, NVDA, ON, ORCL, OUT, PANW, PTEN, PCTY, PRFT, PFE, PLXS, PPG, PG, PGR, PRU, PSTG, REGN, RGS, ROG, RGLD, RES, R, ^GSPC, SAIA, SMTC, SHOP, STR, SMAR, SWN, SR, SPLK, TRGP, TDY, TEVA, TXN, TKR, TJX, TSCO, TRV, UIS, UNH, UNM, VECO, VMC, WSO, WPM, WMB, WSM, WSC, WWD, WDAY, ITA, IYE, QTEC, FXL, FXI, QQQ, IGV, IXN, SOXX, SLV, IGE, IEO, EWC, ECH, EWH, EIS, QLD, PHO, SSO, ROBO, XLE, GLD, XLI, XLB, SPY, XLK, USO, SMH, VIS, VONG. Click this link for details (pattern type, start and end dates).
For a list of small patterns (those a few days wide) click this link.
The below industries were the best (rank 1) or worst performing of those I follow.
|
-- Thomas Bulkowski
![]()
$ $ $
Here's a symbol list of 232 chart and candlestick patterns (13 "investment grade" candle patterns) found in today's securities using my version of Patternz: ANF, AYI, ADBE, ADTN, APD, ALGT, ALL, AYX, AXP, AIG, AMWD, AME, ANIK, AR, AWI, AZTA, BAX, BECN, BIO, BIIB, BMRN, BRC, BR, BBW, CAL, CE, COR, CDAY, CVX, CIEN, CI, CINF, CNX, CTSH, CMCO, CMTL, CONN, CXW, COST, CR, CRH, CCRN, CTS, CMI, DECK, FANG, DSGR, ^DJT, DOV, BOOM, EXP, EMN, EME, EMR, WIRE, EOG, EG, EXPI, FDS, FICO, FISV, FIVN, FTV, FWRD, FCX, FDP, FRD, GE, GNW, GMS, GGG, GFF, GES, HBI, HE, HP, HUN, HURC, IDXX, ILMN, INFN, IIIN, ITGR, INTC, IBKR, TILE, INTU, ISRG, JKHY, JBLU, KALU, KELYA, KEYS, KLAC, LH, LRCX, LNC, LMT, L, LXU, MTSI, M, MRO, MTDR, MTRN, MDC, MGEE, MLKN, MCO, MLI, ^IXIC, NTAP, NJR, NOVT, NUS, OXY, ASGN, ON, ORCL, OMI, PCTY, PRFT, PLXS, PPG, PFG, PRU, PSTG, DGX, RL, RJF, RGA, ROG, ROL, R, ^GSPC, SAIA, SCHW, SIGI, SMTC, SCI, SHW, SMAR, SCCO, SWX, SR, SRDX, TPR, TDOC, TDY, TDC, TXN, TXT, TKR, TJX, RIG, TRV, TWLO, UIS, UNM, VRTX, VMC, WSO, WU, WMB, WSC, WWD, WDAY, ITA, IAI, IYK, QTEC, FXL, FXI, QQQ, IGV, MXI, ILF, IGE, IYF, EWA, EWK, EWC, ECH, EWQ, EIS, EWM, EZA, EWP, EWD, QLD, PPA, PEJ, PJP, PHO, SSO, ROBO, XLP, GLD, XHB, XLI, SPY, XAR, UNG, VIS, VONG. Click this link for details (pattern type, start and end dates).
For a list of small patterns (those a few days wide) click this link.
$ $ $
You can find setups based on a Fibonacci retrace by clicking on the link.
The following patterns were found manually, not using Patternz. Mr. Bulkowski has excluded any securities he owns from appearing in the list. However, he may add any of the securities listed to his portfolio at any time, just as you can.
In the table below, the red and green colors are based on the historical breakout direction for the associated chart pattern. If a high and tight flag appears, the start and end dates highlight the flagpole only and not the flag.
For details about the chart patterns, click here.
-- Thomas Bulkowski
![]()
| Symbol | Chart Pattern | Bullish Bearish | Start | End | Industry |
| AMD | Pipe bottom | 09/18/2023 | 09/25/2023 | Semiconductor | |
| ATSG | Broadening bottom | 09/22/2023 | 10/05/2023 | Air Transport | |
| ALGT | Double Top, Adam and Adam | 09/28/2023 | 10/06/2023 | Air Transport | |
| AR | Double Bottom, Eve and Eve | 09/25/2023 | 10/04/2023 | Natural Gas (Diversified) | |
| ATR | Double Bottom, Eve and Eve | 09/25/2023 | 10/04/2023 | Packaging and Container | |
| ANET | Pipe bottom | 09/18/2023 | 09/25/2023 | E-Commerce | |
| ADSK | Double Bottom, Adam and Adam | 09/27/2023 | 10/05/2023 | Computer Software and Svcs | |
| CBT | Double Bottom, Adam and Eve | 09/25/2023 | 10/04/2023 | Chemical (Diversified) | |
| CACI | Double Bottom, Eve and Eve | 09/26/2023 | 10/04/2023 | IT Services | |
| CE | Head-and-shoulders top | 09/01/2023 | 09/29/2023 | Chemical (Basic) | |
| CNC | Ugly double bottom | 09/01/2023 | 10/03/2023 | Medical Services | |
| CINF | Double Top, Eve and Adam | 07/28/2023 | 09/20/2023 | Insurance (Prop/Casualty) | |
| CLF | Diamond bottom | 09/08/2023 | 09/22/2023 | Metals and Mining (Div.) | |
| DSGR | Broadening bottom | 08/08/2023 | 09/12/2023 | Metal Fabricating | |
| EQT | Double Bottom, Eve and Eve | 09/25/2023 | 10/03/2023 | Natural Gas (Diversified) | |
| EVH | Broadening top, right-angled and ascending | 09/14/2023 | 10/04/2023 | Healthcare Information | |
| EXPD | Head-and-shoulders bottom | 09/21/2023 | 10/03/2023 | Air Transport | |
| FAST | Double Bottom, Eve and Adam | 09/21/2023 | 10/03/2023 | Retail Building Supply | |
| FTV | Double Bottom, Eve and Adam | 09/26/2023 | 10/04/2023 | Industrial Services | |
| GPS | Double Bottom, Eve and Adam | 09/20/2023 | 10/06/2023 | Apparel | |
| GD | Double Bottom, Adam and Adam | 09/12/2023 | 10/06/2023 | Aerospace/Defense | |
| GNW | Pipe bottom | 09/05/2023 | 09/11/2023 | Insurance (Life) | |
| GL | Double Bottom, Adam and Adam | 09/07/2023 | 10/03/2023 | Insurance (Life) | |
| NSP | Head-and-shoulders bottom | 09/12/2023 | 10/06/2023 | Human Resources | |
| MLM | Double Bottom, Eve and Eve | 09/25/2023 | 10/03/2023 | Cement and Aggregates | |
| MRCY | Pipe bottom | 09/05/2023 | 09/11/2023 | Computers and Peripherals | |
| META | Pipe bottom | 08/14/2023 | 08/21/2023 | E-Commerce | |
| NTAP | Double Bottom, Adam and Eve | 09/27/2023 | 10/04/2023 | Computers and Peripherals | |
| NOC | Triple bottom | 09/11/2023 | 10/06/2023 | Aerospace/Defense | |
| NVDA | Pipe bottom | 09/18/2023 | 09/25/2023 | Semiconductor | |
| ASGN | Double Bottom, Eve and Eve | 09/12/2023 | 10/06/2023 | Human Resources | |
| ON | Broadening top, right-angled and descending | 09/18/2023 | 10/12/2023 | Semiconductor | |
| PLXS | Scallop, descending | 09/01/2023 | 09/28/2023 | Electronics | |
| RRC | Double Bottom, Eve and Eve | 09/22/2023 | 10/04/2023 | Petroleum (Producing) | |
| RHI | Double Bottom, Adam and Adam | 09/26/2023 | 10/02/2023 | Human Resources | |
| SAIC | Double Bottom, Eve and Eve | 09/26/2023 | 10/06/2023 | IT Services | |
| SIGI | Double Top, Eve and Eve | 09/26/2023 | 10/05/2023 | Insurance (Prop/Casualty) | |
| SWN | Head-and-shoulders top | 08/22/2023 | 09/14/2023 | Natural Gas (Diversified) | |
| SSYS | Triangle, descending | 09/12/2023 | 09/27/2023 | Electronics | |
| TPX | Triple top | 07/27/2023 | 09/01/2023 | Furn/Home Furnishings | |
| UNM | Broadening top | 08/11/2023 | 10/12/2023 | Insurance (Diversified) | |
| VMC | Double Bottom, Eve and Adam | 09/25/2023 | 10/03/2023 | Cement and Aggregates | |
| WMB | Broadening wedge, descending | 08/15/2023 | 10/03/2023 | Natural Gas (Distributor) | |
| WWD | Double Bottom, Eve and Eve | 09/26/2023 | 10/04/2023 | Precision Instrument |
![]()
Since I post this the night before, check how the futures are trading before market open. Large moves can affect the opening direction.
$ $ $
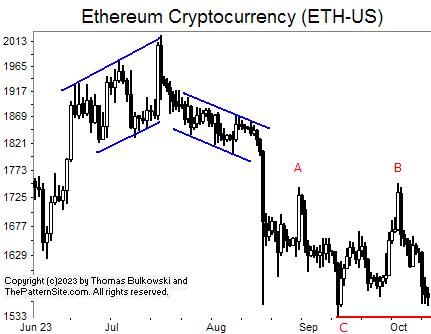
I show a picture of Ethereum on the daily scale.
The parallel blue lines are channels.
A and B are twin peaks near the same price. It's not a double top yet. If the crypto currency closes below the horizontal red line at C, then it will confirm the twin peak pattern as a valid double top. Should that happen, I'd expect the currency to drop, perhaps dramatically.
Look out below. The sky is about to fall.
$ $ $
Here's a symbol list of 106 chart and candlestick patterns (13 "investment grade" candle patterns) found in today's securities using my version of Patternz: DDD, ANF, ATVI, ALK, ALKS, AEO, AFG, AMWD, AME, AMGN, AZTA, BALL, BAX, BIO, BBW, CALM, COR, CDAY, CHKP, CNA, CNX, CONN, COTY, CCRN, DVN, FANG, EOG, XOM, FIS, FISV, FIVN, FORM, FCX, GNW, GS, GPRO, HE, HOV, IDXX, ILMN, ITGR, INTC, ISRG, NVTA, JKHY, KMT, KMB, LAMR, L, MCHX, MGEE, NTGR, NTAP, NEU, NOVT, ORCL, OMI, PTEN, PRFT, PG, PGR, RL, ROL, ROST, SMTC, SCI, SHW, SMAR, SCCO, SWX, SR, SPLK, SRDX, TFX, TXT, TMO, TG, TWLO, VRTX, WAT, WDAY, IAI, IYK, FXI, IEO, EWO, EWZ, EEM, EIS, EWM, EZA, EWL, EWT, THD, TUR, XLP, GLD, UNG, USO. Click this link for details (pattern type, start and end dates).
For a list of small patterns (those a few days wide) click this link.
$ $ $
The following table shows where Fibonacci retrace values of the day's high-low range are plus pivot points, calculated on the Nasdaq composite, sorted by value. When several are near each other (small differences), the area might act as support or resistance.
-- Thomas Bulkowski
![]()
| © 2023 ThePatternSite.com Metric | Value | Diff | Close (within 10% of the high-low range for the day)? |
| Monthly S2 | 12,463.54 | ||
| Weekly S2 | 12,916.51 | 452.97 | |
| Monthly S1 | 13,061.61 | 145.10 | |
| Weekly S1 | 13,288.10 | 226.49 | |
| Weekly Pivot | 13,380.18 | 92.09 | |
| Daily S2 | 13,504.87 | 124.69 | |
| Low | 13,549.29 | 44.42 | |
| Monthly Pivot | 13,561.23 | 11.94 | Yes! The Monthly Pivot is close to the Low. |
| Daily S1 | 13,582.28 | 21.05 | |
| 61.8% Down from Intraday High | 13,595.83 | 13.55 | |
| 50% Down from Intraday High | 13,610.20 | 14.38 | |
| Open | 13,619.21 | 9.01 | Yes! The Open is close to the 50% Down from Intraday High. |
| 38.2% Down from Intraday High | 13,624.58 | 5.37 | Yes! The 38.2% Down from Intraday High is close to the Open. |
| Daily Pivot | 13,626.69 | 2.12 | Yes! The Daily Pivot is close to the 38.2% Down from Intraday High. |
| Close | 13,659.68 | 32.99 | |
| High | 13,671.11 | 11.43 | Yes! The High is close to the Close. |
| Daily R1 | 13,704.10 | 32.99 | |
| Daily R2 | 13,748.51 | 44.42 | |
| Weekly R1 | 13,751.77 | 3.25 | Yes! The Weekly R1 is close to the Daily R2. |
| Weekly R2 | 13,843.85 | 92.09 | |
| Monthly R1 | 14,159.30 | 315.45 | |
| Monthly R2 | 14,658.92 | 499.62 |
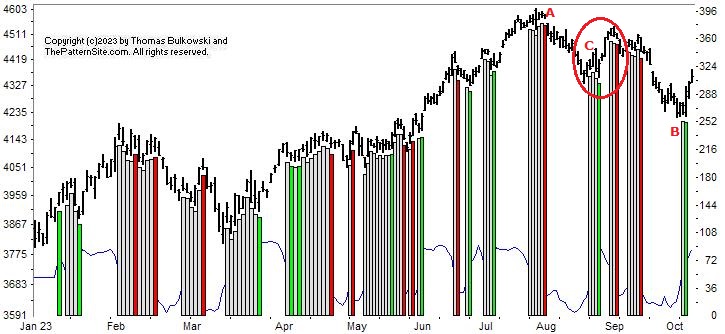
This is a picture of the chart pattern indicator on the daily scale. The indicator is the line chart below a chart of the S&P 500 composite.
The CPI bounced off 0 and made a fast move higher, just as I predicted two weeks ago.
However, this could be a recovery to the corrective phase of a measured move down chart pattern. What's that mean? The pattern begins at A and ends at B. It's a stair-step down pattern.
What's key to this is after it ends, price often retraces to C, circled. It's a reliable move.
In this case, it already reached the bottom of C. What happens next? According to my book, Encyclopedia of Chart Patterns, 3rd edition (#ad). A third of the time, price will continue above A, 15% of the time it'll reach above C but below A, and 28% of the time, it'll remain at C.
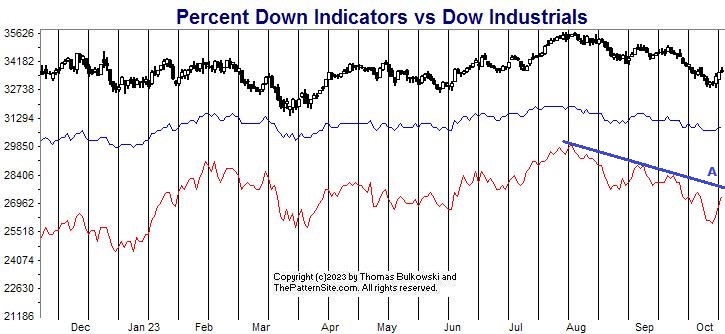
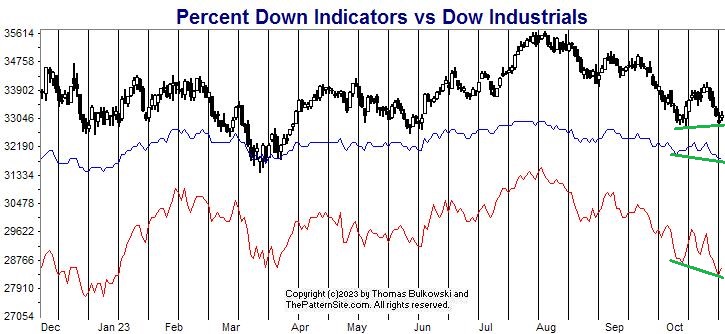
The red line is the percentage of stocks at least 20% below their 1-year high (plotted upside down). The blue line is the average percentage drop of stocks below their 1-year high (plotted upside down).
On Tuesday, 41% of stocks in my database are in bear market territory (down at least 20% from their 1-year high).A week ago, it was 48%.The fewest was 26% on 07/31/2023.And the most was 76% on 10/14/2022.
The 522 stocks in my database are down an average of 20% from their yearly high.A week ago, the average was 22%.The peak was 14% on 07/31/2023.And the bottom was 33% on 10/14/2022.
Both lines made a good recovery compared to a week ago. If you draw a trendline like I show at A (blue), the red line is coming up against overhead resistance setup by that trendline. The catch is, I don't know if the red line cares about any of that.
My guess is we'll see the up trend continue, but maybe at a slower pace.
$ $ $
Here's a symbol list of 107 chart and candlestick patterns (13 "investment grade" candle patterns) found in today's securities using my version of Patternz: ANF, ADBE, ALL, DOX, AEL, AFG, AON, APA, ACGL, AXS, BZH, BAH, CAL, CLS, CX, CNC, CDAY, CHS, CSGP, CRH, CCRN, CSGS, CW, DDS, DOV, EIX, EG, FAST, GPS, GNW, THG, HTLD, HSII, HSY, HNI, INTC, INTU, MTSI, MANH, MCHX, MKTX, MRCY, META, MGEE, NEWR, NKE, NI, ORI, OMCL, ASGN, OTEX, ORCL, OUT, PATK, PRFT, PLXS, PGR, RL, RGA, R, SIGI, SMTC, SKYW, SCCO, SWN, SR, TPR, TKR, TSCO, TRV, UIS, MDRX, WRB, WSO, WERN, IYM, IDU, IEV, IXN, EWA, EWO, EWZ, ECH, EEM, EWQ, EWH, EWJ, EPP, EWS, EWD, EWL, TUR, PBE, PHO, ROBO, XLF, XAR, XLK, UNG, USO, VIS, VONG. Click this link for details (pattern type, start and end dates).
For a list of small patterns (those a few days wide) click this link.
-- Thomas Bulkowski
![]()
$ $ $
I show another slider trading quiz featuring Head-and-shoulders tops.
$ $ $
Here's a symbol list of 128 chart and candlestick patterns (13 "investment grade" candle patterns) found in today's securities using my version of Patternz: MMM, ANF, AXDX, ADBE, AMD, ALRM, ALK, AMZN, DOX, AME, AR, ATR, ARCB, ANET, ADSK, BAX, BBY, BIG, BKH, BOOT, BAH, BFH, CACI, CPB, COR, CVX, CTAS, CSCO, CNX, CAG, CMI, CW, FANG, DSGR, ^DJU, ^DJT, DUK, EME, EMR, EPAM, FAST, FDX, FIS, FIVN, GPS, GD, GFF, HL, HD, DHI, INCY, IPG, INTU, IRM, KELYA, KEYS, KFRC, LHX, MHO, MTSI, MANH, MCHX, MTDR, MTRN, MRCY, MOS, MLI, ^IXIC, NFLX, NEWR, NWL, NKE, NI, NOC, NVDA, ORI, OMC, ASGN, OUT, PXD, PHM, RRC, RJF, RCKY, ROL, RES, R, ^GSPC, SCHW, SAIC, SMAR, LUV, SR, TXT, TJX, TWLO, UIS, VMI, VRTX, WMB, WDAY, ITA, IYC, ITB, IDU, FDN, QTEC, FXL, QQQ, IYZ, IGV, ILF, EWZ, EIS, QLD, PPA, PBE, XLY, XHB, XLI, XLU, UNG, VIS. Click this link for details (pattern type, start and end dates).
For a list of small patterns (those a few days wide) click this link.
$ $ $
The following table shows where Fibonacci retrace values of the day's high-low range are plus pivot points, calculated on the Dow industrials, sorted by value. When several are near each other (small differences), the area might act as support or resistance.
-- Thomas Bulkowski
![]()
| © 2023 ThePatternSite.com Metric | Value | Diff | Close (within 10% of the high-low range for the day)? |
| Monthly S2 | 31,678.82 | ||
| Weekly S2 | 32,625.68 | 946.85 | |
| Monthly S1 | 32,641.74 | 16.06 | Yes! The Monthly S1 is close to the Weekly S2. |
| Weekly S1 | 33,115.16 | 473.43 | |
| Daily S2 | 33,118.60 | 3.43 | Yes! The Daily S2 is close to the Weekly S1. |
| Low | 33,253.69 | 135.09 | |
| Open | 33,259.87 | 6.18 | Yes! The Open is close to the Low. |
| Weekly Pivot | 33,336.43 | 76.55 | |
| Daily S1 | 33,361.63 | 25.20 | Yes! The Daily S1 is close to the Weekly Pivot. |
| 61.8% Down from Intraday High | 33,398.13 | 36.51 | Yes! The 61.8% Down from Intraday High is close to the Daily S1. |
| 50% Down from Intraday High | 33,442.75 | 44.62 | |
| 38.2% Down from Intraday High | 33,487.37 | 44.62 | |
| Daily Pivot | 33,496.71 | 9.35 | Yes! The Daily Pivot is close to the 38.2% Down from Intraday High. |
| Close | 33,604.65 | 107.93 | |
| High | 33,631.81 | 27.16 | Yes! The High is close to the Close. |
| Daily R1 | 33,739.74 | 107.93 | |
| Monthly Pivot | 33,809.85 | 70.11 | |
| Weekly R1 | 33,825.91 | 16.06 | Yes! The Weekly R1 is close to the Monthly Pivot. |
| Daily R2 | 33,874.84 | 48.92 | |
| Weekly R2 | 34,047.18 | 172.34 | |
| Monthly R1 | 34,772.77 | 725.59 | |
| Monthly R2 | 35,940.88 | 1,168.12 |
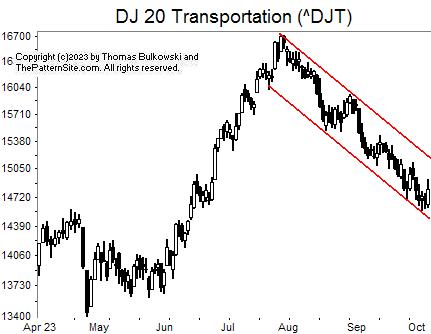
I show the Dow transports on the daily scale.
There's not a lot going on in this chart. Price climbed at a steady trend and has dropped in a reflection of the uptrend (similar angle at the apex). The pattern resembles a V-top.
The lower end of the red channel shows the index is itching to rise. It could breakout upward from the channel.
Notice that in the last month, the index has stayed in the lower half of the channel. That's typical and it's something I learned from playing with Andrew's Pitchfork.
Click on the link to learn more about that.
![]()
The following is a brief review of how the markets performed over time. The numbers refer to the close-to-close move in the Dow industrials.
No options expire this week.
![]()
The following is based on an SFO article in December 2004 by John Seekinger, titled, "Take a two-dimensional approach." He offers these tips.
| Index | S2 | S1 | Pivot | R1 | R2 |
| Dow Industrials (^DJI): Daily | 32,560 | 32,984 | 33,271 | 33,695 | 33,981 |
| Weekly | 32,560 | 32,984 | 33,271 | 33,695 | 33,981 |
| Monthly | 31,613 | 32,510 | 33,744 | 34,641 | 35,875 |
| S&P500 (^GSPC): Daily | 4,180 | 4,244 | 4,284 | 4,349 | 4,389 |
| Weekly | 4,175 | 4,242 | 4,283 | 4,350 | 4,391 |
| Monthly | 4,049 | 4,179 | 4,346 | 4,476 | 4,644 |
| Nasdaq (^IXIC): Daily | 12,961 | 13,196 | 13,334 | 13,569 | 13,707 |
| Weekly | 12,840 | 13,136 | 13,304 | 13,600 | 13,768 |
| Monthly | 12,387 | 12,909 | 13,485 | 14,007 | 14,583 |
Here are the formulas:
![]()
Earnings season will be starting in about 7 days.
Here's a symbol list of 140 chart and candlestick patterns (13 "investment grade" candle patterns) found in today's securities using my version of Patternz: AXDX, ATVI, AYI, AMD, AEE, AEL, AMGN, AR, APA, AMAT, ARCB, ANET, ADP, AVY, AVA, BAX, BIO, BMRN, BKH, BKNG, BRC, BG, CBT, CPB, CNC, CHD, CLNE, CNX, CR, CRH, CCK, DHR, DVN, DSGR, DOV, DRQ, BOOM, EIX, WIRE, EG, XOM, FDX, FE, FLS, FORM, GPS, GOOGL, GGG, THG, HE, HL, HSII, HSIC, IDXX, ITGR, INTC, IBKR, INTU, IRM, K, KFRC, KLAC, LEN, LXU, M, MANH, MKTX, MTRX, MDT, MU, MLKN, MUR, NFG, NEWR, NWL, NKE, NTNX, NVDA, ON, OR, PAYX, PFE, PLXS, PPG, PRU, PSTG, RRC, RNG, ROK, RCKY, RGLD, SLB, SMTC, SWN, SPSC, SSYS, SUM, SRDX, SNPS, TER, TTD, RIG, TG, UIS, VLO, VMI, VEEV, MDRX, VRTX, WMT, WMB, XEL, IYE, FDN, FXI, IGV, MXI, EWC, EWH, EIS, EWY, DBA, PHO, ROBO, XLP, XLE, UNG. Click this link for details (pattern type, start and end dates).
For a list of small patterns (those a few days wide) click this link.
The below industries were the best (rank 1) or worst performing of those I follow.
|
-- Thomas Bulkowski
![]()
$ $ $
Here's a symbol list of 115 chart and candlestick patterns (13 "investment grade" candle patterns) found in today's securities using my version of Patternz: ABM, AXDX, AMD, AFL, A, AKAM, ALK, ALB, ALL, AEL, APA, APOG, ARCB, ANET, AGO, BERY, CPB, COR, CNC, CIEN, CTAS, CLX, CNO, CNX, CTSH, CMCO, CONN, CXW, CROX, CCK, CSGS, DVN, DSGR, DRQ, BOOM, XOM, FORM, FTV, FCX, GPS, GFS, HIG, NSP, ITGR, TILE, JNJ, KEYS, KFRC, KLIC, LAMR, L, LXU, MTSI, MCHX, MDT, MUR, MYGN, NFLX, NTGR, NEE, NKE, NOC, NVDA, OXY, ON, PATK, PRU, RNG, R, SLB, SLGN, SMAR, SPLK, SRDX, TRGP, TDY, TXN, TJX, TDG, RIG, TRV, TG, UHAL, UIS, UNH, MDRX, VRTX, IYE, MXI, ILF, IEO, EWZ, EIS, EWW, THD, PBE, PXJ, PJP, XLE, XRT, UNG, USO. Click this link for details (pattern type, start and end dates).
For a list of small patterns (those a few days wide) click this link.
$ $ $
You can find setups based on a Fibonacci retrace by clicking on the link.
The following patterns were found manually, not using Patternz. Mr. Bulkowski has excluded any securities he owns from appearing in the list. However, he may add any of the securities listed to his portfolio at any time, just as you can.
In the table below, the red and green colors are based on the historical breakout direction for the associated chart pattern. If a high and tight flag appears, the start and end dates highlight the flagpole only and not the flag.
For details about the chart patterns, click here.
-- Thomas Bulkowski
![]()
| Symbol | Chart Pattern | Bullish Bearish | Start | End | Industry |
| ABM | Double Bottom, Adam and Adam | 09/26/2023 | 10/04/2023 | Industrial Services | |
| ACIW | Triple top | 07/18/2023 | 08/31/2023 | IT Services | |
| ADTN | Broadening bottom | 09/18/2023 | 10/02/2023 | Telecom. Equipment | |
| BERY | Three Falling Peaks | 07/25/2023 | 09/01/2023 | Packaging and Container | |
| BSX | Triple top | 08/30/2023 | 09/20/2023 | Medical Services | |
| CALM | Double Top, Adam and Eve | 09/08/2023 | 09/26/2023 | Food Processing | |
| CHD | Head-and-shoulders top | 05/03/2023 | 09/01/2023 | Household Products | |
| CNX | Broadening top | 08/21/2023 | 10/04/2023 | Natural Gas (Diversified) | |
| COP | Head-and-shoulders top | 09/05/2023 | 09/28/2023 | Petroleum (Integrated) | |
| CTS | Diamond bottom | 09/08/2023 | 10/05/2023 | Electronics | |
| CW | Head-and-shoulders top | 08/09/2023 | 09/20/2023 | Machinery | |
| FANG | Double Top, Eve and Adam | 09/14/2023 | 09/28/2023 | Petroleum (Producing) | |
| DSGR | Double Bottom, Adam and Eve | 09/05/2023 | 09/21/2023 | Metal Fabricating | |
| FLS | Triple top | 09/12/2023 | 09/29/2023 | Machinery | |
| FORM | Pipe bottom | 09/11/2023 | 09/18/2023 | Semiconductor | |
| IT | Broadening top | 08/31/2023 | 09/28/2023 | IT Services | |
| GD | Double Top, Eve and Eve | 09/20/2023 | 10/03/2023 | Aerospace/Defense | |
| HBI | Head-and-shoulders top | 07/26/2023 | 09/01/2023 | Apparel | |
| HP | Double Top, Eve and Eve | 07/31/2023 | 09/14/2023 | Petroleum (Producing) | |
| HNI | Rising wedge | 09/01/2023 | 10/05/2023 | Furn/Home Furnishings | |
| HON | Broadening bottom | 08/18/2023 | 10/05/2023 | Aerospace/Defense | |
| INFN | Head-and-shoulders top | 08/15/2023 | 09/14/2023 | Telecom. Equipment | |
| LXU | Triangle, descending | 07/06/2023 | 10/05/2023 | Building Materials | |
| MGY | Head-and-shoulders top | 08/09/2023 | 09/27/2023 | Petroleum (Producing) | |
| MRO | Triple top | 09/05/2023 | 09/14/2023 | Petroleum (Integrated) | |
| MTDR | Head-and-shoulders top | 08/21/2023 | 09/27/2023 | Petroleum (Producing) | |
| MS | Head-and-shoulders top | 06/16/2023 | 09/19/2023 | Securities Brokerage | |
| MUR | Broadening wedge, descending | 09/05/2023 | 10/04/2023 | Petroleum (Integrated) | |
| NBR | Head-and-shoulders top | 09/05/2023 | 09/28/2023 | Oilfield Svcs/Equipment | |
| NFG | Double Top, Adam and Eve | 09/01/2023 | 09/19/2023 | Natural Gas (Diversified) | |
| JWN | Double Bottom, Eve and Eve | 09/13/2023 | 09/26/2023 | Retail Store | |
| OXY | Head-and-shoulders top | 09/05/2023 | 09/28/2023 | Petroleum (Producing) | |
| PDCO | Pipe bottom | 09/11/2023 | 09/18/2023 | Medical Supplies | |
| PTEN | Double Top, Eve and Eve | 07/27/2023 | 09/14/2023 | Oilfield Svcs/Equipment | |
| PNW | Double Top, Eve and Eve | 08/24/2023 | 09/20/2023 | Electric Utility (West) | |
| PEG | Double Top, Eve and Eve | 08/30/2023 | 09/15/2023 | Electric Utility (East) | |
| RJF | Double Top, Eve and Eve | 07/26/2023 | 09/14/2023 | Securities Brokerage | |
| SLB | Double Top, Eve and Adam | 09/12/2023 | 09/28/2023 | Oilfield Svcs/Equipment | |
| TRGP | Double Top, Adam and Adam | 09/01/2023 | 09/28/2023 | Natural Gas (Diversified) | |
| TDY | Double Top, Eve and Adam | 09/01/2023 | 09/20/2023 | Aerospace/Defense | |
| TDC | Rectangle bottom | 08/21/2023 | 10/05/2023 | Computer Software and Svcs | |
| RIG | Flag, high and tight | 12/07/2022 | 02/16/2023 | Oilfield Svcs/Equipment | |
| SLCA | Double Top, Eve and Adam | 09/14/2023 | 09/28/2023 | Metals and Mining (Div.) | |
| V | Double Bottom, Adam and Eve | 09/27/2023 | 10/03/2023 | Financial Services | |
| WPM | Double Top, Adam and Adam | 08/30/2023 | 09/20/2023 | Metals and Mining (Div.) | |
| XLK | Head-and-shoulders top | 06/16/2023 | 09/05/2023 | IT Services |
![]()
Since I post this the night before, check how the futures are trading before market open. Large moves can affect the opening direction.
$ $ $
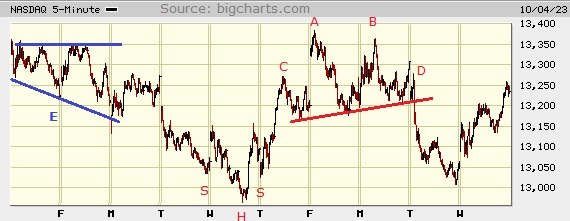
I show a picture of the Nasdaq composite on the 5-minute scale.
This is a busy chart, so lets start from the left. A right-angled and descending broadening chart pattern appears at E. Price breaks out downward and meets the measure rule target (breakout price minus pattern height). I show that in blue.
There's a head-and-shoulders bottom at SHS near the middle of the chart. This chart pattern resulted in a good gain, too, meeting or exceeding the measure rule target for the pattern.
At AB is a double top. If you expand the view to include C and D, we see a complex head-and-shoulders top. This one has two heads (AB) and two shoulders (CD). It also met the measure rule target...barely.
Elliott wavers, of which I am NOT one, may say to expect an ABC correction (down, up, down move). That's my interpretation of the move higher from the Tuesday's low (5 segment motive wave). Extensions can throw off the wave count, so what do I know?
$ $ $
Here's a symbol list of 136 chart and candlestick patterns (13 "investment grade" candle patterns) found in today's securities using my version of Patternz: AXDX, ADTN, AMD, AES, APD, ALB, ALKS, ALL, AYX, AME, AMN, AR, APA, ANET, BZH, BBY, BOOT, BRC, CACI, CALM, COR, CRL, CVX, CIEN, CNA, CTSH, CONN, COP, CCRN, DVN, DSGR, DOV, DRQ, BOOM, EMR, EOG, XOM, FDS, FICO, FNV, FCX, GPS, THG, HE, HAYN, HD, ITGR, INTC, IRM, JAZZ, KELYA, KEYS, KFRC, KSS, LHX, LH, LMT, L, MCHX, MDT, META, MUR, NTGR, NWL, NEE, NKE, NVDA, OXY, OLN, ON, PANW, PFE, PXD, RTX, RNG, ROL, ROP, R, SAND, SLB, SIGI, SMTC, TEVA, RIG, TG, SLCA, UGI, UIS, VLO, MDRX, WRB, IYC, IYE, IEZ, IAT, IGV, IXC, IXN, ILF, IEO, EWA, EWC, EEM, EIS, EWJ, EPP, EWS, EWP, PXJ, XLE, GLD, XLK, USO, MGK, VONG. Click this link for details (pattern type, start and end dates).
For a list of small patterns (those a few days wide) click this link.
$ $ $
The following table shows where Fibonacci retrace values of the day's high-low range are plus pivot points, calculated on the Nasdaq composite, sorted by value. When several are near each other (small differences), the area might act as support or resistance.
-- Thomas Bulkowski
![]()
| © 2023 ThePatternSite.com Metric | Value | Diff | Close (within 10% of the high-low range for the day)? |
| Monthly S2 | 12,263.14 | ||
| Monthly S1 | 12,749.57 | 486.44 | |
| Weekly S2 | 12,774.23 | 24.66 | |
| Daily S2 | 13,002.84 | 228.61 | |
| Weekly S1 | 13,005.12 | 2.28 | Yes! The Weekly S1 is close to the Daily S2. |
| Low | 13,072.51 | 67.39 | |
| Open | 13,092.92 | 20.41 | |
| Daily S1 | 13,119.43 | 26.51 | |
| 61.8% Down from Intraday High | 13,143.66 | 24.23 | |
| 50% Down from Intraday High | 13,165.63 | 21.98 | |
| 38.2% Down from Intraday High | 13,187.61 | 21.98 | |
| Daily Pivot | 13,189.09 | 1.48 | Yes! The Daily Pivot is close to the 38.2% Down from Intraday High. |
| Weekly Pivot | 13,194.05 | 4.96 | Yes! The Weekly Pivot is close to the Daily Pivot. |
| Close | 13,236.01 | 41.96 | |
| High | 13,258.76 | 22.75 | |
| Daily R1 | 13,305.68 | 46.92 | |
| Daily R2 | 13,375.34 | 69.67 | |
| Weekly R1 | 13,424.94 | 49.60 | |
| Monthly Pivot | 13,449.60 | 24.66 | |
| Weekly R2 | 13,613.87 | 164.27 | |
| Monthly R1 | 13,936.03 | 322.16 | |
| Monthly R2 | 14,636.06 | 700.02 |
This is a picture of the chart pattern indicator on the daily scale. The indicator is the line chart below a chart of the S&P 500 composite.
We're back to two bearish bars separated by neutral ones.
Notice at the bottom of the chart, the thin blue CPI line. It's either at 0 or close to it. That's bearish but it could also mean that the only direction to go is up.
In the past, the time spent at 0 is brief. That suggests this drop is near an end. Of course, that's just a guess.
The red line is the percentage of stocks at least 20% below their 1-year high (plotted upside down). The blue line is the average percentage drop of stocks below their 1-year high (plotted upside down).
On Tuesday, 48% of stocks in my database are in bear market territory (down at least 20% from their 1-year high).A week ago, it was 43%.The fewest was 26% on 07/31/2023.And the most was 76% on 10/14/2022.
The 522 stocks in my database are down an average of 22% from their yearly high.A week ago, the average was 21%.The peak was 14% on 07/31/2023.And the bottom was 33% on 10/14/2022.
Both lines this week are worse off compared to a week ago. No surprise there. The lines are convergent, too, so they are saying, "Look out below!"
Based on underlying support, it looks as if the Dow could drop to 32,600 before rebounding. By that, I mean the 32,600 level is the next level of good support. It might not be enough to stop the tumble, though. I still believe the drop is about over. I'm bullish and have been adding to existing positions.
$ $ $
Here's a symbol list of 160 chart and candlestick patterns (13 "investment grade" candle patterns) found in today's securities using my version of Patternz: DDD, MMM, AXDX, ACIW, AMD, AES, ALB, ALKS, ALL, AMED, AMWD, APH, APA, ANET, AIZ, AGO, BAX, BECN, BZH, BERY, BBY, BSX, BRC, BBW, BLDR, CPB, COR, CDAY, CHKP, CIEN, CINF, CLNE, CNA, CNO, CTSH, CMTL, CONN, COTY, CCRN, DSGR, DOV, BOOM, EMR, FARO, FWRD, FCX, GME, GPS, GE, GPN, GS, GES, HLIT, HIG, HE, HD, ITGR, IRM, JAZZ, JBLU, KALU, KBH, KELYA, KFRC, KSS, LHX, LEN, MCHX, MAS, MDC, MDT, MRCY, MS, NEWR, NWL, NKE, NVDA, OLN, ON, OMI, PANW, PCTY, PEN, PETS, PNW, PFG, PHM, PSTG, RL, RGA, RNG, RHI, RCKY, SAND, SCHW, SMG, SEIC, SIGI, SUM, TEVA, TJX, TDG, RIG, TG, UGI, UIS, UNM, VLO, WEX, WPM, WWD, IYM, IAI, IYE, FXI, IYH, IAT, IEV, IXC, MXI, ILF, IEO, EWA, EWO, EWK, EWC, EEM, EWQ, EWG, EWH, EWI, EWJ, EPP, EWS, EZA, EWD, EWL, THD, TUR, EWU, PBE, PJP, XLE, XHB, VHT. Click this link for details (pattern type, start and end dates).
For a list of small patterns (those a few days wide) click this link.
-- Thomas Bulkowski
![]()
$ $ $
I show another slider trading quiz featuring Three falling peaks.
$ $ $
Here's a symbol list of 155 chart and candlestick patterns (13 "investment grade" candle patterns) found in today's securities using my version of Patternz: DDD, MMM, ANF, AXDX, ADTN, AFL, ALB, ALKS, AFG, APA, ACGL, ADP, AVY, AVA, BECN, BBY, BIIB, BFH, CACI, CPB, CNC, CNP, CIEN, CINF, CTAS, CNA, CNO, CMTL, CR, CRH, CSGS, CW, DHR, DVN, DOV, EXP, EME, EMR, EOG, FIS, FE, FORM, GE, GFS, GMS, GS, GFF, GES, HLIT, HE, HELE, DHI, HWM, IDA, ITGR, IBKR, TILE, IPG, NVTA, IRM, JAZZ, JNJ, KMT, KSS, LH, LANC, RAMP, MRO, MRTN, MAS, MDC, MDT, MRCY, MLKN, MS, MOS, MLI, MUR, MYGN, NBR, NEWR, NEE, OXY, ORI, OLN, ASGN, OR, OMI, PDCO, PEN, PNW, PXD, POR, PINC, DGX, RCKY, SAND, SLB, SMG, SEIC, SIGI, SKYW, SWX, SPLK, SXI, TDG, RIG, UIS, UNH, VMI, VMC, WPM, WMB, WSC, IYE, IYH, IAT, IXC, IXN, SLV, IGE, IEO, EWZ, EWJ, EWM, EWL, THD, TUR, EWU, PPA, PBE, PXJ, PJP, XLE, GLD, XLU, VHT, MGK. Click this link for details (pattern type, start and end dates).
For a list of small patterns (those a few days wide) click this link.
$ $ $
The following table shows where Fibonacci retrace values of the day's high-low range are plus pivot points, calculated on the Dow industrials, sorted by value. When several are near each other (small differences), the area might act as support or resistance.
-- Thomas Bulkowski
![]()
| © 2023 ThePatternSite.com Metric | Value | Diff | Close (within 10% of the high-low range for the day)? |
| Monthly S2 | 32,172.71 | ||
| Monthly S1 | 32,803.03 | 630.32 | |
| Weekly S2 | 32,874.50 | 71.46 | |
| Daily S2 | 33,095.92 | 221.43 | |
| Weekly S1 | 33,153.92 | 58.00 | |
| Low | 33,219.56 | 65.64 | |
| Daily S1 | 33,264.64 | 45.08 | |
| 61.8% Down from Intraday High | 33,331.24 | 66.60 | |
| 50% Down from Intraday High | 33,365.73 | 34.50 | |
| Daily Pivot | 33,388.27 | 22.54 | Yes! The Daily Pivot is close to the 50% Down from Intraday High. |
| 38.2% Down from Intraday High | 33,400.23 | 11.96 | Yes! The 38.2% Down from Intraday High is close to the Daily Pivot. |
| Close | 33,433.35 | 33.12 | |
| Open | 33,455.50 | 22.15 | Yes! The Open is close to the Close. |
| High | 33,511.91 | 56.41 | |
| Daily R1 | 33,556.99 | 45.08 | |
| Weekly Pivot | 33,585.73 | 28.74 | Yes! The Weekly Pivot is close to the Daily R1. |
| Daily R2 | 33,680.63 | 94.90 | |
| Weekly R1 | 33,865.15 | 184.53 | |
| Monthly Pivot | 33,936.62 | 71.47 | |
| Weekly R2 | 34,296.96 | 360.34 | |
| Monthly R1 | 34,566.94 | 269.98 | |
| Monthly R2 | 35,700.53 | 1,133.59 |
Here's the updated 2023 forecast, presented in slider format.
![]()
The following is a brief review of how the markets performed over time. The numbers refer to the close-to-close move in the Dow industrials.
No options expire this week.
![]()
The following is based on an SFO article in December 2004 by John Seekinger, titled, "Take a two-dimensional approach." He offers these tips.
| Index | S2 | S1 | Pivot | R1 | R2 |
| Dow Industrials (^DJI): Daily | 33,117 | 33,312 | 33,603 | 33,798 | 34,089 |
| Weekly | 32,899 | 33,203 | 33,610 | 33,915 | 34,322 |
| Monthly | 32,197 | 32,852 | 33,961 | 34,616 | 35,725 |
| S&P500 (^GSPC): Daily | 4,240 | 4,264 | 4,299 | 4,323 | 4,357 |
| Weekly | 4,189 | 4,238 | 4,288 | 4,338 | 4,388 |
| Monthly | 4,053 | 4,171 | 4,356 | 4,473 | 4,659 |
| Nasdaq (^IXIC): Daily | 13,054 | 13,137 | 13,260 | 13,343 | 13,466 |
| Weekly | 12,769 | 12,994 | 13,188 | 13,414 | 13,608 |
| Monthly | 12,258 | 12,738 | 13,444 | 13,925 | 14,630 |
Here are the formulas:
![]()
Earnings season is over.
Here's a symbol list of 195 chart and candlestick patterns (13 "investment grade" candle patterns) found in today's securities using my version of Patternz: ANF, AXDX, ACIW, AFL, APD, AA, ALKS, AYX, DOX, AEO, AXP, AME, AMAT, ACGL, AWI, ADP, AVY, AVA, BSET, BECN, BZH, BIG, BRC, BR, CACI, CAL, CLS, CX, CNP, CENX, CRL, CIEN, CTAS, CNO, CL, CONN, COTY, CR, CRH, CCRN, CMI, CW, DVN, DSGR, ^DJI, DOV, EXP, EBAY, EME, WIRE, EOG, EPAM, EL, FAST, FIS, FISV, FORM, FWRD, GME, GD, GE, GFS, GL, GMS, GS, GFF, HIG, HAYN, HTLD, HWM, HUBG, HUN, IIIN, PODD, ITGR, TILE, IPG, KMT, KLAC, LANC, LMT, MHO, MRO, MRTN, MU, MS, MLI, MYGN, NBR, ^IXIC, NTGR, NEWR, NEU, JWN, OXY, ORI, ASGN, OTEX, PATK, PDCO, PTEN, PCG, PNW, PXD, PINC, PSTG, QTWO, RMBS, RLI, ROP, SAND, SLB, SAIC, SIGI, NOW, SHOP, STR, SKYW, SMAR, SPLK, TFX, TER, TDG, TRV, UHAL, VFC, VMI, MDRX, V, VMC, WRB, WMT, WMB, WSC, IAI, IYC, IYE, IEZ, IHE, DDM, FTEC, QQQ, IYH, IHF, IAT, IEV, IXC, IXN, ILF, SLV, IGE, IEO, IYF, EWO, EWK, EWZ, EWG, EWH, EWI, EWM, EPP, EZA, EWY, EWU, QLD, IBB, PPA, PXJ, PJP, ROBO, XLY, XLP, XLF, XLV, XLI, XLK, VHT, VIS, MGK. Click this link for details (pattern type, start and end dates).
For a list of small patterns (those a few days wide) click this link.
The below industries were the best (rank 1) or worst performing of those I follow.
|
-- Thomas Bulkowski
![]()
Support this site! Clicking any of the books (below) takes you to
Amazon.com If you buy ANYTHING while there, they pay for the referral.
Legal notice for paid links: "As an Amazon Associate I earn from qualifying purchases."
|
My Stock Market Books
|
My Novels
Orb Foresight Rewrite Coming!
|