As of 04/24/2026
Indus: 49,231 -79.61 -0.2%
Trans: 20,892 -198.95 -0.9%
Utils: 1,155 -2.30 -0.2%
Nasdaq: 24,837 +398.10 +1.6%
S&P 500: 7,165 +56.68 +0.8%
|
YTD
+2.4%
+20.4%
+8.1%
+6.9%
+4.7%
|
|
As of 04/24/2026
Indus: 49,231 -79.61 -0.2%
Trans: 20,892 -198.95 -0.9%
Utils: 1,155 -2.30 -0.2%
Nasdaq: 24,837 +398.10 +1.6%
S&P 500: 7,165 +56.68 +0.8%
|
YTD
+2.4%
+20.4%
+8.1%
+6.9%
+4.7%
|
|
As of 04/24/2026
Indus: 49,231 -79.61 -0.2%
Trans: 20,892 -198.95 -0.9%
Utils: 1,155 -2.30 -0.2%
Nasdaq: 24,837 +398.10 +1.6%
S&P 500: 7,165 +56.68 +0.8%
|
YTD
+2.4%
+20.4%
+8.1%
+6.9%
+4.7%
| |
|
| ||
Updated and added 10 examples on 7/17/25.
The broadening top is a poor performer. The break even failure rate is above average and the average rise or decline is below average. Partial rises and declines help predict the breakout direction and allow a trader to enter the stock sooner, but also increase the risk of failure.
$ $ $
For detailed information on this chart pattern, read Encyclopedia of Chart Patterns, 3rd Edition (#ad). If you click the link and then buy the book (or anything) while at Amazon.com, the referral will help support this site. Thanks. -- Tom Bulkowski
$ $ $
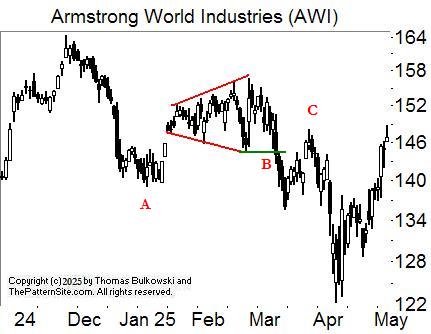
The picture shows a broadening top with a partial decline.
 Broadening Top
|
|
The above numbers are based on 1,215 perfect trades for upward breakouts and 804 for downward breakouts. See the glossary for definitions.
| Characteristic | Discussion |
| Price trend | Upward leading to the pattern. That is, the trend start is below the pattern's start. |
| Shape | Higher peaks and lower valleys -- a megaphone shape. |
| Trendlines | The top trendline slopes upward, the bottom one slopes downward to highlight a broadening pattern. |
| Touches | At least five touches total, three peaks or three valleys should touch the associated trend line with two or more touches of the other trendline. Ideally, the second of three touches will touch (instead of coming 'close' to) the trendline. This avoids the identification problem where price forms an up-sloping channel with an upward spike at pattern's end. |
| White space | Price should cross the pattern from side to side, filling the area with price movement. |
| Breakout | Can occur in any direction (upward 60%) and it happens when price pierces a trendline or moves above/below the end of the pattern. |
Consult the associated figure on the right.
| Trading Tactic | Explanation | 
The Measure Rule |
| Measure rule | Compute the difference between the highest peak (A) and lowest valley (B) in the pattern to get the height. Add the height to the pattern's top (for upward breakouts, works 66% of the time) or subtract it from the pattern's bottom (downward breakouts, works 42% of the time). Or multiply the height by the "percentage meeting price target" (see Important Bull Market Results) and add it to the highest peak (A, upward breakout) or subtract it from the lowest valley (B, downward breakout) to get a price target, D or E, respectively. | |
| Intraformation trade | Buy when price rebounds off the lower trendline (C), and short at the top (A) when price heads down. | |
| Buy at 3rd touch | When price touches the bottom trendline for the third time (C) and begins rising, buy. Warning: This is a high risk entry. | |
| Short at the top | When price touches the top trendline and begins falling (A), sell or sell short. | |
| Partial rise | A partial rise works 52% of the time. | |
| Partial decline | A partial decline works 72% of the time | |
| Price trend | The best performing patterns with upward breakouts are those with an intermediate-term (3-6 months) rise leading to the pattern (from the trend start). | |
| Yearly low | Downward breakouts near the yearly low perform best. Upward breakouts prefer the middle range. The link to the left discusses performance, and this link provides additional information. | |
| Breakout | The breakout direction is upward 60% of the time. | |
| Throwbacks and pullbacks | Both hurt post breakout performance when they appear. |
| Breakout Direction | 1990s | 2000s | 2010s |
| Up (average) | 40% | 49% | 36% |
| Down (average) | 16% | 12% | 13% |
The table shows the average performance (the rise from breakout to the ultimate high or the drop to the ultimate low) of broadening top chart patterns in bull markets over three decades.
Upward breakouts did best in the 2000s but worst in the 2010s.
Downward breakouts outperformed in the 1990s compared to more recent decades.

The figure on the right shows an example of a broadening top chart pattern.
A quick rise starts at A and leads to the broadening top chart pattern. Price oscillates up and down in broadening turns before dropping out of the bottom of the chart pattern and staging a downward breakout.
A pullback ensues, allowing price to recover and traders to exit before the decline resumes. Price attempts to return to the launch point A in late September, but does not make it.
Below are some of the lessons I learned from trading these patterns over the decades. You can use the Patternz simulator to reproduce the charts in full. I downloaded the data from Tiingo but not all stocks currently trade.
I present the information in slider format, so be sure to click the left or right arrows to view another slide.
Please note: These tips are for swing traders or even scalpers, those who want to trade from low to high or skim off a few bucks, and not for buy-and-hold investors.

At the start of 2013, the stock of Amgen (AMGN) began climbing at a good clip. The climb continued until 18 February 2014 when a broadening top appeared (ending 6 March 2014).
An upward breakout from the broadening top lasts only a few days before price reversed and plunged out of the bottom of the chart pattern where a stop loss order waited.
In other words, avoid taking a position in most any chart pattern after a long uptrend like you see here. It's best to find patterns blooming near the start of an uptrend not near the end.

I understand that this chart might confuse you. Alliance Data became Bread Financial (symbol: ADS=BFH, pattern from 17 January 2013 to 1 February 2013). The broadening top appeared well into an uptrend (more of it happens off the chart to the left).
However, in this example, the stock broke the 'avoid the long uptrend' rule. Price moved sideways for a time (blue line) before a steeper uptrend began. I just wanted to show that every rule has it's exceptions. However, this type of winning pattern is rare. So obey the 'avoid long uptrend' rule.

This slide shows Aptargroup (ATR) with a broadening top from 2 May 2011 to 7 July 2011. Notice the long-term upward trend, so the pattern is coming at the end of that rise. However, the focus of this chart is the fast rise across the pattern, which I show circled in red. The stock hits overhead resistance setup by the top trendline and it reverses. Placing a buy stop above the top of the chart pattern doesn't trigger, so we avoid taking a loss when the stock dives. Avoid buying a stock with a fast rise leading to the last trendline touch.
Other symbols showing the same scenario are AEL from 10 July 2012 to 30 July 2012, AFL from 11 November 2014 to 29 December 2014, and BFS from 24 March 2017 to 21 April 2017.

Sometimes a chart pattern can be unusually tall. With the last touch at the bottom, it's a stretch that the stock will rise far enough to breakout upward. Even if it does cross the pattern, how much gas remains in the tank for a continued rise? This is a picture of ALK (Alaska Air Group), from 22 June 2018 to 29 November 2018, and it illustrates what I'm writing about.
Another example of a large move up is ANTM from 17 September 2018 to 4 December 2018. The stock is tall but price climbs to the top of the pattern to breakout upward but then peaks within two months and price dives for the bottom.

Air Products and Chemicals (APD from 6 November 2013 to 27 December 2013). Price rises in a long-term uptrend where I only show a portion of it. So this broadening top is suspect on those grounds. We see a fast rise starting at B, which is a second clue to under-performance. The stock breaks out downward but quickly reverses from the low at A and powers higher. It busts the downward breakout at the top blue line, suggesting a good move ahead. The stock rises, goes sideways and rises again (not shown). The point of this chart, is to look for busted downward breakouts. They are rare and I think that the more shallow the drop after a downward breakout, the more powerful and lasting will be the rally above the top of the chart pattern.

Adobe (ADBE from 15 November 2015 to 23 January 2023). Overhead resistance set up by prior peaks and valleys, but only a portion of them appear in the chart. The stocks forms a broadening top which has an upward breakout, hits overhead resistance and drops to find support at the pattern's bottom. Had a stop loss order been in place a penny below the pattern's low, it would have triggered a sale on the date shown.

AMAT (Applied Materials from 1 June 2021 to 2 August 2021) showed a broadening top that changed into a multi-peak pattern. That pattern warned of under performance.
The stock moved sideways and there was plenty of time to see the multi-peak pattern. The buy from an upward breakout of the broadening top signaled at A, but it was one a trader should have ignored. Price climbed to the ultimate high before dropping a few pennies below the bottom of the chart pattern. A stop loss order placed a penny below the pattern's low would have triggered for a trading loss.

This chart shows ATO (Atmos Energy from 7 April 2017 to 27 April 2017) that formed the right rim of a cup with handle chart pattern. The stock peaked in December 2017 after a good run up.
What this chart shows is that you should consider the entire chart in your view when thinking about how the stock might perform. The cup with handle would suggest a good rise would follow, and it did.

BFH (Bread Financial from 31 October 2014 to 13 January 2015) shows an inset taken from Patternz. It looks like a well-shaped broadening top, and it is. The problem appears when the stock isn't done with its up and down gyrations. A buy signals when price rises above the buy stop placed a penny above the top of the chart pattern (using the high shown in the inset). Then the stock reverses and stops out a trader who places a stop loss order a penny below the bottom of the chart pattern.

All (Allstate from 24 March 2014 to May 2, 2014) shows a broadening top with an upward breakout. Price climbs following a diagonal red trendline. The stock moved sideways and I was worried about it forming a multi-peak, so I sold the stock. The stock made a dip but ultimately continued higher.
The following is a slide show. Click the right or left arrows, or the circles below the chart to navigate around the slides.
Point A is where the trend starts. Price rises into the broadening top, outlined with red lines. At the green line B, a downward breakout occurs when the stock closes below the bottom of the broadening top. C is called a pullback because price pulls back to the breakout price. Pullbacks happen 67% of the time.

A is the broadening top but this changes into a symmetrical triangle (green lines). The AB combination is a diamond top chart pattern.

A broadening top in red followed by a partial rise (A). This partial rise correctly predicts a downward breakout.

The broadening top appears outlined in red. Even though price peaks at A and drops slightly into the broadening top, I still consider it a top and not a bottom because the overall price trend is rising (from B, lower left, to A).

Another example of a broadening top, outlined by two red trendlines.

Another example of a broadening top.

A broadening top, outlined by two red trendlines. The dip at A is a partial decline, but this one fails to predict an immediate upward breakout at B.

Another example of a broadening top, outlined by two red trendlines.

Another example of a broadening top, outlined by two red trendlines with a partial decline at A. This partial decline works, meaning the breakout is immediate and upward.

Another example of a broadening top, outlined by two red trendlines. AB is a nicely shaped Adam & Adam double bottom.
-- Thomas Bulkowski
Support this site! Clicking any of the books (below) takes you to
Amazon.com If you buy ANYTHING while there, they pay for the referral.
Legal notice for paid links: "As an Amazon Associate I earn from qualifying purchases."
|
My Stock Market Books
|
My Novels
Orb Foresight Rewrite Coming!
|
You don't make sense often. Today might be the day.![]()