
As of 01/17/2025
Indus: 43,488 +334.70 +0.8%
Trans: 16,431 -169.75 -1.0%
Utils: 1,013 +1.53 +0.2%
Nasdaq: 19,630 +291.91 +1.5%
S&P 500: 5,997 +59.32 +1.0%
|
YTD
+2.2%
+3.4%
+3.0%
+1.7%
+2.0%
|
|
As of 01/17/2025
Indus: 43,488 +334.70 +0.8%
Trans: 16,431 -169.75 -1.0%
Utils: 1,013 +1.53 +0.2%
Nasdaq: 19,630 +291.91 +1.5%
S&P 500: 5,997 +59.32 +1.0%
|
YTD
+2.2%
+3.4%
+3.0%
+1.7%
+2.0%
| |
|
| ||
Recent Headlines
|

|
Older Headlines
|
Archives |
$ $ $
I show another slider trading quiz featuring Varian Semiconductor: VSEA stock.
$ $ $
Here's a symbol list of 182 chart and candlestick patterns (13 "investment grade" candle patterns) found in today's securities using my version of Patternz: A, ALK, ALB, AMZN, AME, ANIK, APA, ARCB, ADP, AXS, AZTA, BSET, BAX, BZH, BRKR, BLDR, CDAY, CRL, CINF, CTAS, CLX, CNO, CGNX, CMTL, GLW, CRH, CCK, CMI, ^DJT, ^DJI, BOOM, EXP, EME, EMR, EFX, EXPI, FFIV, FICO, FIVN, FTNT, FTV, FWRD, GME, GIS, GPN, GFS, GL, GMS, GFF, GES, DHI, HOV, HUBG, HUN, HURC, IDA, IDXX, NSP, INTC, IPI, KALU, KBH, KEYS, LZB, LEG, LNC, RAMP, MTSI, MANH, MLM, MAS, MRK, MCO, NBR, NFG, NWL, NEU, NKE, JWN, NOVT, NTNX, OGE, ORI, OMC, OTEX, OUT, PTEN, PAYX, PCTY, PPG, PPL, PINC, PFG, RMBS, RGS, RCKY, RES, ^GSPC, SLB, SAIC, SMG, SEE, SEIC, SIGI, SMAR, SR, SXI, TPR, TRGP, TPX, TDC, TEVA, TXN, TXT, TTD, TOL, TZOO, TWLO, UGI, UIS, UNM, VFC, WRB, WU, WOLF, WDAY, IYM, IAI, IYC, IEZ, IHE, DDM, QTEC, FXL, FXI, BOTZ, IYZ, IGV, MXI, IXN, IGE, EWO, EWK, EWQ, EWG, EWH, EWI, EZA, EWP, EWD, TUR, EWU, PPA, DBA, PEJ, PXJ, PHO, SSO, ROBO, XLY, XLI, XLB, SPY, XAR, VIS, VAW. Click this link for details (pattern type, start and end dates).
For a list of small patterns (those a few days wide) click this link.
$ $ $
The following table shows where Fibonacci retrace values of the day's high-low range are plus pivot points, calculated on the Dow industrials, sorted by value. When several are near each other (small differences), the area might act as support or resistance.
-- Thomas Bulkowski, author: Invest for Two-Comma Wealth and the novel (fiction), Foresight (#Ad)
![]()
| © 2025 ThePatternSite.com Metric | Value | Diff | Close (within 10% of the high-low range for the day)? |
| Monthly S2 | 40,919.64 | ||
| Weekly S2 | 41,186.96 | 267.32 | |
| Monthly S1 | 42,203.74 | 1,016.77 | |
| Weekly S1 | 42,337.40 | 133.66 | |
| Weekly Pivot | 42,995.32 | 657.93 | |
| Monthly Pivot | 43,128.98 | 133.66 | |
| Daily S2 | 43,143.84 | 14.86 | Yes! The Daily S2 is close to the Monthly Pivot. |
| Low | 43,312.55 | 168.71 | |
| Open | 43,312.55 | 0.00 | Yes! The Open is close to the Low. |
| Daily S1 | 43,315.84 | 3.29 | Yes! The Daily S1 is close to the Open. |
| 61.8% Down from Intraday High | 43,442.70 | 126.86 | |
| 50% Down from Intraday High | 43,482.90 | 40.20 | |
| Daily Pivot | 43,484.54 | 1.64 | Yes! The Daily Pivot is close to the 50% Down from Intraday High. |
| Close | 43,487.83 | 3.29 | Yes! The Close is close to the Daily Pivot. |
| 38.2% Down from Intraday High | 43,523.10 | 35.27 | |
| High | 43,653.25 | 130.15 | |
| Daily R1 | 43,656.54 | 3.29 | Yes! The Daily R1 is close to the High. |
| Daily R2 | 43,825.24 | 168.71 | |
| Weekly R1 | 44,145.76 | 320.52 | |
| Monthly R1 | 44,413.08 | 267.32 | |
| Weekly R2 | 44,803.68 | 390.61 | |
| Monthly R2 | 45,338.32 | 534.64 |
Here's a symbol list of 140 chart and candlestick patterns (13 "investment grade" candle patterns) found in today's securities using my version of Patternz: ABT, AXDX, AMZN, DOX, AEP, AFG, AIG, AMWD, AMGN, AMAT, ACGL, ASH, ATO, ADP, BSET, BAX, BKNG, BMY, BR, CPB, CLS, CNP, CRL, CTAS, CSCO, CNO, CL, CMTL, COTY, CSGS, DHR, DFS, D, DTE, DUK, BOOM, EMR, EL, EVRG, EXC, FFIV, FICO, FIVN, FTV, FNV, GME, GAP, GD, GL, HQY, HTLD, HELE, HUBG, PODD, TILE, IPI, KLAC, LHX, LRCX, LPLA, LXU, MTSI, MGY, MS, MUR, ^IXIC, NFG, NJR, NI, NOC, NVDA, OGE, PDCO, PTEN, PCTY, PNW, POR, PPG, PPL, PINC, PFG, PEG, QCOM, RL, RGA, RLI, ROL, RES, SAIA, SCHW, SEE, SHW, SO, LUV, SWX, SPSC, TPX, TDC, TMO, TSCO, TRV, TWLO, UGI, UPS, VFC, WLK, WEX, WPM, XEL, IAI, IYK, IHE, FTEC, IEV, IXC, IXN, EWK, EWQ, EWM, EWS, EWY, EWD, EWL, EWT, TUR, QLD, ROBO, GLD, XLK, XLU, SMH, VHT. Click this link for details (pattern type, start and end dates).
For a list of small patterns (those a few days wide) click this link.
$ $ $
You can find setups based on a Fibonacci retrace by clicking on the link.
The following patterns were found manually, not using Patternz. Mr. Bulkowski has excluded any securities he owns from appearing in the list. However, he may add any of the securities listed to his portfolio at any time, just as you can.
In the table below, the red and green colors are based on the historical breakout direction for the associated chart pattern. If a high and tight flag appears, the start and end dates highlight the flagpole only and not the flag.
For details about the chart patterns, click here.
-- Thomas Bulkowski, author: Invest for Two-Comma Wealth and the novel (fiction), Foresight (#Ad)
![]()
| Symbol | Chart Pattern | Bullish Bearish | Start | End | Industry |
| ANF | Pipe bottom | 12/09/2024 | 12/16/2024 | Apparel | |
| ABM | Double Bottom, Adam and Eve | 12/18/2024 | 01/07/2025 | Industrial Services | |
| ACIW | Double Bottom, Adam and Eve | 12/30/2024 | 01/07/2025 | IT Services | |
| AES | Double Bottom, Adam and Adam | 12/19/2024 | 12/30/2024 | Electric Utility (East) | |
| AFL | Double Bottom, Eve and Adam | 12/18/2024 | 01/13/2025 | Insurance (Diversified) | |
| ALB | Double Bottom, Eve and Adam | 01/02/2025 | 01/10/2025 | Chemical (Diversified) | |
| AEE | Double Bottom, Adam and Eve | 12/19/2024 | 01/06/2025 | Electric Utility (Central) | |
| AEP | Double Bottom, Adam and Eve | 12/19/2024 | 01/08/2025 | Electric Utility (Central) | |
| AIG | Double Bottom, Adam and Adam | 12/18/2024 | 01/10/2025 | Insurance (Prop/Casualty) | |
| ARCB | Double Bottom, Eve and Adam | 12/30/2024 | 01/13/2025 | Trucking/Transp. Leasing | |
| ACGL | Double Bottom, Eve and Eve | 12/20/2024 | 01/13/2025 | Insurance (Prop/Casualty) | |
| ATO | Double Bottom, Adam and Eve | 12/19/2024 | 01/06/2025 | Natural Gas (Diversified) | |
| BMRN | Triangle, ascending | 11/11/2024 | 01/03/2025 | Biotechnology | |
| BR | Broadening bottom | 12/20/2024 | 01/10/2025 | Information Services | |
| COR | Double Bottom, Eve and Eve | 12/19/2024 | 01/02/2025 | Biotechnology | |
| CNP | Double Bottom, Adam and Eve | 12/10/2024 | 01/08/2025 | Electric Utility (Central) | |
| CENX | Double Bottom, Adam and Adam | 12/20/2024 | 01/03/2025 | Metals and Mining (Div.) | |
| CTAS | Double Bottom, Adam and Eve | 12/20/2024 | 12/30/2024 | Industrial Services | |
| CNO | Double Bottom, Adam and Adam | 12/18/2024 | 01/10/2025 | Insurance (Diversified) | |
| CMTL | Dead-cat bounce | 01/13/2025 | 01/13/2025 | Telecom. Equipment | |
| GLW | Triple bottom | 12/18/2024 | 01/13/2025 | Telecom. Equipment | |
| CTS | Pipe top | 11/04/2024 | 11/11/2024 | Electronics | |
| CMI | Triple bottom | 12/20/2024 | 01/03/2025 | Machinery | |
| CW | Double Bottom, Eve and Eve | 12/18/2024 | 01/13/2025 | Machinery | |
| DFS | Double Bottom, Eve and Adam | 12/18/2024 | 01/10/2025 | Financial Services | |
| DTE | Head-and-shoulders bottom | 12/10/2024 | 12/30/2024 | Electric Utility (Central) | |
| EBAY | Double Bottom, Adam and Adam | 12/30/2024 | 01/03/2025 | Internet | |
| EL | Double Bottom, Adam and Adam | 01/03/2025 | 01/10/2025 | Toiletries/Cosmetics | |
| EVRG | Double Bottom, Eve and Eve | 12/19/2024 | 01/13/2025 | Electric Utility (Central) | |
| FFIV | Triple bottom | 12/20/2024 | 01/13/2025 | Internet | |
| FARO | Triple bottom | 12/20/2024 | 01/13/2025 | Precision Instrument | |
| FRD | Pipe top | 12/02/2024 | 12/09/2024 | Building Materials | |
| GME | Horn top | 12/23/2024 | 01/06/2025 | Retail (Special Lines) | |
| GL | Pipe bottom | 12/02/2024 | 12/09/2024 | Insurance (Life) | |
| GS | Double Bottom, Eve and Eve | 12/18/2024 | 01/13/2025 | Securities Brokerage | |
| GFF | Double Bottom, Adam and Eve | 12/30/2024 | 01/08/2025 | Building Materials | |
| HIG | Double Bottom, Eve and Adam | 12/20/2024 | 01/10/2025 | Insurance (Prop/Casualty) | |
| HD | Double Bottom, Adam and Eve | 12/20/2024 | 01/08/2025 | Retail Building Supply | |
| DHI | Double Bottom, Adam and Eve | 12/19/2024 | 01/13/2025 | Homebuilding | |
| HUBG | Double Bottom, Adam and Adam | 12/20/2024 | 01/13/2025 | Trucking/Transp. Leasing | |
| IEX | Double Bottom, Adam and Adam | 01/03/2025 | 01/13/2025 | Machinery | |
| PODD | Double Bottom, Eve and Eve | 12/19/2024 | 01/02/2025 | Medical Supplies | |
| IPAR | Triple bottom | 12/23/2024 | 01/13/2025 | Toiletries/Cosmetics | |
| IBKR | Double Bottom, Eve and Adam | 12/20/2024 | 01/02/2025 | Securities Brokerage | |
| KALU | Triple bottom | 12/20/2024 | 01/08/2025 | Metals and Mining (Div.) | |
| LZB | Triple bottom | 12/20/2024 | 01/10/2025 | Furn/Home Furnishings | |
| LLY | Double Top, Adam and Adam | 12/20/2024 | 01/13/2025 | Drug | |
| L | Double Bottom, Adam and Adam | 12/19/2024 | 01/13/2025 | Insurance (Prop/Casualty) | |
| LOW | Triple bottom | 12/20/2024 | 01/08/2025 | Retail Building Supply | |
| MTSI | Double Bottom, Eve and Adam | 01/02/2025 | 01/13/2025 | Semiconductor | |
| MTRX | Double Bottom, Adam and Adam | 12/30/2024 | 01/13/2025 | Oilfield Svcs/Equipment | |
| ^IXIC | Triple top | 12/16/2024 | 01/06/2025 | None | |
| NFG | Double Bottom, Eve and Eve | 11/07/2024 | 12/20/2024 | Natural Gas (Diversified) | |
| NI | Double Bottom, Eve and Eve | 12/19/2024 | 01/06/2025 | Electric Utility (Central) | |
| NTNX | Double Bottom, Eve and Eve | 01/02/2025 | 01/13/2025 | E-Commerce | |
| OXM | Double Bottom, Adam and Adam | 12/12/2024 | 12/30/2024 | Apparel | |
| PAYX | Double Bottom, Adam and Adam | 12/18/2024 | 01/06/2025 | IT Services | |
| PPG | Double Bottom, Adam and Adam | 01/03/2025 | 01/10/2025 | Chemical (Diversified) | |
| PPL | Double Bottom, Adam and Adam | 12/19/2024 | 01/13/2025 | Electric Utility (East) | |
| RTX | Triple bottom | 12/09/2024 | 01/06/2025 | Aerospace/Defense | |
| ROG | Horn top | 11/25/2024 | 12/09/2024 | Electronics | |
| SAIA | Double Bottom, Adam and Adam | 01/02/2025 | 01/10/2025 | Trucking/Transp. Leasing | |
| SKYW | Double Bottom, Eve and Eve | 12/18/2024 | 12/30/2024 | Air Transport | |
| SO | Double Bottom, Adam and Adam | 01/06/2025 | 01/13/2025 | Electric Utility (East) | |
| SNPS | Head-and-shoulders bottom | 12/20/2024 | 01/14/2025 | Computer Software and Svcs | |
| TDY | Double Bottom, Eve and Eve | 01/06/2025 | 01/13/2025 | Aerospace/Defense | |
| TPX | Triple bottom | 12/10/2024 | 01/08/2025 | Furn/Home Furnishings | |
| TXN | Double Bottom, Eve and Eve | 12/20/2024 | 01/02/2025 | Semiconductor | |
| TDG | Triple bottom | 11/22/2024 | 01/08/2025 | Aerospace/Defense | |
| TWLO | Triple bottom | 12/20/2024 | 01/13/2025 | E-Commerce | |
| UGI | Head-and-shoulders bottom | 12/06/2024 | 01/07/2025 | Natural Gas (Distributor) | |
| UPS | Double Bottom, Adam and Adam | 12/20/2024 | 01/13/2025 | Air Transport | |
| VFC | Triple bottom | 12/30/2024 | 01/08/2025 | Apparel | |
| VMI | Triple bottom | 12/20/2024 | 01/13/2025 | Metal Fabricating | |
| WRB | Double Bottom, Adam and Adam | 12/20/2024 | 01/10/2025 | Insurance (Prop/Casualty) | |
| WSC | Double Bottom, Adam and Adam | 12/20/2024 | 12/30/2024 | Industrial Services | |
| ZBRA | Triple bottom | 12/18/2024 | 01/13/2025 | Computers and Peripherals |
![]()
$ $ $
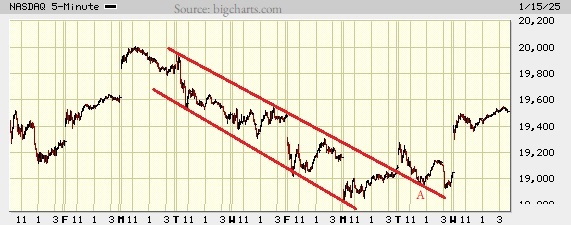
I show a picture of the Nasdaq composite on the 5-minute scale.
I don't have a lot to say about the chart. The index followed the channel down. I show the channel as two nearly parallel lines.
At A, the index completed what's called a throwback. That's when a chart pattern (in this case, the channel) breaks out upward but quickly (within a month but it usually happens in about a week to 10 days) returns to the breakout price. That's what you see at A.
As to what all of this means for the index going forward, I haven't a clue.
$ $ $
Here's a symbol list of 214 chart and candlestick patterns (13 "investment grade" candle patterns) found in today's securities using my version of Patternz: DDD, AES, AFL, ATSG, ALGT, AMZN, AEO, AFG, AIG, AMWD, AMN, AAPL, ARCB, ACGL, AWI, AGO, AVNT, BECN, BZH, BIO, BMRN, BKH, BFH, BLDR, CX, COR, CIEN, CTAS, CNO, CNX, CMTL, COP, COST, COTY, CCK, DHR, DFS, ^DJT, DOV, DUK, EXP, EME, EFX, EQT, EXPI, FFIV, FICO, FAST, FLS, FWRD, FNV, GME, IT, GE, GL, GMS, GGG, GFF, HQY, HTLD, HSII, HNI, HD, DHI, HOV, HWM, HUBG, JBHT, IDA, ITW, IBP, IIIN, IPI, ISRG, IRM, K, KELYA, KFRC, KLAC, LZB, LANC, LEG, LNC, LOW, LXU, MHO, MTSI, MGY, MAN, MLM, MAS, META, MGEE, MLKN, MCO, MLI, MUR, NFG, NFLX, NTAP, NEU, NOC, NUS, OGE, OLN, ORCL, OMI, PATK, PDCO, PTEN, PYPL, PFE, POR, PPG, PFG, PHM, RMBS, RRC, RJF, RHI, ROK, RES, R, SAIA, SBH, SEE, SIGI, SMTC, NOW, SHW, SLGN, SCCO, LUV, SCS, SSYS, SRDX, TPX, TXT, TOL, TSCO, TREX, UHAL, VFC, VLO, VMI, VRTX, V, VMC, WRB, WSO, WERN, WLK, WEX, XEL, ITA, IYM, IAI, IYC, IYE, IEZ, FXL, FXI, IAT, IYZ, IGV, IXC, MXI, ILF, IGE, IEO, IYF, ITB, IHI, EWK, EWZ, EEM, EWQ, EWG, EWH, EIS, EWI, EWM, EZA, EWY, EWP, EWD, EWT, IBB, PEJ, PXJ, PJP, PHO, XLE, XLF, GLD, XHB, XLI, XLB, XRT, USO, VIS, VAW. Click this link for details (pattern type, start and end dates).
For a list of small patterns (those a few days wide) click this link.
$ $ $
The following table shows where Fibonacci retrace values of the day's high-low range are plus pivot points, calculated on the Nasdaq composite, sorted by value. When several are near each other (small differences), the area might act as support or resistance.
-- Thomas Bulkowski, author: Invest for Two-Comma Wealth and the novel (fiction), Foresight (#Ad)
![]()
| © 2025 ThePatternSite.com Metric | Value | Diff | Close (within 10% of the high-low range for the day)? |
| Monthly S2 | 18,392.36 | ||
| Weekly S2 | 18,523.44 | 131.09 | |
| Monthly S1 | 18,951.79 | 428.35 | |
| Weekly S1 | 19,017.34 | 65.54 | |
| Daily S2 | 19,203.57 | 186.23 | |
| Low | 19,299.32 | 95.75 | |
| Open | 19,350.31 | 50.99 | |
| Daily S1 | 19,357.40 | 7.09 | Yes! The Daily S1 is close to the Open. |
| 61.8% Down from Intraday High | 19,394.66 | 37.26 | |
| 50% Down from Intraday High | 19,424.11 | 29.45 | |
| Daily Pivot | 19,453.15 | 29.04 | |
| 38.2% Down from Intraday High | 19,453.56 | 0.41 | Yes! The 38.2% Down from Intraday High is close to the Daily Pivot. |
| Close | 19,511.23 | 57.67 | |
| Weekly Pivot | 19,512.64 | 1.41 | Yes! The Weekly Pivot is close to the Close. |
| High | 19,548.90 | 36.26 | |
| Monthly Pivot | 19,578.19 | 29.29 | |
| Daily R1 | 19,606.98 | 28.79 | |
| Daily R2 | 19,702.73 | 95.75 | |
| Weekly R1 | 20,006.54 | 303.81 | |
| Monthly R1 | 20,137.62 | 131.09 | |
| Weekly R2 | 20,501.84 | 364.22 | |
| Monthly R2 | 20,764.02 | 262.17 |
Support this site! Clicking any of the books (below) takes you to
Amazon.com If you buy ANYTHING while there, they pay for the referral.
Legal notice for paid links: "As an Amazon Associate I earn from qualifying purchases."
|
My Stock Market Books
|
My Novels
|