As of 03/31/2026
Indus: 46,342 +1,125.37 +2.5%
Trans: 18,610 +579.97 +3.2%
Utils: 1,159 +0.80 +0.1%
Nasdaq: 21,591 +795.99 +3.8%
S&P 500: 6,529 +184.80 +2.9%
|
YTD
-3.6%
+7.2%
+8.5%
-7.1%
-4.6%
|
|
As of 03/31/2026
Indus: 46,342 +1,125.37 +2.5%
Trans: 18,610 +579.97 +3.2%
Utils: 1,159 +0.80 +0.1%
Nasdaq: 21,591 +795.99 +3.8%
S&P 500: 6,529 +184.80 +2.9%
|
YTD
-3.6%
+7.2%
+8.5%
-7.1%
-4.6%
|
|
As of 03/31/2026
Indus: 46,342 +1,125.37 +2.5%
Trans: 18,610 +579.97 +3.2%
Utils: 1,159 +0.80 +0.1%
Nasdaq: 21,591 +795.99 +3.8%
S&P 500: 6,529 +184.80 +2.9%
|
YTD
-3.6%
+7.2%
+8.5%
-7.1%
-4.6%
| |
|
| ||
Updated and added 10 examples on 7/21/25.
The right-angled and descending broadening chart pattern about ties with the performance of right-angled ascending broadening pattern in a bull market (43% average rise). The break even failure rate is slightly above average, though, at 21%. This is not a chart pattern you'll want to curl up with at night and dream about using it to trade.
$ $ $
For detailed information on this chart pattern, read Encyclopedia of Chart Patterns, 3rd Edition (#ad). If you click the link and then buy the book (or anything) while at Amazon.com, the referral will help support this site. Thanks. -- Tom Bulkowski
$ $ $
The picture shows a right-angled broadening formation, descending (RABFD).

Right-Angled Broadening Formation, Descending
|
The above numbers are based on 601 perfect trades for upward breakouts and 335 for downward breakouts. See the glossary for definitions.
| Characteristic | Discussion |
| Price trend | Can be up or down leading to the pattern. |
| Shape | A megaphone tilted down with the top horizontal. |
| Trendlines | The top trendline is horizontal, the bottom one slopes downward. |
| Touches | At least five touches total, three peaks or three valleys should touch the associated trend line with two or more touches of the other trendline. Ideally, the second of three touches will touch (instead of coming 'close' to) the trendline. |
| Breakout | Upward 64% of the time. |
![]() More (#ad)
More (#ad)
| Trading Tactic | Explanation |  The Measure Rule |
| Measure rule | Compute the height from the horizontal trendline (B in the Measure Rule figure to the right) to the lowest valley (A) and multiply it by the above 'percentage meeting price target.' Add the result to the horizontal trendline (B, upward breakouts) or subtract it from the lowest valley (A, downward breakouts) to get the price target (C). | |
| Intraformation trade | Buy at the bottom trendline when price starts rising and sell or sell short once price turns at the horizontal trendline. | |
| Buy at 3rd touch | When price touches the bottom trendline for the third time and begins rising, buy. | |
| Partial rise | A partial rise works 47% of the time. | |
| Partial decline | A partial decline works 75% of the time. | |
| Price trend | The best performing patterns are those with an intermediate-term (3-6 months) price trend leading to the pattern. | |
| Yearly middle | For downward breakouts, the lowest third of the yearly price range performs best. Upward breakouts do best in the middle third of the range. | |
| Volume trend | A rising volume trend results in the best post breakout performance. |
![]() More (#ad)
More (#ad)
| Breakout Direction | 1990s | 2000s | 2010s |
| Up (average) | 35% | 53% | 35% |
| Down (average) | 16% | 13% | 17% |
The table above shows the average performance of right-angled descending broadening top chart patterns in bull markets over three decades.
Upward breakouts did best in the 2000s but the other two decades held steady.
Downward breakouts did worst in the 2000s and outperformed in the 2010s.

The above figure shows an example of a right-angled broadening formation, descending chart pattern. Price begins a decline at A that leads to the chart pattern. Price bounces between a horizontal trendline on the top and a down-sloping one along the bottom of the chart pattern. A partial decline at B signals an impending upward breakout at C. After the breakout, price makes a strong move upward.
![]() More (#ad)
More (#ad)
Below are some of the lessons I learned from trading these patterns over the decades. You can use the Patternz simulator to reproduce the charts in full. I downloaded the data from Tiingo but not all stocks currently trade.
I present the information in slider format, so be sure to click the left or right arrows to view another slide.
Please note: These tips are for swing traders or even scalpers, those who want to trade from low to high or skim off a few bucks, and not for buy-and-hold investors.

BMY (Bristol Myers Squibb, from 14 May 2007 to 5 June 2007). This RABFD had no overhead resistance at least none shown on this chart (except for round number). So price was clear to rise. The stock broke out downward and then busted the breakout when price climbed above the top of the chart pattern. Unfortunately, in this case, the stock didn't rise much before finding the ultimate high and tumbling.

CHD (Church & Dwight from 27 November 2015 to 23 December 2015). This is similar to the prior chart but I wanted to show a second example. This RABFD has little overhead resistance but it forms as part of a multi-peak pattern (this chart is actually at the top of an upward move). The stock breaks out downward, reverses, and busts the breakout when it soars out the top. In this example, the stock makes a good climb, but only a portion of it shows here. It peaked at 53.
Be careful taking a position in a stock with a fast rise like that shown at A. This one works, but...

BLL (Ball Corporation symbol is now BALL from 8 August 2016 to 6 September 2016). This chart shows one of two variations of a fast rise where price goes vertical either before the chart pattern (like that shown here) or within it. The rise following the breakout fails and the stock drops. A fast rise for the RABFD and failure happens a lot with this chart pattern.

BAX (Baxter International from 8 September 2021 to 13 December 2021). This is another example of a fast rise but this rise happens at the end of the chart pattern. Starting from C, the stock makes a sharp move higher to A. I expected it to stall there, and it did, but didn't hang out long. The stock continued higher for a few more points before reversing and closing below the bottom of the chart pattern, busting the upward breakout and likely leading to a failed trade. Notice the fast move at B, suggesting this chart pattern would struggle.

This is a chart of CACI (CACI International from 2 February 2007 to 8 March 2007). The stock gaps lower in an event pattern called a dead-cat bounce. After the drop ended, there wasn't much of a bounce. These types of drops happen from time to time in stocks but what traders need to remember is that if one happens, others can happen again. Those events center around earnings misses. Every three months there's a chance of another big drop (probability of it happening: 26% in 3 months, 38% in 6 months). This DCB triggered an entry on the top of the pattern and price stopped out the trade below the pattern, as shown. Because of the DCB, avoid trading this stock at least for 6 months.

BAX (Baxter International from 26 April 2007 to 5 June 2007). This is an example of a failed trade that happens after a long uptrend. Although some uptrends last for years, perhaps as long as a decade, they are rare. In this case, how much longer will the uptrend last? Answer, the stock reverses just after entering a trade.

BRC (Brady Corp, from 22 April 2014 to May 12 20140). Overhead resistance, if you figure out where it will appear, can make or break a trader. In this chart, we see a RABFD appear after a long downtrend (the right RABFD). That's not a good start because these downtrends often last longer than one would expect. However, a stock will turn upward sooner or later. In this case, the stock broke out downward, reversed, and soared out the top of the chart pattern. The new breakout upward busted the downward breakout and suggested a good move higher. However, overhead resistance put the brakes on the rise. The stock reversed at the blue line and tumbled.

BA (Boeing from 6 October 1994 to 20 October 1994). This small RABFD appears to rest on support and makes for a good upward move reaching 60 in 1997.
![]() More (#ad)
More (#ad)
The following is a slide show. Click the right or left arrows, or the circles below the chart to navigate around the slides.
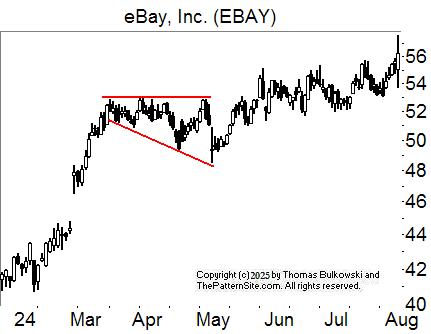
Between the two red lines rests a RABFD, a right-angled broadening formation, descending. It sports a flat top and down-sloping price trend along the bottom.

This is another example of a RABFD.

This is another example of a RABFD in a downtrend.

Price doesn't rise far in this RABFD (to A) before reversing and busting (at B) the upward breakout.

This is another example of a RABFD. At A, we see a small partial decline which correctly predicts an immediate and upward breakout in this example.

This is another example of a RABFD.

This is another example of a RABFD except that this partial decline (A) doesn't work (no immediate upward breakout).

This partial decline (A) works in this RABFD. The breakout is upward (B) and immediate.

This is another example of a RABFD. The breakout is downward, at A but that's only obvious after the fact (since the point lies on the bottom trendline if you extend it).

This RABFD acts as a reversal of the downward price trend (A to the RABFD) and sends the stock upward (to B).
-- Thomas Bulkowski
![]() More (#ad)
More (#ad)
Support this site! Clicking any of the books (below) takes you to
Amazon.com If you buy ANYTHING while there, they pay for the referral.
Legal notice for paid links: "As an Amazon Associate I earn from qualifying purchases."
|
My Stock Market Books
|
My Novels
Orb Foresight Rewrite Coming!
|
Does the information superhighway have any rest stops?![]()