As of 04/10/2026
Indus: 47,917 -269.23 -0.6%
Trans: 20,339 -116.79 -0.6%
Utils: 1,183 -7.39 -0.6%
Nasdaq: 22,903 +80.47 +0.4%
S&P 500: 6,817 -7.77 -0.1%
|
YTD
-0.3%
+17.2%
+10.7%
-1.5%
-0.4%
|
|
As of 04/10/2026
Indus: 47,917 -269.23 -0.6%
Trans: 20,339 -116.79 -0.6%
Utils: 1,183 -7.39 -0.6%
Nasdaq: 22,903 +80.47 +0.4%
S&P 500: 6,817 -7.77 -0.1%
|
YTD
-0.3%
+17.2%
+10.7%
-1.5%
-0.4%
|
|
As of 04/10/2026
Indus: 47,917 -269.23 -0.6%
Trans: 20,339 -116.79 -0.6%
Utils: 1,183 -7.39 -0.6%
Nasdaq: 22,903 +80.47 +0.4%
S&P 500: 6,817 -7.77 -0.1%
|
YTD
-0.3%
+17.2%
+10.7%
-1.5%
-0.4%
| |
|
| ||
Updated and added 10 examples on 7/29/25.
For more information on this pattern, read
Encyclopedia of Chart Patterns Second Edition

If you click on the above link and then buy the book (or anything) while at Amazon.com, the referral will help support this site. Thanks.
$ $ $
The numbers cited in this article are based on hundreds of perfect trades. See the glossary for definitions.
The dead-cat bounce is the name of this event pattern. Price makes a dramatic drop, averaging 30%, before bouncing only to resume the decline at a more leisurely rate.
Which industries are more likely to have stocks that dead-cat bounce? For the answer, click here.

|

|
Reference the above figure in the following table.
| Characteristic | Discussion |
|---|---|
| Event decline, Price gap | Price usually gaps downward, closing 15% to 70% lower than the prior day. The average event decline from prior close to trend low is 31%. |
| Trend low | Forty-six percent make a lower low the next day, 17% continue lower the next day, then 9%, and then 3%, respectively. From the event day to the trend low averages 7 days. |
| Bounce | After the event day decline, price bounces. Twenty-two percent will close the gap during the bounce phase, 38% will close it in 3 months, and 58% will close the gap in 6 months. The average bounce height from event low to bounce high is 28% and takes 23 days. |
| Post-bounce decline | Once the bounce completes, price resumes declining, averaging 30% from the bounce high to post-bounce low in 49 days. This places price an average of 18% below the event low 67% of the time. |
| Second dead-cat bounce | Twenty-six percent will have a second dead-cat bounce measuring at least 15% within 3 months, and 38% will dead-cat bounce within 6 months. |
I released a trading setup based on new research using a dead-cat bounce that may interest you.
| Trading Tactic | Explanation |
|---|---|
| Bounce | The larger the event day decline, the larger the bounce and the longer it takes for price to reach the bounce high. |
| Sell | If you own the stock, wait for the bounce to peak (if you can figure out when that is) and then sell. |
| Swingers | Swing traders can buy near the event trend low and ride price upward until it peaks in the bounce phase. Only try this if the event day decline is a large one, say over 30%. Event losses (from the close the day before the event to the trend low) above the median 28% decline had bounces averaging 35% in 25 days. Those below the median bounced 22% and took 20 days. |
| Short | For experienced traders, short the stock at the top of the bounce and ride price lower. Expect price to drop to at least the event trend low. |

The above figure shows an example of a dead-cat bounce.
On July 5, 2001, a broker issued a report that said Amazon.com would beat the consensus estimate for earnings. It didn't. When Amazon.com announced earnings results on July 23, they were below expectations. Price gapped open and closed 25% lower. The next day, price made a lower low and then started a recovery. It bounced upward for about a week and then turned down. When price finally began a recovery, it had bottom 66% below the close the day before the earnings announcement.
The following is a slide show. Click the right or left arrows, or the circles below the chart to navigate around the slides.
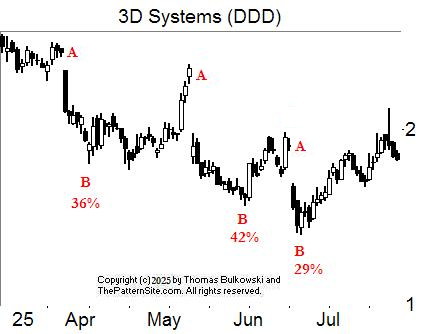
This stock shows three dead-cat bounce patterns. A is the price bar the day before the event decline. B is the event trend low. The three event declines, from left to right, measure 36%, 42%, and 20% (from the close at A to the trend low, B). I did not investigate the cause of these declines (or any of them pictured in these ten examples).

A is the day before the event. B is the event trend low. C is the bounce high, and D is the post bounce low.

Another example of a dead-cat bounce event pattern. A shows the event decline. B is the event trend low. C is the bounce high, and D is the post bounce low.

Another example of a dead-cat bounce event pattern. A shows the event decline. B is the event trend low. C is the bounce high, and D is the post bounce low. Price at B and D are nearly the same.

Another example of a dead-cat bounce event pattern. A shows the event and trend low. B is the bounce high, and C is the post bounce low.

Another example of a dead-cat bounce event pattern. A shows the event decline. B is the event trend low. C is the bounce high, and D is the post bounce low.

This dead-cat bounce didn't see much of a decline at A, nor a bounce, B. The post-bounce low is C.

The event at A took price lower. At B, you didn't have much time before the horizontal move broke down and price plummeted.

The event at A took price lower. At B, you had 4 days to sell before price dropped below the event low.

If you waited for a substantial bounce (B) to occur, down from A at 123.50 (close), you'd have lost a lot of money.
-- Thomas Bulkowski
![]()
Support this site! Clicking any of the books (below) takes you to
Amazon.com If you buy ANYTHING while there, they pay for the referral.
Legal notice for paid links: "As an Amazon Associate I earn from qualifying purchases."
|
My Stock Market Books
|
My Novels
Orb Foresight Rewrite Coming!
|
Never use a big word where a diminutive one will suffice.![]()