As of 05/04/2026
Indus: 48,942 -557.37 -1.1%
Trans: 19,606 -992.51 -4.8%
Utils: 1,153 -4.13 -0.4%
Nasdaq: 25,068 -46.64 -0.2%
S&P 500: 7,201 -29.37 -0.4%
|
YTD
+1.8%
+13.0%
+7.9%
+7.9%
+5.2%
|
|
As of 05/04/2026
Indus: 48,942 -557.37 -1.1%
Trans: 19,606 -992.51 -4.8%
Utils: 1,153 -4.13 -0.4%
Nasdaq: 25,068 -46.64 -0.2%
S&P 500: 7,201 -29.37 -0.4%
|
YTD
+1.8%
+13.0%
+7.9%
+7.9%
+5.2%
|
|
As of 05/04/2026
Indus: 48,942 -557.37 -1.1%
Trans: 19,606 -992.51 -4.8%
Utils: 1,153 -4.13 -0.4%
Nasdaq: 25,068 -46.64 -0.2%
S&P 500: 7,201 -29.37 -0.4%
|
YTD
+1.8%
+13.0%
+7.9%
+7.9%
+5.2%
| |
|
| ||
Updated and added 10 examples on 7/8/25.
For more information on this pattern, read Encyclopedia of Chart Patterns, 3rd Edition. That book gives a complete review of the chart pattern, compared to what is described in this article.
If you click on the above link and then buy the book (or anything) while at Amazon.com, the referral helps support this site without adding to your cost. Thanks.
Ascending scallops are arguably the most common chart pattern, but they are mid-list performers.
Important Bull Market Results for Ascending ScallopsOverall performance rank for up/down breakouts (1 is best): 20 out of 39/22 out of 36
Break even failure rate for up/down breakouts: 11%/23%
Average rise/decline: 42%/15%
Throwback/pullback rate: 68%/64%
Percentage meeting price target for up/down breakouts: 62%/29%
The above numbers are based on more than 1,600 perfect trades. See the glossary for definitions. |

Ascending Scallop
|
| Characteristic | Discussion |
| Price trend | Upward leading to the chart pattern. |
| Shape | The chart pattern looks like the letter J. Find two peaks with a rounded valley in between and a higher right peak. |
| Narrowing | Scallops tend to be wider near the start of a price trend than near the end. |
| Breakout, confirmation | A close above the highest peak in the chart pattern signals an upward breakout. Downward breakouts are a close below the pattern's low. A breakout confirms the scallop as a valid chart pattern. |
Consult the associated figures on the right.
| Trading Tactic | Explanation |

The Measure Rule

Scallop Handle
|
| Measure rule | Compute the height from the highest peak (A) to the lowest valley in the pattern (B) and then multiply it by the above 'percentage meeting price target.' Add the difference to the highest peak (A) to get a price target for upward breakouts (C) or subtract it from the lowest valley (B) for downward breakouts to get a target price. The link to the left provides more information on the measure rule. | |
| Handle | When price peaks on the right of the pattern, it often retraces, forming a handle or another scallop. When price bottoms, buy. The figure on the lower right shows an example. | |
| Stop | Place a stop below the lowest valley (B in the figure to the upper right) if it's not too far away. The associate link provides more information about stop placement. | |
| Breakout volume | Ascending scallops with heavy breakout volume outperform. The link to the left provides more information while this link provides performance information. | |
| Yearly middle | Upward breakouts from scallops in the middle third of the yearly price range do best. See the link to the left for more information. | |
| Throwback | Throwbacks hurt post breakout performance. The link on the left defines a throwback and this link gives performance information. | |
| Series | Ascending scallops in a rising price trend tend to get shorter and narrower as the trend end approaches. |

The figure on the right shows an example of an ascending scallop chart pattern. Price bottoms at point A and then rises to B where it rounds downward to C.
To calculate a price target, subtract the price of valley A from peak B. That finds the height. Multiply the height by the 'percentage meeting price target' from Important Bull Market Results table near the top of this page, and add the result to the price at B.
Place a stop loss order a few pennies below C if the ascending scallop forms a handle.
If no handle appears, a stop below A may be too far away, but consider it. Raise the stop as price rises. Alternatively, consider placing a stop loss order a few pennies below the left-rim. In the figure, that would be about 13.97 or 13.93 (pick an odd number, not 14 where everyone else will place their stop).
For downward breakouts, subtract the B-A height from A to get a lower target. Ignore targets less than zero.
The following is a slide show. Click the right or left arrows, or the circles below the chart to navigate around the slides.
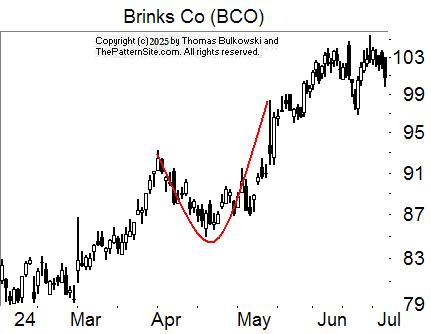
This is a picture of an ascending scallop, outlined in red.

The stock does not close below the bottom of the chart pattern, at A. Instead, it closes above the pattern for an upward breakout.

This odd-looking ascending scallop breaks out upward but price doesn't rise far (A). 'A' is the breakout, which is the first close above the top of the scallop.

Shown are two ascending scallops. The left one has a downward breakout but the right one has an upward breakout.

This large ascending scallop has a downward breakout, but it's not shown.

This ascending scallop breaks out downward. In a bull market ascending scallops breakout upward 83% of the time.

This is a picture of an ascending scallop, outlined in red.

Another ascending scallop.

Where does this ascending scallop end, at A or B, or perhaps another point? Answer: You decide.

This is a picture of an ascending scallop, outlined in red.
-- Thomas Bulkowski
Support this site! Clicking any of the books (below) takes you to
Amazon.com If you buy ANYTHING while there, they pay for the referral.
Legal notice for paid links: "As an Amazon Associate I earn from qualifying purchases."
|
My Stock Market Books
|
My Novels
Orb Foresight Rewrite Coming!
|
I'm paranoid! Stop following me!![]()