As of 04/22/2026
Indus: 49,490 +340.65 +0.7%
Trans: 21,923 -2,010.03 -8.4%
Utils: 1,130 -3.53 -0.3%
Nasdaq: 24,658 +397.60 +1.6%
S&P 500: 7,138 +73.89 +1.0%
|
YTD
+3.0%
+26.3%
+5.8%
+6.1%
+4.3%
|
|
As of 04/22/2026
Indus: 49,490 +340.65 +0.7%
Trans: 21,923 -2,010.03 -8.4%
Utils: 1,130 -3.53 -0.3%
Nasdaq: 24,658 +397.60 +1.6%
S&P 500: 7,138 +73.89 +1.0%
|
YTD
+3.0%
+26.3%
+5.8%
+6.1%
+4.3%
|
|
As of 04/22/2026
Indus: 49,490 +340.65 +0.7%
Trans: 21,923 -2,010.03 -8.4%
Utils: 1,130 -3.53 -0.3%
Nasdaq: 24,658 +397.60 +1.6%
S&P 500: 7,138 +73.89 +1.0%
|
YTD
+3.0%
+26.3%
+5.8%
+6.1%
+4.3%
| |
|
| ||
Updated: 1/5/2026.

This is a chart of the S&P 500 forecast for 2026.
If the forecast is correct, expect weakness in January followed by a flat to down section from April to June. After that, the index trends higher to year end.
![]()
Below is the forecast for the years after 2013, presented in slider format (think slide show). Use the arrows on the left and right side of the chart to advance to the next slide (or go back one slide). The circles at the bottom of the chart allow you to move from slide to slide easily. Click on the circle to jump to the associated slide.
The charts show the S&P 500 in black price bars and the forecast in red using the daily scale. The year is listed on the chart in the upper left.
The forecast is based on the work of Edgar Lawrence Smith in the 1930s. Smith said that the stock market followed a 10-year cycle. Each year tended to repeat the behavior of the year a decade earlier. In other words, if you averaged all years ending in 1 (2001, 1991, 1981 and so on), that would give you a forecast for 2011. For 2012, you'd make a similar average, only use 2002, 1992, 1982, and so on. That's what I did for the market forecast charts which follow.


The forecast hugged the actual performance until May.

The forecast only missed the ending close in the index by three percentage points and hugged the actual performance for most of the year.

The two lines chased each other until mid October, when the forecast diverged from the actual.

Notice that the forecast and actual performance missed by just one percentage point, even though the two lines diverged along the way.

Even though the forecast fell short of actual close by ten percentage points, the price trend mimicked the actual trend closely (except for the forecasted weakness going into the March low).

The COVID-19 pandemic took the markets down in a swift but short bear market in February to March, as the chart shows. The recovery took longer, though, as the markets looked to the future.
If we could flip the forecast upside down, it would better match the forecast.

After recovering from Covid, the two lines diverged so the prediction was the biggest miss since 2014.

The forecast was correct in that it predicted a close for the year below the open, but it missed the actual close by a wide margin.

The forecast tracked the actual move of the S&P 500, missing the ending close by just five percentage points.
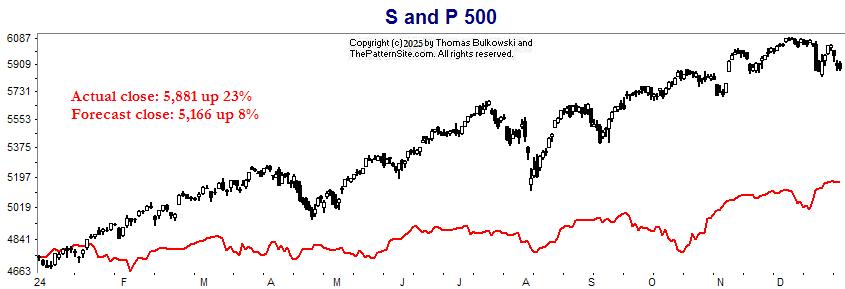
Here's the S&P 500 index on the daily scale for 2024. The S&P 500 was supposed to climb by 8% but actually posted a 23% gain.

This is a chart of the S&P 500 index on the daily scale along with the 2025 forecast.
Shown is how the index and forecast played out in 2025.
Support this site! Clicking any of the books (below) takes you to
Amazon.com If you buy ANYTHING while there, they pay for the referral.
Legal notice for paid links: "As an Amazon Associate I earn from qualifying purchases."
|
My Stock Market Books
|
My Novels
Orb Foresight Rewrite Coming!
|