As of 05/06/2026
Indus: 49,911 +612.34 +1.2%
Trans: 20,366 +346.07 +1.7%
Utils: 1,136 -16.63 -1.4%
Nasdaq: 25,839 +512.81 +2.0%
S&P 500: 7,365 +105.90 +1.5%
|
YTD
+3.8%
+17.3%
+6.3%
+11.2%
+7.6%
|
|
As of 05/06/2026
Indus: 49,911 +612.34 +1.2%
Trans: 20,366 +346.07 +1.7%
Utils: 1,136 -16.63 -1.4%
Nasdaq: 25,839 +512.81 +2.0%
S&P 500: 7,365 +105.90 +1.5%
|
YTD
+3.8%
+17.3%
+6.3%
+11.2%
+7.6%
|
|
As of 05/06/2026
Indus: 49,911 +612.34 +1.2%
Trans: 20,366 +346.07 +1.7%
Utils: 1,136 -16.63 -1.4%
Nasdaq: 25,839 +512.81 +2.0%
S&P 500: 7,365 +105.90 +1.5%
|
YTD
+3.8%
+17.3%
+6.3%
+11.2%
+7.6%
| |
|
| ||
Updated: 1/5/2026.

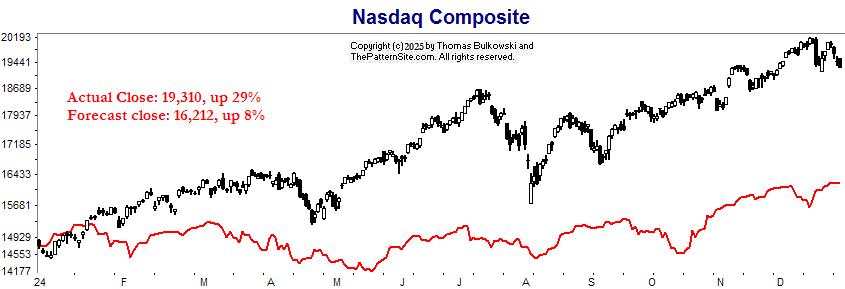
This is a chart of the Nasdaq forecast for 2026.
The year's low was at A, B to C shows the index easing lower with a takeoff to year's end after C. At D, the index is forecast to drop.
![]()
Below is the forecast for the years since 2014, presented in slider format (think slide show). Use the arrows on the left and right side of the chart to advance to the next slide (or go back one slide). The circles at the bottom of the chart allow you to move from slide to slide easily. Click on the circle to be taken to the associated slide.
The charts show the Nasdaq in black price bars and the forecast in red using the daily scale. The year is listed on the chart in the upper left.
The forecast is the red line and it's based on the work of Edgar Lawrence Smith in the 1930s. Smith said that the stock market followed a 10-year cycle. Each year tended to repeat the behavior of the year a decade earlier. In other words, if you averaged all years ending in 1 (2001, 1991, 1981 and so on), that would give you a forecast for 2011. For 2012, you'd make a similar average, only use 2002, 1992, 1982, and so on. That's what I did for the market forecast charts which follow.


The COVID-19 pandemic took the markets down in a swift but short bear market in February to March, as the chart shows. The recovery took longer, though, as the markets looked to the future.
If we could flip the forecast upside down, it would better match the forecast.


The forecast is below the actual by 16%.

The year ended 20% higher versus a forecast of 9% higher. The actual move tracked the forecast for about 6 weeks at the start but it didn't predict the Trump tariff drop to the April low.
Support this site! Clicking any of the books (below) takes you to
Amazon.com If you buy ANYTHING while there, they pay for the referral.
Legal notice for paid links: "As an Amazon Associate I earn from qualifying purchases."
|
My Stock Market Books
|
My Novels
Orb Foresight Rewrite Coming!
|