As of 04/17/2026
Indus: 49,447 +868.71 +1.8%
Trans: 22,422 +609.39 +2.8%
Utils: 1,158 -6.73 -0.6%
Nasdaq: 24,468 +365.78 +1.5%
S&P 500: 7,126 +84.78 +1.2%
|
YTD
+2.9%
+29.2%
+8.4%
+5.3%
+4.1%
|
|
As of 04/17/2026
Indus: 49,447 +868.71 +1.8%
Trans: 22,422 +609.39 +2.8%
Utils: 1,158 -6.73 -0.6%
Nasdaq: 24,468 +365.78 +1.5%
S&P 500: 7,126 +84.78 +1.2%
|
YTD
+2.9%
+29.2%
+8.4%
+5.3%
+4.1%
|
|
As of 04/17/2026
Indus: 49,447 +868.71 +1.8%
Trans: 22,422 +609.39 +2.8%
Utils: 1,158 -6.73 -0.6%
Nasdaq: 24,468 +365.78 +1.5%
S&P 500: 7,126 +84.78 +1.2%
|
YTD
+2.9%
+29.2%
+8.4%
+5.3%
+4.1%
| |
|
| ||
Released 1/2/2024.
Below is the updated forecast for 2024 as of the close on January 2, 2024. Captions appear below the pictures for guidance, so be sure to scroll down far enough to read them.
On some of the charts (all except the CPI chart) the prediction in red is based on the work of Edgar Lawrence Smith in the 1930s. Smith said that the stock market followed a 10-year cycle. Each year tended to repeat the behavior of the year a decade earlier. In other words, if you averaged all years ending in 1 (2001, 1991, 1981 and so on), that would give you a forecast for 2011. For 2012, you'd make a similar average, only use 2002, 1992, 1982, and so on. That's what I did for the market forecast charts which follow.
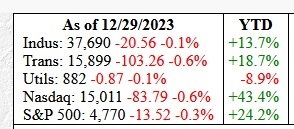
This is how the indices ended the year.
The Nasdaq was the big winner with a gain of 43%. The loser was the Dow utilities. With interest rates rising, the utility index suffered. As interest rates begin to fall in 2024, look for the utilities to do well.
These numbers do not include dividends, by the way.
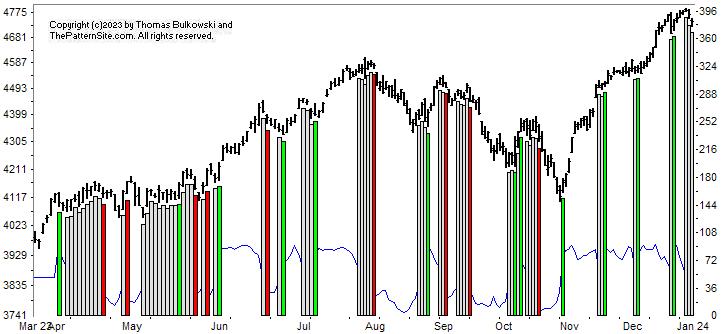
This is a chart of the Chart Pattern Indicator (CPI) on the daily scale.
The S&P 500 composite peaked 3 trading days ago, right when the CPI turned from bullish to neutral. That's probably not accurate because signals can change for up to a week. More likely is that today's (Tuesday's) drop changed the signal 3 days ago to neutral. If the index continues lower, then I'd expect to see the CPI turn bearish.
If you look toward the bottom of the chart, you'll see that after the green bar the CPI took a sharp plunge.
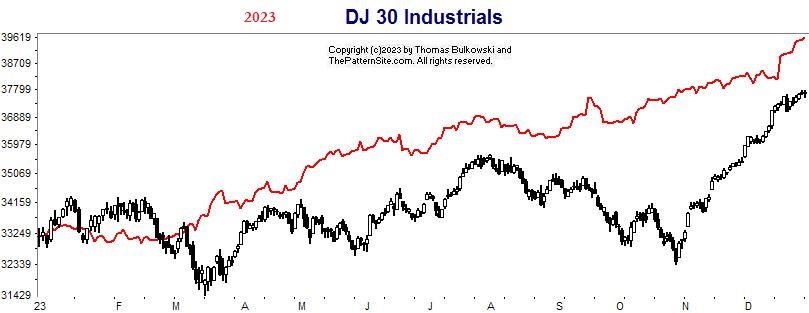
This is a chart of the Dow industrials on the daily scale from last year (2023). It shows that the forecast (red line, made before the year started) was a smooth line trending higher whereas the index was more choppy.
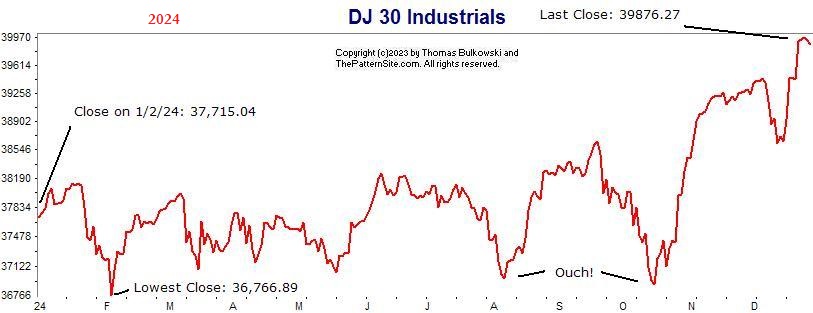
This is a chart of the Dow industrials forecast for this year.
This shows the Dow closing 6% higher for the year (based on the close on 1/2/24, not last year's close). The Dow will be flat (not gaining ground) until October where it begins a year-end sprint.
If you want to buy the dip, then you'll have opportunities in February, August and October, with additional ones as we leave spring for summer.
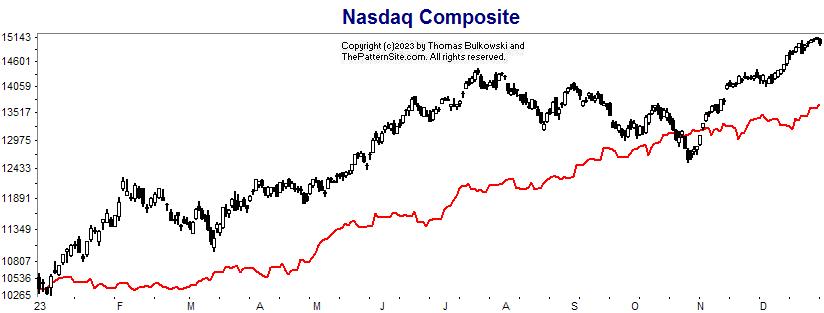
This is the Nasdaq on the daily chart with the forecast in red for 2023.
Again, the forecast for last year was flat but so was the Nasdaq. While the forecast showed an upward trend all year long, the actual Nasdaq retraced starting in July and ending in October. The index beat the forecast by about 12% (I'm eyeballing the numbers).
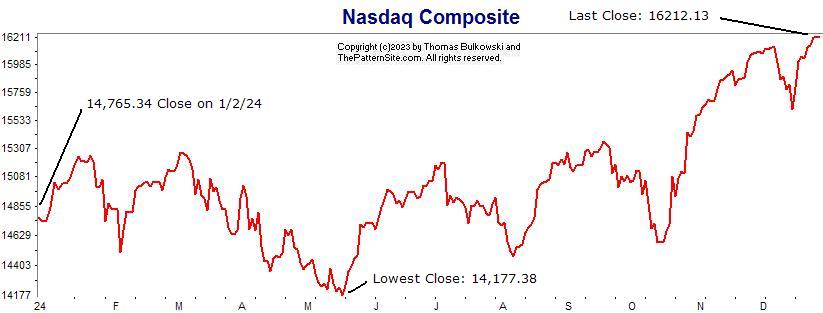
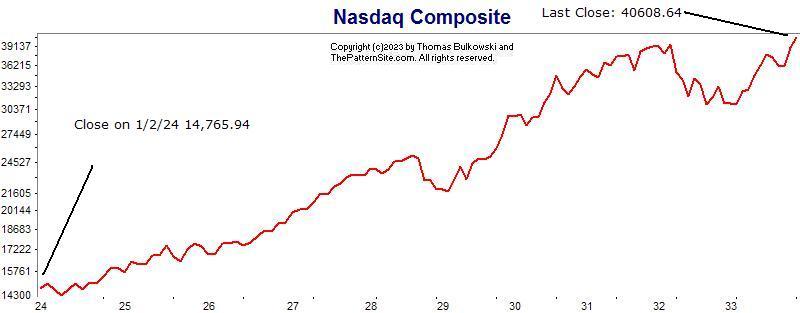
This is the Nasdaq forecast on the daily chart for 2024.
If this forecast is correct, it's going to be a bumpy year. With such declines, it gives investors and traders opportunity to buy stocks on sale (buy the dip opportunities).
The chart shows the index closing up about 10% this year.
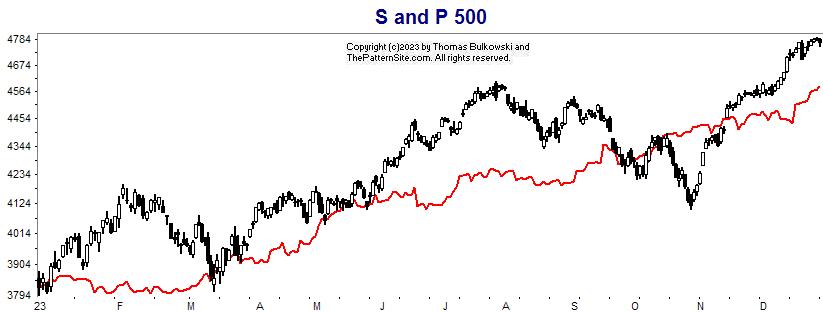
Here's the S&P 500 index on the daily scale for 2023 and the forecast made a year ago.
The red line in this chart is similar to the others: a flat uptrend. The actual index had more up and down waves to it than forecast.
The forecast missed the actual performance by only a few hundred points, which I consider quite good for a year-ahead prediction.
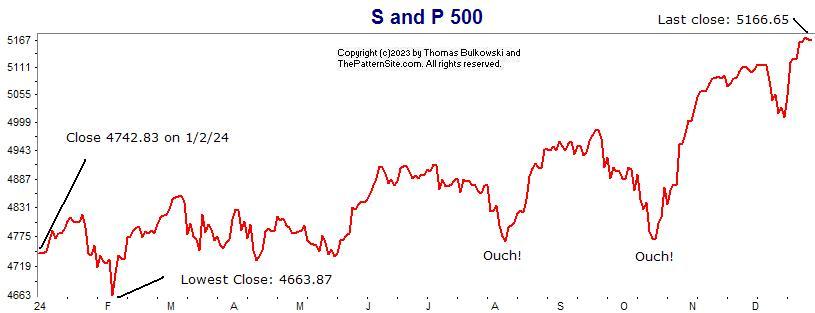
Here's the S&P 500 forecast for 2024 on the daily scale.
Like the Nasdaq, the index dips a lot this year. It's a bumpy ride if the forecast is accurate. The forecast last year was for a straight line move up and remember how wavy it turned out. This time the forecast is predicting dips, so imagine how steep they will be...or not.
The index is forecast to grow 9% this year.
This is the monthly forecast starting with this year and going 10 years out.
The forecast shows a gain of 175%. Years 2028 and 2032 will be bumpy. It may be that 2032 is a bear market that ends with a nice recovery in 2033. Year 2028 looks like a 10% correction.
This year shows a dip in May (that's from the prior chart. This chart looks like the February dip is the big one for the year) and a recovery to end the year higher.
Support this site! Clicking any of the books (below) takes you to
Amazon.com If you buy ANYTHING while there, they pay for the referral.
Legal notice for paid links: "As an Amazon Associate I earn from qualifying purchases."
|
My Stock Market Books
|
My Novels
Orb Foresight Rewrite Coming!
|