As of 04/30/2026
Indus: 49,652 +790.33 +1.6%
Trans: 20,794 +262.22 +1.3%
Utils: 1,165 +22.58 +2.0%
Nasdaq: 24,892 +219.07 +0.9%
S&P 500: 7,209 +73.06 +1.0%
|
YTD
+3.3%
+19.8%
+9.1%
+7.1%
+5.3%
|
|
As of 04/30/2026
Indus: 49,652 +790.33 +1.6%
Trans: 20,794 +262.22 +1.3%
Utils: 1,165 +22.58 +2.0%
Nasdaq: 24,892 +219.07 +0.9%
S&P 500: 7,209 +73.06 +1.0%
|
YTD
+3.3%
+19.8%
+9.1%
+7.1%
+5.3%
|
|
As of 04/30/2026
Indus: 49,652 +790.33 +1.6%
Trans: 20,794 +262.22 +1.3%
Utils: 1,165 +22.58 +2.0%
Nasdaq: 24,892 +219.07 +0.9%
S&P 500: 7,209 +73.06 +1.0%
|
YTD
+3.3%
+19.8%
+9.1%
+7.1%
+5.3%
| |
|
| ||
My book, Encyclopedia of Chart Patterns, 3rd Edition (#ad) covers the diving board in depth, so buy a copy for additional details.
If you click on the above link and then buy the book (or anything) while at Amazon.com, the referral will help support this site. Thanks.
$ $ $
Updated and added 10 examples on 8/5/25.
I discovered the diving board chart pattern on November 25, 2010 -- Thanksgiving Day -- when I went shopping for stocks to buy. I noticed that price formed a flat base (the diving board) and then plunged downward (diving into the water) followed by a straight-line run up (returning to the surface and climbing out of the water). The flat base and downward plunge reminded me of jumping off a diving board, hence the pattern's name.
I found 760 diving board patterns with upward breakouts using the weekly charts in 513 stocks from May 1990 to June 2019. It's somewhat rare but plentiful enough to find during a diligent search. A spot check of the pattern reveals that it also appears on the daily charts, but I didn't study those. The discussion below pertains to diving boards on the weekly scale.
The ideal diving board chart pattern, in the graphic below, shows the shape of the pattern.

Ideal Diving Board Pattern
|
The above numbers are based on 760 perfect trades in a bull market on the weekly price scale. See the glossary for definitions.
![]() More (#ad)
More (#ad)
| Characteristic | Discussion |
| Weekly scale | Use the weekly price chart to find this pattern. |
| Price trend | I removed most diving boards which appeared in downward trends. I prefer to find them in flat or upward trends. |
| Diving board | Look for price to have a flat bottom, not top (the top can be any shape, but a flat bottom is critical). This is the diving board. |
| Plunge | Price makes a straight-line run down or nearly so (see Plunge in the figure below). This is the plunge into the water. |
| 2nd Plunge | Avoid trading patterns which make a second, lower plunge. |
| Recovery | After the sharp drop, price recovers, sometimes in a straight-line run upward. This is the move from the bottom of the pond back onto shore. |

Look for the diving board chart pattern on the weekly scale. That's the scale I was using when I noticed it, so you can find it on the daily and other charts but performance will vary.
Price should make a flat base. In other words, the bottoms of price should line up with few outliers plunging through the bottom. I prefer a tight congestion region that's horizontal, but allow variations. I counted a few patterns with slanting bases (forming symmetrical triangles). A horizontal congestion region seemed to give the best performance. The median width of the pattern (including the plunge) was 204 days (about 7 months).
After the flat base, look for a price plunge. I prefer a straight-line drop down, not one that meanders lower and had lots of consolidation regions. I wanted the decline to be a serious one, one that shakes bulls to the core.
The drop from the bottom of the board portion of the pattern to the plunge low was a median of 14%.
![]() More (#ad)
More (#ad)
The median diving board length was 204 days (from board start to plunge low). Those with boards narrower than 204 days showed gains averaging 67% versus those with longer boards and gains of 80%.
| Trading Tactic | Explanation |
| Diving board length, height | Wider (longer than 204 days) is better. Taller is better (height divided by the breakout price (pattern top) greater than 27%). |
| Ride it | Price returns to the diving board bottom 71% of the time. |
| Buy signal | When price closes above the top of the chart pattern, buy. The gain from there to the ultimate high averages 73%. This is the preferred method (lower risk) to trade a diving board. |
| 2nd Plunge | Avoid trading patterns which make a second, lower plunge. |
If you can determine when the plunge has ended, such as using a down-sloping trendline, then that could get you into the trade early.
Hold onto the trade as long as the upward trend continues. As a benchmark, I used a trend change to signal the end of a trend. That means price turned down at least 20% after peaking. Measuring the climb from the plunge low to that peak showed that 71% of the patterns had price reaching or exceeding the bottom of the diving board.
Trading the rise from the plunge low back to the bottom of the board (or higher), is a high risk proposition. The preferred method of trading a diving board, is to wait for price to close above the top of the pattern, then buy and hold for a year, perhaps two.
![]() More (#ad)
More (#ad)

The chart shows an example of a diving board chart pattern on the weekly scale in Albemarle (ALB), outlined in red.
Price moves horizontally in a congestion region for about four months before making a plunge lower. Traders versed in chart patterns will recognize a descending triangle (thin green line on the top, red below).
The stock reversed after the plunge bottomed in February. The stock recovered nicely and continued to soar above the top of the diving board pattern.
![]() More (#ad)
More (#ad)
The following is a slide show. Click the right or left arrows, or the circles below the chart to navigate around the slides.
All figures use the weekly scale.
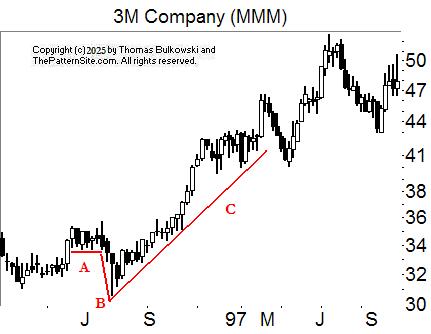
This is an example of how the diving board pattern is supposed to work. A is the diving board. B is the plunge, and C is the recovery.

Another diving board. If you can figure out when the plunge ends, you can buy and ride it up to the recovery high. In this case, that's A. If you missed exiting the trade at A by holding for another week, then you would have suffered a significant give-back of profit.

Another diving board example, A. The safest entry is to place a buy stop at the green line B (a penny above the top of the diving board).

This diving board (A) made a steep plunge (B) but not much of a recovery (to C). Placing a buy stop at the top of the board would not have triggered an entry.

This diving board (A) had a recovery (to B) that didn't look like much until you checked the price scale. A perfect swing trade from plunge low to recovery high would have made 30%.

Another example of a diving board with a good recovery.

This diving board (A) was a dud if you bought at the green line, B.

This diving board looks like a cloud bank chart pattern. Nice recovery to the high at A.

Long board, short plunge. The drop at B is concerning but the recovery to A represents a nice potential gain.

This is another example where a diving board did not see a recovery (A) high enough to trigger an entry.
-- Thomas Bulkowski
![]() More (#ad)
More (#ad)
Support this site! Clicking any of the books (below) takes you to
Amazon.com If you buy ANYTHING while there, they pay for the referral.
Legal notice for paid links: "As an Amazon Associate I earn from qualifying purchases."
|
My Stock Market Books
|
My Novels
Orb Foresight Rewrite Coming!
|
You're at the end of the road again.![]()