
As of 04/26/2024
Indus: 38,240 +153.86 +0.4%
Trans: 15,171 -126.01 -0.8%
Utils: 884 -10.33 -1.2%
Nasdaq: 15,928 +316.14 +2.0%
S&P 500: 5,100 +51.54 +1.0%
|
YTD
+1.5%
-4.6%
+0.3%
+6.1%
+6.9%
|
|
As of 04/26/2024
Indus: 38,240 +153.86 +0.4%
Trans: 15,171 -126.01 -0.8%
Utils: 884 -10.33 -1.2%
Nasdaq: 15,928 +316.14 +2.0%
S&P 500: 5,100 +51.54 +1.0%
|
YTD
+1.5%
-4.6%
+0.3%
+6.1%
+6.9%
| |
|
| ||
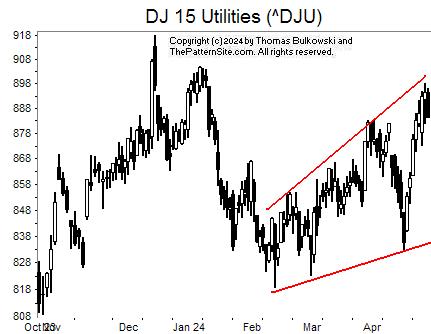
I show the Dow utilities on the daily scale.
Outlined in red is a chart pattern called an ascending broadening wedge. That has two trendlines (red lines in this example) trending upward but widening (diverging).
Stocks showing ascending broadening wedges breakout downward 52% of the time. I'm surprised it's not higher. Because the index is near the top trendline, we'll see if it breaks out upward first (by closing above the top red line).
![]()
The following is a brief review of how the markets performed over time. The numbers refer to the close-to-close move in the Dow industrials.
No options expire this week.
![]()
The following is based on an SFO article in December 2004 by John Seekinger, titled, "Take a two-dimensional approach." He offers these tips.
| Index | S2 | S1 | Pivot | R1 | R2 |
| Dow Industrials (^DJI): Daily | 37,942 | 38,091 | 38,214 | 38,363 | 38,487 |
| Weekly | 37,378 | 37,809 | 38,185 | 38,616 | 38,992 |
| Monthly | 36,316 | 37,278 | 38,573 | 39,535 | 40,830 |
| S&P500 (^GSPC): Daily | 5,054 | 5,077 | 5,096 | 5,119 | 5,137 |
| Weekly | 4,916 | 5,008 | 5,061 | 5,153 | 5,207 |
| Monthly | 4,795 | 4,947 | 5,106 | 5,259 | 5,417 |
| Nasdaq (^IXIC): Daily | 15,683 | 15,805 | 15,893 | 16,016 | 16,103 |
| Weekly | 15,010 | 15,469 | 15,725 | 16,184 | 16,440 |
| Monthly | 14,613 | 15,270 | 15,880 | 16,538 | 17,148 |
Here are the formulas:
![]()
Earnings season is either underway or should be starting soon. The sessions could be more volatile.
Here's a symbol list of 130 chart and candlestick patterns (13 "investment grade" candle patterns) found in today's securities using my version of Patternz: ACN, AEIS, AFL, ALGT, ALL, AEO, AEP, AON, AMAT, ATR, ARCB, AXS, BSET, BECN, BZH, BMRN, BFH, BCO, BBW, CHKP, CVX, CSCO, CLF, ED, CSGP, COST, COTY, CR, CCRN, CCK, DVN, DFS, DSGR, DTE, BOOM, EIX, EFX, EL, FIS, FE, FIVN, GIS, GMS, HOV, HURC, IDXX, NSP, IBP, ISRG, JNJ, KBH, KLAC, KLIC, LHX, LZB, LEN, M, MCHX, MS, MLI, NFG, NTGR, NEU, NEE, OGE, ORI, OXM, PKE, PRFT, PCG, PHM, KWR, DGX, ROST, RES, SAIA, SAND, SIGI, SMTC, SCI, SKX, SMAR, SO, SCCO, SWN, SPSC, SXI, SUM, TFX, TER, TXN, TTD, TOL, TWLO, VMC, WWW, IDU, FXI, BOTZ, ITB, IHI, EEM, EWQ, EWH, EWM, EPP, EZA, EWY, TUR, GLD, XHB, XAR, XLU. Click this link for details (pattern type, start and end dates).
For a list of small patterns (those a few days wide) click this link.
The below industries were the best (rank 1) or worst performing of those I follow.
|
-- Thomas Bulkowski, author: Invest for Two-Comma Wealth and Training "Miles" (#Ad) ![]()
![]()
$ $ $
Here's a symbol list of 113 chart and candlestick patterns (13 "investment grade" candle patterns) found in today's securities using my version of Patternz: ACN, AFL, ALGT, AEE, AEP, AEL, AME, AMGN, APA, ADM, BCPC, BECN, BIG, BKNG, BFH, BMY, BRKR, BG, CACI, CNP, CENX, CNA, CL, COTY, DECK, DFS, ELV, EME, EL, EVH, EXC, FE, FORM, GIS, GILD, HQY, HP, HON, HUM, JBHT, HURC, IDXX, JBLU, JNJ, LLY, LMT, M, MLM, MAS, MRK, META, MGEE, MS, MYGN, NTAP, NWL, NEU, NOC, NWPX, NUS, OGE, ASGN, OXM, PRFT, PFE, PCG, PLXS, DGX, RMBS, RGA, ROST, R, CRM, SCCO, LUV, SWN, SRDX, TRGP, TFX, TDC, TER, TXT, TDG, TZOO, TG, VMI, VEEV, WU, WWW, WDAY, IYM, IHE, SOXX, ITB, EWK, EWH, EWS, EZA, EWL, PXJ, XLB, XLU, USO. Click this link for details (pattern type, start and end dates).
For a list of small patterns (those a few days wide) click this link.
$ $ $
You can find setups based on a Fibonacci retrace by clicking on the link.
The following patterns were found manually, not using Patternz. Mr. Bulkowski has excluded any securities he owns from appearing in the list. However, he may add any of the securities listed to his portfolio at any time, just as you can.
In the table below, the red and green colors are based on the historical breakout direction for the associated chart pattern. If a high and tight flag appears, the start and end dates highlight the flagpole only and not the flag.
For details about the chart patterns, click here.
-- Thomas Bulkowski, author: Invest for Two-Comma Wealth and Training "Miles" (#Ad) ![]()
![]()
| Symbol | Chart Pattern | Bullish Bearish | Start | End | Industry |
| APH | Double Top, Adam and Eve | 03/25/2024 | 04/04/2024 | Electronics | |
| ADP | Triangle, symmetrical | 03/15/2024 | 04/24/2024 | IT Services | |
| BCPC | Head-and-shoulders top | 02/29/2024 | 03/21/2024 | Chemical (Specialty) | |
| BIO | Double Top, Adam and Eve | 02/16/2024 | 03/22/2024 | Medical Supplies | |
| BMRN | Double Top, Adam and Adam | 04/12/2024 | 04/24/2024 | Biotechnology | |
| BLDR | Head-and-shoulders top | 03/08/2024 | 04/04/2024 | Retail Building Supply | |
| CAL | Scallop, descending | 03/27/2024 | 04/24/2024 | Shoe | |
| CLS | Pipe top | 04/01/2024 | 04/08/2024 | Electronics | |
| ED | Double Bottom, Adam and Adam | 03/26/2024 | 04/16/2024 | Electric Utility (East) | |
| COTY | Pipe bottom | 04/08/2024 | 04/15/2024 | Toiletries/Cosmetics | |
| DFS | Pipe bottom | 04/08/2024 | 04/15/2024 | Financial Services | |
| D | Double Bottom, Adam and Adam | 03/26/2024 | 04/16/2024 | Electric Utility (East) | |
| DRQ | Head-and-shoulders top | 02/27/2024 | 04/03/2024 | Oilfield Svcs/Equipment | |
| DUK | Broadening top | 03/11/2024 | 04/19/2024 | Electric Utility (East) | |
| ELV | Triple bottom | 03/01/2024 | 04/12/2024 | Medical Services | |
| FRD | Triangle, ascending | 04/05/2024 | 04/25/2024 | Building Materials | |
| GIS | Pipe bottom | 04/08/2024 | 04/15/2024 | Food Processing | |
| NSP | Triple bottom | 04/05/2024 | 04/16/2024 | Human Resources | |
| JBLU | Dead-cat bounce | 04/23/2024 | 04/23/2024 | Air Transport | |
| RAMP | Triangle, symmetrical | 03/11/2024 | 04/03/2024 | Computer Software and Svcs | |
| NFLX | Double Top, Eve and Eve | 03/21/2024 | 04/08/2024 | Internet | |
| NTNX | Double Top, Eve and Eve | 03/08/2024 | 04/11/2024 | E-Commerce | |
| OUT | Scallop, ascending and inverted | 02/20/2024 | 04/19/2024 | Advertising | |
| POR | Triple bottom | 03/14/2024 | 04/16/2024 | Electric Utility (West) | |
| RES | Head-and-shoulders top | 04/08/2024 | 04/23/2024 | Oilfield Svcs/Equipment | |
| TWLO | Triple top | 03/13/2024 | 04/01/2024 | E-Commerce | |
| UHAL | Triangle, ascending | 01/31/2024 | 04/03/2024 | Trucking/Transp. Leasing | |
| VLO | Pipe top | 04/01/2024 | 04/08/2024 | Petroleum (Integrated) | |
| VECO | Big M | 03/01/2024 | 04/09/2024 | Precision Instrument | |
| MDRX | Triangle, descending | 03/18/2024 | 04/25/2024 | Healthcare Information | |
| WWW | Pipe bottom | 04/08/2024 | 04/15/2024 | Shoe |
![]()
Since I post this the night before, check how the futures are trading before market open. Large moves can affect the opening direction.
$ $ $
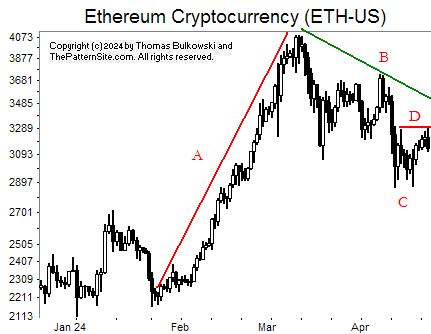
I show a picture of Ethereum on the daily scale.
Let's go through it by the letters.
At A, we see a strong uptrend, what I call a straight-line run up. There are few pauses along the way in a breath-taking rise.
At B, we see a messy retrace. Price can't decide on a direction so it falls and retraces. Rinse. Repeat.
At C, we see a potential double bottom. It hasn't confirmed as a valid double bottom because the currency hasn't closed above line D, which is the highest peak between the two bottoms. If the double bottom confirms, then look for the currency to rise. Until then, there's a substantial risk that it'll tumble (like 44% or something like that).
$ $ $
Here's a symbol list of 104 chart and candlestick patterns (13 "investment grade" candle patterns) found in today's securities using my version of Patternz: ANF, AFL, AMZN, AEE, AEO, AEL, AME, AMN, APH, ANIK, APA, ATO, BSET, BSX, BRC, BMY, CACI, CDNS, CPB, CNP, CHD, CINF, CLF, CMTL, COTY, CR, CCK, DECK, XRAY, DFS, ECL, EL, EG, EVH, FAST, FE, GME, GIS, HQY, HP, HUM, JBHT, HURC, IDA, NSP, JBLU, K, LDOS, LLY, LPLA, MANH, MCHX, MAS, MGEE, MS, NWPX, NUS, NVDA, OGE, OLN, OMC, ASGN, ON, OXM, PDCO, PCG, PG, PEG, PSTG, RL, RGA, RCKY, RGLD, SCCO, TDY, TXT, UGI, UNM, VEEV, WRB, WSO, WU, WWW, WDAY, ZBRA, ITA, IHE, FXI, EWK, EWH, EWM, PHO, XLB. Click this link for details (pattern type, start and end dates).
For a list of small patterns (those a few days wide) click this link.
$ $ $
The following table shows where Fibonacci retrace values of the day's high-low range are plus pivot points, calculated on the Nasdaq composite, sorted by value. When several are near each other (small differences), the area might act as support or resistance.
-- Thomas Bulkowski, author: Invest for Two-Comma Wealth (Ad)
![]()
| © 2024 ThePatternSite.com Metric | Value | Diff | Close (within 10% of the high-low range for the day)? |
| Monthly S2 | 14,508.72 | ||
| Weekly S2 | 14,671.11 | 162.39 | |
| Monthly S1 | 15,110.73 | 439.62 | |
| Weekly S1 | 15,191.93 | 81.20 | |
| Daily S2 | 15,524.17 | 332.24 | |
| Daily S1 | 15,618.46 | 94.29 | |
| Low | 15,634.44 | 15.98 | Yes! The Low is close to the Daily S1. |
| 61.8% Down from Intraday High | 15,712.58 | 78.14 | |
| Close | 15,712.75 | 0.17 | Yes! The Close is close to the 61.8% Down from Intraday High. |
| Daily Pivot | 15,728.73 | 15.98 | Yes! The Daily Pivot is close to the Close. |
| 50% Down from Intraday High | 15,736.72 | 7.99 | Yes! The 50% Down from Intraday High is close to the Daily Pivot. |
| Weekly Pivot | 15,743.60 | 6.88 | Yes! The Weekly Pivot is close to the 50% Down from Intraday High. |
| 38.2% Down from Intraday High | 15,760.86 | 17.26 | Yes! The 38.2% Down from Intraday High is close to the Weekly Pivot. |
| Open | 15,805.60 | 44.74 | |
| Daily R1 | 15,823.02 | 17.42 | Yes! The Daily R1 is close to the Open. |
| Monthly Pivot | 15,824.80 | 1.78 | Yes! The Monthly Pivot is close to the Daily R1. |
| High | 15,839.00 | 14.20 | Yes! The High is close to the Monthly Pivot. |
| Daily R2 | 15,933.29 | 94.29 | |
| Weekly R1 | 16,264.42 | 331.13 | |
| Monthly R1 | 16,426.81 | 162.39 | |
| Weekly R2 | 16,816.09 | 389.28 | |
| Monthly R2 | 17,140.88 | 324.79 |
Support this site! Clicking any of the books (below) takes you to
Amazon.com If you buy ANYTHING while there, they pay for the referral.
Legal notice for paid links: "As an Amazon Associate I earn from qualifying purchases."
|
My Stock Market Books
|
My Novels
|

