
As of 05/16/2024
Indus: 39,869 -38.62 -0.1%
Trans: 15,561 -20.59 -0.1%
Utils: 950 +0.34 +0.0%
Nasdaq: 16,698 -44.07 -0.3%
S&P 500: 5,297 -11.05 -0.2%
|
YTD
+5.8%
-2.1%
+7.7%
+11.2%
+11.1%
|
|
As of 05/16/2024
Indus: 39,869 -38.62 -0.1%
Trans: 15,561 -20.59 -0.1%
Utils: 950 +0.34 +0.0%
Nasdaq: 16,698 -44.07 -0.3%
S&P 500: 5,297 -11.05 -0.2%
|
YTD
+5.8%
-2.1%
+7.7%
+11.2%
+11.1%
| |
|
| ||
$ $ $
Here's a symbol list of 141 chart and candlestick patterns (13 "investment grade" candle patterns) found in today's securities using my version of Patternz: DDD, MMM, ABM, ACIW, ADTN, AMD, APD, ALGT, AEO, AXP, AFG, AMWD, ANIK, APOG, ARCB, ACGL, ARW, ASH, AGO, BSET, BAX, BKNG, BFH, BRKR, BBW, CACI, CNC, CI, CSCO, CNO, CGNX, CMTL, CONN, CSGP, CR, CROX, CSGS, CMI, DECK, DVN, DDS, DFS, EBAY, EQT, EXC, FLEX, FTNT, GME, GMS, GOOGL, GPRO, GES, HBI, THG, HQY, HSII, HELE, HP, HSIC, HUM, IBP, INTC, TILE, KBH, KEYS, LAMR, L, MGY, MAN, MCHX, MLM, MA, MTRN, MTRX, MGEE, MOS, MLI, MUR, MYGN, NWL, JWN, OMCL, PKG, PEN, PRFT, PCG, POR, PFG, PGR, DGX, RMBS, REGN, RGS, RNG, RCKY, ROG, SMG, SEE, SCI, STR, SWX, SWN, SXI, TGT, TPX, UNH, UNM, VFC, VMC, WLK, WMB, ZBRA, DDM, FXI, QQQ, IEV, ILF, EWA, EWJ, EPP, EWS, EWD, PHO, XLP, XLV, XLK, UNG, USO, VAW, MGK. Click this link for details (pattern type, start and end dates).
For a list of small patterns (those a few days wide) click this link.
$ $ $
You can find setups based on a Fibonacci retrace by clicking on the link.
The following patterns were found manually, not using Patternz. Mr. Bulkowski has excluded any securities he owns from appearing in the list. However, he may add any of the securities listed to his portfolio at any time, just as you can.
In the table below, the red and green colors are based on the historical breakout direction for the associated chart pattern. If a high and tight flag appears, the start and end dates highlight the flagpole only and not the flag.
For details about the chart patterns, click here.
-- Thomas Bulkowski, author: Invest for Two-Comma Wealth and Training "Miles" (#Ad) ![]()
![]()
| Symbol | Chart Pattern | Bullish Bearish | Start | End | Industry |
| AMD | Head-and-shoulders bottom | 04/19/2024 | 05/14/2024 | Semiconductor | |
| AFL | Pipe bottom | 04/08/2024 | 04/15/2024 | Insurance (Diversified) | |
| A | Pipe bottom | 04/15/2024 | 04/22/2024 | Precision Instrument | |
| AA | Double Bottom, Adam and Adam | 04/18/2024 | 05/01/2024 | Aerospace/Defense | |
| BIO | Triple bottom | 04/18/2024 | 05/09/2024 | Medical Supplies | |
| CF | Double Bottom, Adam and Adam | 05/02/2024 | 05/08/2024 | Chemical (Basic) | |
| CMTL | Double Bottom, Adam and Eve | 04/23/2024 | 05/09/2024 | Telecom. Equipment | |
| COST | Double Bottom, Adam and Adam | 04/03/2024 | 04/19/2024 | Retail Store | |
| CROX | Three Rising Valleys | 04/17/2024 | 05/01/2024 | Shoe | |
| DHR | Ugly double bottom | 04/18/2024 | 05/02/2024 | Medical Services | |
| FIVN | Double Top, Eve and Adam | 04/24/2024 | 05/03/2024 | Computer Software and Svcs | |
| FLEX | Roof, inverted | 04/04/2024 | 05/15/2024 | Electronics | |
| GD | Diamond bottom | 04/15/2024 | 05/02/2024 | Aerospace/Defense | |
| HE | Ugly double bottom | 04/16/2024 | 04/26/2024 | Electric Utility (West) | |
| HSIC | Pipe bottom | 04/29/2024 | 05/06/2024 | Medical Supplies | |
| HOV | Double Bottom, Adam and Eve | 03/18/2024 | 04/19/2024 | Homebuilding | |
| HUBG | Double Bottom, Eve and Adam | 04/18/2024 | 04/26/2024 | Trucking/Transp. Leasing | |
| HUM | Double Bottom, Adam and Eve | 04/02/2024 | 05/01/2024 | Medical Services | |
| INCY | Pipe bottom | 04/22/2024 | 04/29/2024 | Drug | |
| INTC | Double Bottom, Eve and Eve | 05/01/2024 | 05/08/2024 | Semiconductor | |
| IPAR | Double Bottom, Eve and Adam | 05/01/2024 | 05/08/2024 | Toiletries/Cosmetics | |
| IPG | Big W | 04/16/2024 | 05/02/2024 | Advertising | |
| INTU | Triangle, symmetrical | 04/19/2024 | 05/14/2024 | Computer Software and Svcs | |
| KSS | Ugly double bottom | 04/18/2024 | 05/01/2024 | Retail Store | |
| LRCX | Double Bottom, Eve and Adam | 04/22/2024 | 05/02/2024 | Semiconductor Cap Equip. | |
| MAN | Ugly double bottom | 04/16/2024 | 05/01/2024 | Human Resources | |
| MRK | Triangle, symmetrical | 03/27/2024 | 05/16/2024 | Drug | |
| NOC | Double Top, Adam and Adam | 04/25/2024 | 05/01/2024 | Aerospace/Defense | |
| NWPX | Pennant | 05/09/2024 | 05/15/2024 | Building Materials | |
| NUS | Double Bottom, Eve and Adam | 04/15/2024 | 04/30/2024 | Toiletries/Cosmetics | |
| NVDA | Pipe bottom | 04/15/2024 | 04/22/2024 | Semiconductor | |
| PAYX | Double Bottom, Adam and Adam | 04/18/2024 | 05/02/2024 | IT Services | |
| RMBS | Head-and-shoulders bottom | 04/19/2024 | 05/09/2024 | Semiconductor Cap Equip. | |
| RHI | Head-and-shoulders bottom | 04/17/2024 | 05/08/2024 | Human Resources | |
| SAIA | Triangle, symmetrical | 05/02/2024 | 05/16/2024 | Trucking/Transp. Leasing | |
| SXI | Broadening bottom | 04/10/2024 | 05/06/2024 | Diversified Co. | |
| SUM | Triple bottom | 04/19/2024 | 05/02/2024 | Cement and Aggregates | |
| TFX | Double Bottom, Eve and Adam | 05/02/2024 | 05/08/2024 | Diversified Co. | |
| TTD | Double Bottom, Eve and Adam | 03/15/2024 | 04/22/2024 | Advertising | |
| TMO | Ugly double bottom | 04/18/2024 | 05/07/2024 | Precision Instrument | |
| TREX | Diamond bottom | 04/18/2024 | 05/16/2024 | Building Materials | |
| UNH | Ugly double bottom | 04/12/2024 | 05/01/2024 | Medical Services | |
| VMC | Double Bottom, Adam and Adam | 04/19/2024 | 04/25/2024 | Cement and Aggregates | |
| WAT | Pipe bottom | 04/15/2024 | 04/22/2024 | Precision Instrument | |
| FDN | Double Bottom, Adam and Adam | 04/19/2024 | 04/25/2024 | Internet | |
| SOXX | Pipe bottom | 04/15/2024 | 04/22/2024 | Semiconductor | |
| IHI | Roof, inverted | 04/24/2024 | 05/10/2024 | Medical Supplies |
![]()
Since I post this the night before, check how the futures are trading before market open. Large moves can affect the opening direction.
$ $ $
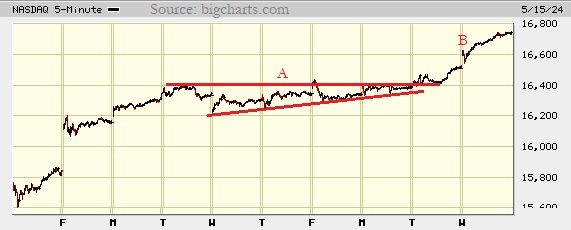
I show a picture of the Nasdaq composite on the 5-minute scale.
At first glance, there wasn't a lot going on in this picture. However, after gluing on a few trendlines, a chart pattern emerges.
At A, an ascending triangle appears. Those have horizontal tops and up-sloping bottoms. They can break out in either direction, but is upward 63% of the time.
An upward breakout happened here. At B, the index gapped open higher, perhaps on favorable news about inflation. I think it looks good for additional rises, especially after going horizontal for a week.
$ $ $
I updated the 10-year forecast for the Dow industrials, Nasdaq composite, and S&P 500. click the link to see the pictures.
$ $ $
Here's a symbol list of 216 chart and candlestick patterns (13 "investment grade" candle patterns) found in today's securities using my version of Patternz: DDD, ADTN, AEIS, AES, A, ALB, ALGT, DOX, AMED, AEE, AEO, AME, AMGN, APH, ANIK, AMAT, ARCB, ANET, BALL, BSET, BECN, BZH, BERY, BBY, BIO, BIIB, BOOT, BMY, BRKR, BLDR, BG, CBT, CI, CONN, CROX, CCK, CMI, DECK, DVN, FANG, DDS, EXP, EBAY, EFX, EXC, EXPI, FICO, FIS, FE, FLS, FORM, FTNT, GME, GIS, GPN, GMS, GPRO, GES, THG, HELE, HP, HSIC, DHI, HOV, IDXX, IBP, ITGR, IPAR, TILE, INTU, IRM, JBLU, KBH, KMT, KEYS, KLAC, LEN, LLY, LMT, MHO, MGY, MAN, MKTX, MAS, MA, MTRN, MGEE, MU, MLI, MUR, MYGN, NBR, ^IXIC, NWL, NEE, NI, JWN, NOC, NOVT, NUS, OXY, OMCL, OR, PYPL, PEN, PCG, PPL, PEG, PHM, QCOM, REGN, RGS, ^GSPC, CRM, SBH, SLB, SCHW, SMG, SEIC, STR, SKX, SMAR, SWX, SWN, SR, SUM, SNPS, TRGP, TDY, TFX, TER, TXN, TKR, TOL, TZOO, TG, UHAL, UNH, VLO, VECO, MDRX, V, VMC, WLK, WMB, IAI, IHE, IDU, DDM, FTEC, QTEC, FXL, QQQ, ICF, IYH, IAT, IEV, IGV, MXI, IXN, SOXX, SLV, IEO, IYF, ITB, EWK, EEM, EWG, EIS, EWI, EWM, EWW, EZA, EWY, EWP, EWD, EWL, EWT, EWU, QLD, IBB, PBE, PHO, SSO, XLF, XLV, XHB, XLB, SPY, XLK, XLU, USO, SMH, VHT, VAW, MGK, VONG. Click this link for details (pattern type, start and end dates).
For a list of small patterns (those a few days wide) click this link.
$ $ $
The following table shows where Fibonacci retrace values of the day's high-low range are plus pivot points, calculated on the Nasdaq composite, sorted by value. When several are near each other (small differences), the area might act as support or resistance.
-- Thomas Bulkowski, author: Invest for Two-Comma Wealth and Training "Miles" (#Ad) ![]()
![]()
| © 2024 ThePatternSite.com Metric | Value | Diff | Close (within 10% of the high-low range for the day)? |
| Monthly S2 | 14,901.44 | ||
| Monthly S1 | 15,821.91 | 920.48 | |
| Monthly Pivot | 16,143.26 | 321.34 | |
| Weekly S2 | 16,219.68 | 76.43 | |
| Weekly Pivot | 16,459.21 | 239.53 | |
| Daily S2 | 16,473.09 | 13.88 | Yes! The Daily S2 is close to the Weekly Pivot. |
| Weekly S1 | 16,481.04 | 7.95 | Yes! The Weekly S1 is close to the Daily S2. |
| Low | 16,544.09 | 63.05 | |
| Open | 16,601.14 | 57.05 | |
| Daily S1 | 16,607.74 | 6.60 | Yes! The Daily S1 is close to the Open. |
| 61.8% Down from Intraday High | 16,622.65 | 14.91 | Yes! The 61.8% Down from Intraday High is close to the Daily S1. |
| 50% Down from Intraday High | 16,646.91 | 24.27 | |
| 38.2% Down from Intraday High | 16,671.18 | 24.27 | |
| Daily Pivot | 16,678.74 | 7.56 | Yes! The Daily Pivot is close to the 38.2% Down from Intraday High. |
| Weekly R2 | 16,698.74 | 20.00 | Yes! The Weekly R2 is close to the Daily Pivot. |
| Weekly R1 | 16,720.57 | 21.82 | |
| Close | 16,742.39 | 21.82 | |
| High | 16,749.74 | 7.35 | Yes! The High is close to the Close. |
| Daily R1 | 16,813.39 | 63.65 | |
| Daily R2 | 16,884.39 | 71.00 | |
| Monthly R1 | 17,063.73 | 179.34 | |
| Monthly R2 | 17,385.08 | 321.34 |
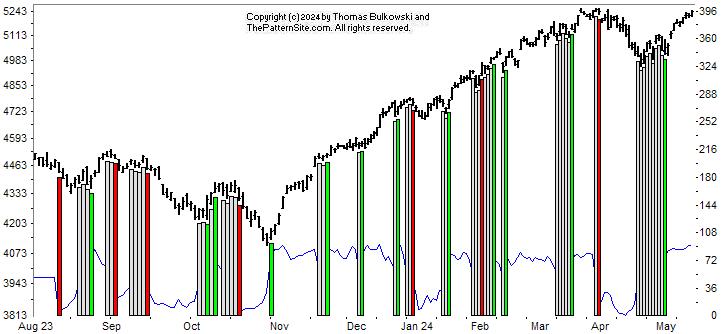
This is a picture of the chart pattern indicator on the daily scale. The indicator is the line chart below a chart of the S&P 500 composite.
The bullish signal is still in place, just as it has been for a few weeks now. The vertical green bar (far right of the chart) shows this.
Based on this chart of the S&P, I expect overhead resistance to stop the upward advance. However, it could power through that resistance to post new highs. That's what the CPI is saying (new high coming).
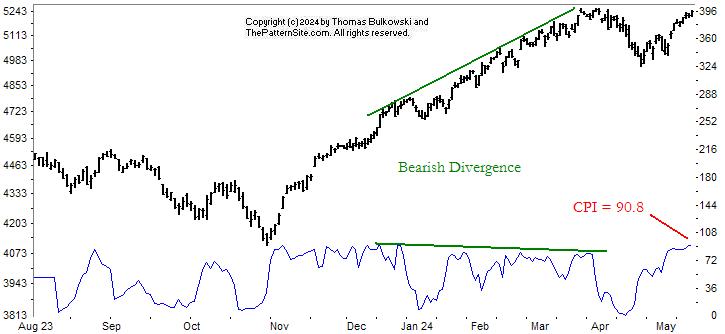
Here's another view of the indicator. I mentioned this last week, that the indicator has been making lower highs even as the index makes new highs. That's bearish divergence.
I show that with the two green lines. Of course, the divergence has ended with the March peak...
The CPI has a max value of 100 and it's at 90.8 now. Last week, it was at 94, so we're seeing a softening of the upward push. To me, that signals a warning, but not a guarantee, of a coming retrace.
$ $ $
Here's a symbol list of 158 chart and candlestick patterns (13 "investment grade" candle patterns) found in today's securities using my version of Patternz: ABT, ANF, AMD, AFL, ALGT, ALL, DOX, AMED, ANIK, AR, ADM, ANET, AIZ, ATO, ADP, AVNT, BBY, BIG, BIO, BAH, BMY, BRKR, BG, CDNS, CLS, CENX, CDAY, CF, CTAS, CNA, CNX, CMCO, CMTL, CONN, CXW, CTS, DECK, DVN, ^DJT, D, DUK, EBAY, ELV, EVRG, FAST, FDX, FIVN, FMC, FWRD, GME, GPRO, HBI, THG, HSII, HSIC, HNI, JBHT, IDA, NSP, IBP, IIIN, PODD, TILE, IPG, JKHY, KMT, KLAC, LANC, LLY, LMT, MHO, MGY, MANH, MAN, MCHX, MA, MTRN, MRK, MGEE, MUR, ^IXIC, NWL, NOC, NVDA, OMCL, OMI, OXM, PKE, PDCO, PETS, POR, PG, PHM, PSTG, RRC, RTX, RHI, ^GSPC, SAIA, SAND, SLB, SEIC, STR, SCCO, SR, TPR, TFX, UPS, UNH, VLO, V, VMC, WMT, WU, WMB, XEL, FTEC, BOTZ, QQQ, IGV, IXN, SOXX, EWO, EWK, EWZ, ECH, EWQ, EIS, EWI, EWS, EZA, EWP, EWD, EWT, THD, QLD, PBE, PJP, GLD, XLK, SMH, MGK, VONG. Click this link for details (pattern type, start and end dates).
For a list of small patterns (those a few days wide) click this link.
-- Thomas Bulkowski, author: Invest for Two-Comma Wealth and Training "Miles" (#Ad) ![]()
![]()
$ $ $
I show another slider trading quiz featuring horn tops.
$ $ $
Here's a symbol list of 182 chart and candlestick patterns (13 "investment grade" candle patterns) found in today's securities using my version of Patternz: ABT, ACN, ADTN, ALKS, ALL, AMED, AEO, AXP, AFG, AMWD, APA, APOG, ADM, AWI, ARW, ASH, AIZ, ATO, ADSK, BCPC, BAX, BA, BAH, BRC, BG, CDNS, COR, CDAY, CINF, CTAS, CSCO, CLF, CLX, CNA, CNO, CTSH, CMCO, CXW, COST, CMI, DVN, FANG, DFS, DSGR, ^DJI, EXP, WIRE, EVH, FICO, FAST, FIS, FE, FMC, GME, GPRO, GFF, HBI, THG, HLIT, HSY, HON, DHI, HWM, HUM, JBHT, HURC, INCY, NSP, IBP, IIIN, PODD, TILE, IPG, INTU, ISRG, IRM, JKHY, JBLU, KALU, KEYS, LZB, LH, LRCX, LANC, LDOS, MGY, MANH, MAS, MA, MTDR, MTRN, MDT, MLI, MYGN, NFG, NOV, JWN, NUS, OXY, ORI, OMC, ASGN, PKE, PEN, PETS, PLXS, PG, PGR, PRU, PEG, PHM, QTWO, RRC, RTX, RLI, ROK, ROP, RGLD, R, SAND, SCHW, SEE, SEIC, SMTC, SWN, SXI, TDY, TPX, TOL, TDG, TZOO, TG, UPS, MDRX, VRTX, V, VMC, WMT, WU, WLK, WSC, WWW, WWD, FDN, FXI, IYZ, IYF, ITB, EWK, EEM, EWG, EWH, EWM, EWW, EWL, TUR, PHO, XLF, XLV, XLB, XRT, VAW. Click this link for details (pattern type, start and end dates).
For a list of small patterns (those a few days wide) click this link.
$ $ $
The following table shows where Fibonacci retrace values of the day's high-low range are plus pivot points, calculated on the Dow industrials, sorted by value. When several are near each other (small differences), the area might act as support or resistance.
-- Thomas Bulkowski, author: Invest for Two-Comma Wealth and Training "Miles" (#Ad) ![]()
![]()
| © 2024 ThePatternSite.com Metric | Value | Diff | Close (within 10% of the high-low range for the day)? |
| Monthly S2 | 36,906.00 | ||
| Monthly S1 | 38,168.75 | 1,262.76 | |
| Weekly S2 | 38,343.09 | 174.34 | |
| Monthly Pivot | 38,874.32 | 531.23 | |
| Weekly S1 | 38,887.30 | 12.98 | Yes! The Weekly S1 is close to the Monthly Pivot. |
| Weekly Pivot | 39,233.59 | 346.29 | |
| Daily S2 | 39,249.64 | 16.05 | Yes! The Daily S2 is close to the Weekly Pivot. |
| Daily S1 | 39,340.58 | 90.93 | |
| Low | 39,403.05 | 62.47 | |
| Close | 39,431.51 | 28.46 | |
| Daily Pivot | 39,493.98 | 62.47 | |
| 61.8% Down from Intraday High | 39,496.39 | 2.40 | Yes! The 61.8% Down from Intraday High is close to the Daily Pivot. |
| 50% Down from Intraday High | 39,525.22 | 28.83 | |
| 38.2% Down from Intraday High | 39,554.05 | 28.83 | |
| Daily R1 | 39,584.92 | 30.87 | |
| Open | 39,591.28 | 6.36 | Yes! The Open is close to the Daily R1. |
| High | 39,647.39 | 56.11 | |
| Daily R2 | 39,738.32 | 90.93 | |
| Weekly R1 | 39,777.80 | 39.48 | |
| Weekly R2 | 40,124.09 | 346.29 | |
| Monthly R1 | 40,137.07 | 12.98 | Yes! The Monthly R1 is close to the Weekly R2. |
| Monthly R2 | 40,842.64 | 705.56 |
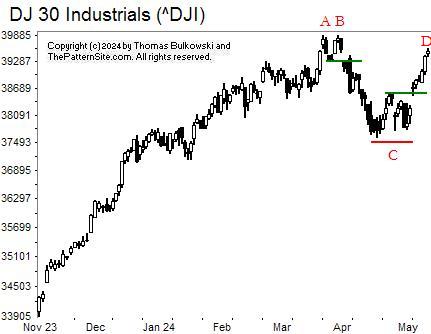
At AB is a chart pattern called a double top. It confirms as a valid chart pattern when the index closes below the horizontal green line.
At C, we see another chart pattern and another green line. The pattern is a weird looking triple bottom. The three valleys should bottom near the same price, but in this case, they don't.
A close above the nearby green line confirms the chart pattern as valid and signals an upward move, which sees price rise to D.
At D, we see the index getting near the price level of peaks A and B. That's important because it signals overhead resistance is coming. That could stop the upward move (and my guess is it will).
$ $ $
I released a new version of Patternz. It has a button on the Chart form where you can get more detail about a found chart pattern.
$ $ $

I had one reader of my Training "Miles" book (pictured on the right) write, "It did not disappoint. I read the entire book in one sitting." -- DJB
$ $ $
![]()
The following is a brief review of how the markets performed over time. The numbers refer to the close-to-close move in the Dow industrials.
Many options expire this week, so traders will be looking to close out their positions, and that suggests increased volatility (large daily price swings).
![]()
The following is based on an SFO article in December 2004 by John Seekinger, titled, "Take a two-dimensional approach." He offers these tips.
| Index | S2 | S1 | Pivot | R1 | R2 |
| Dow Industrials (^DJI): Daily | 39,326 | 39,419 | 39,500 | 39,593 | 39,673 |
| Weekly | 38,370 | 38,942 | 39,261 | 39,832 | 40,151 |
| Monthly | 36,933 | 38,223 | 38,901 | 40,191 | 40,870 |
| S&P500 (^GSPC): Daily | 5,194 | 5,208 | 5,224 | 5,238 | 5,254 |
| Weekly | 5,104 | 5,164 | 5,202 | 5,261 | 5,299 |
| Monthly | 4,853 | 5,038 | 5,139 | 5,324 | 5,425 |
| Nasdaq (^IXIC): Daily | 16,213 | 16,277 | 16,357 | 16,421 | 16,501 |
| Weekly | 16,086 | 16,213 | 16,325 | 16,453 | 16,565 |
| Monthly | 14,768 | 15,554 | 16,009 | 16,796 | 17,251 |
Here are the formulas:
![]()
Earnings season is either underway or should be starting soon. The sessions could be more volatile.
Here's a symbol list of 172 chart and candlestick patterns (13 "investment grade" candle patterns) found in today's securities using my version of Patternz: MMM, ABM, ADTN, AFL, AKAM, ALB, AMED, AXP, AFG, AR, APA, AMAT, ATR, ACGL, ANET, AIZ, ATO, ADSK, AVY, BCPC, BZH, BA, BOOT, BAH, BRC, BMY, BBW, CALM, CAL, CE, CRL, CHKP, CINF, CTAS, CLX, CNO, CNX, CONN, CRH, CMI, DVN, FANG, ^DJI, DRQ, DTE, EOG, EVH, FICO, FE, FLS, FRD, GME, GIS, GPN, GPRO, GFF, GES, HBI, HLIT, HIG, HE, HAYN, HQY, HELE, HSY, HOV, HWM, INCY, PODD, INTC, IPAR, IPI, JAZZ, KALU, KMT, KEYS, LH, MGY, MRO, MTDR, MRCY, MU, MOS, MUR, ^IXIC, NFG, NOV, NWL, NI, OXY, OLN, OMC, ON, PYPL, PETS, PPG, PEG, QTWO, KWR, DGX, RRC, RGA, RES, SAND, SIGI, STR, SWX, SWN, SCS, TPX, TTD, TDG, TZOO, UHAL, SLCA, UIS, VFC, VLO, V, VMC, WAT, WOLF, WWD, ITA, IYM, IHE, FXI, QQQ, IYH, IEV, MXI, ILF, IEO, IYF, EWO, EWK, EWC, EEM, EWG, EWH, EWI, EWM, EPP, EZA, EWY, EWP, EWD, EWL, EWT, TUR, EWU, PBE, PHO, XLF, XLV, XLB, USO, SMH, VAW, MGK. Click this link for details (pattern type, start and end dates).
For a list of small patterns (those a few days wide) click this link.
The below industries were the best (rank 1) or worst performing of those I follow.
|
-- Thomas Bulkowski, author: Invest for Two-Comma Wealth and Training "Miles" (#Ad) ![]()
![]()
$ $ $
Here's a symbol list of 132 chart and candlestick patterns (13 "investment grade" candle patterns) found in today's securities using my version of Patternz: AXDX, ADTN, AFL, ATSG, AEE, AFG, AAPL, ATR, ARW, ADSK, BCPC, BSET, BBY, BKH, BCO, BRKR, BBW, BLDR, CACI, CALM, CPB, CE, CLS, COR, CRL, CHKP, CINF, CTAS, CNO, CGNX, CMTL, CONN, CXW, DUK, BOOM, WIRE, EPAM, EQT, EXC, FDS, FDX, FWRD, FRD, GME, GNW, GILD, HIG, HQY, HELE, HUBG, ITW, INCY, INFN, IPG, INTU, K, KMT, KFRC, LHX, LZB, LAMR, LEG, LMT, LOW, MGEE, NFG, NEE, NWPX, NOVT, NTNX, NVDA, OMCL, PKE, PTEN, POR, PG, DGX, RL, RRC, ROP, ROST, SAND, SMTC, SHOP, STR, SCCO, SWX, SWN, TRV, TZOO, UIS, UPS, UNH, UNM, VRTX, V, WRB, WU, WPM, WDAY, XEL, IYE, FXL, IHF, IEV, IXC, MXI, SLV, IGE, IHI, EWA, EWO, EWK, EWQ, EWG, EWI, EWD, EWL, PXJ, PJP, XLE, XLB, VIS, VAW. Click this link for details (pattern type, start and end dates).
For a list of small patterns (those a few days wide) click this link.
$ $ $
You can find setups based on a Fibonacci retrace by clicking on the link.
The following patterns were found manually, not using Patternz. Mr. Bulkowski has excluded any securities he owns from appearing in the list. However, he may add any of the securities listed to his portfolio at any time, just as you can.
In the table below, the red and green colors are based on the historical breakout direction for the associated chart pattern. If a high and tight flag appears, the start and end dates highlight the flagpole only and not the flag.
For details about the chart patterns, click here.
-- Thomas Bulkowski, author: Invest for Two-Comma Wealth and Training "Miles" (#Ad) ![]()
![]()
| Symbol | Chart Pattern | Bullish Bearish | Start | End | Industry |
| DDD | Big W | 04/18/2024 | 05/01/2024 | Electronics | |
| AYI | Double Bottom, Adam and Adam | 04/19/2024 | 05/02/2024 | Furn/Home Furnishings | |
| ADBE | Triple bottom | 04/22/2024 | 05/01/2024 | Computer Software and Svcs | |
| AEIS | Double Bottom, Adam and Adam | 04/19/2024 | 05/02/2024 | Semiconductor | |
| ALB | Pipe bottom | 04/15/2024 | 04/22/2024 | Chemical (Diversified) | |
| ALKS | Diamond bottom | 04/17/2024 | 05/09/2024 | Drug | |
| AGO | Double Bottom, Eve and Eve | 04/18/2024 | 05/01/2024 | Insurance (Life) | |
| BCPC | Pipe bottom | 04/22/2024 | 04/29/2024 | Chemical (Specialty) | |
| BLDR | Dead-cat bounce | 05/07/2024 | 05/07/2024 | Retail Building Supply | |
| CBT | Triple bottom | 04/19/2024 | 04/30/2024 | Chemical (Diversified) | |
| CNC | Double Bottom, Adam and Adam | 04/12/2024 | 05/01/2024 | Medical Services | |
| CIEN | Pipe bottom | 04/15/2024 | 04/22/2024 | Telecom. Equipment | |
| CGNX | Pipe bottom | 04/15/2024 | 04/22/2024 | Precision Instrument | |
| COTY | Double Top, Adam and Adam | 04/23/2024 | 05/06/2024 | Toiletries/Cosmetics | |
| DECK | Triple bottom | 04/10/2024 | 04/25/2024 | Shoe | |
| EXP | Pipe bottom | 04/15/2024 | 04/22/2024 | Cement and Aggregates | |
| EME | Pipe bottom | 04/15/2024 | 04/22/2024 | Industrial Services | |
| EPAM | Dead-cat bounce | 05/09/2024 | 05/09/2024 | IT Services | |
| EG | Double Bottom, Adam and Adam | 04/17/2024 | 04/30/2024 | Insurance (Prop/Casualty) | |
| FORM | Pipe bottom | 04/15/2024 | 04/22/2024 | Semiconductor | |
| FWRD | Dead-cat bounce | 05/09/2024 | 05/09/2024 | Trucking/Transp. Leasing | |
| GPS | Double Bottom, Adam and Adam | 04/25/2024 | 05/01/2024 | Apparel | |
| HSII | Triple bottom | 04/19/2024 | 05/08/2024 | Human Resources | |
| HNI | Double Bottom, Eve and Eve | 04/16/2024 | 04/29/2024 | Furn/Home Furnishings | |
| HD | Head-and-shoulders bottom | 04/18/2024 | 05/01/2024 | Retail Building Supply | |
| HON | Double Bottom, Eve and Adam | 04/17/2024 | 04/26/2024 | Aerospace/Defense | |
| HOV | Pipe bottom | 04/15/2024 | 04/22/2024 | Homebuilding | |
| IDXX | Diamond bottom | 04/19/2024 | 05/08/2024 | Drug | |
| IBP | Pipe bottom | 04/15/2024 | 04/22/2024 | Retail Building Supply | |
| IIIN | Diamond bottom | 04/16/2024 | 05/09/2024 | Building Materials | |
| KMT | Triple bottom | 03/19/2024 | 05/01/2024 | Metal Fabricating | |
| KEYS | Triple bottom | 04/22/2024 | 05/02/2024 | Precision Instrument | |
| KLAC | Pipe bottom | 04/15/2024 | 04/22/2024 | Semiconductor Cap Equip. | |
| KLIC | Double Bottom, Adam and Adam | 04/19/2024 | 05/01/2024 | Semiconductor Cap Equip. | |
| LZB | Double Bottom, Eve and Adam | 04/16/2024 | 05/01/2024 | Furn/Home Furnishings | |
| LOW | Double Bottom, Adam and Adam | 04/25/2024 | 05/01/2024 | Retail Building Supply | |
| MAS | Double Bottom, Adam and Eve | 04/25/2024 | 05/01/2024 | Building Materials | |
| MDT | Double Bottom, Adam and Adam | 04/18/2024 | 04/25/2024 | Medical Supplies | |
| MS | Pipe bottom | 04/08/2024 | 04/15/2024 | Securities Brokerage | |
| NFLX | Triple bottom | 04/22/2024 | 05/01/2024 | Internet | |
| ORI | Double Bottom, Adam and Adam | 04/17/2024 | 04/25/2024 | Insurance (Prop/Casualty) | |
| OLN | Double Bottom, Adam and Eve | 04/25/2024 | 05/02/2024 | Chemical (Basic) | |
| OTEX | Dead-cat bounce | 05/03/2024 | 05/03/2024 | E-Commerce | |
| OMI | Dead-cat bounce | 05/03/2024 | 05/03/2024 | Medical Supplies | |
| PHM | Pipe bottom | 04/15/2024 | 04/22/2024 | Homebuilding | |
| PSTG | Triple bottom | 04/19/2024 | 05/02/2024 | Computers and Peripherals | |
| QCOM | Pipe bottom | 04/15/2024 | 04/22/2024 | Telecom. Equipment | |
| RL | Triangle, symmetrical | 04/19/2024 | 05/09/2024 | Apparel | |
| ROL | Pipe bottom | 04/15/2024 | 04/22/2024 | Industrial Services | |
| R | Pipe bottom | 04/15/2024 | 04/22/2024 | Trucking/Transp. Leasing | |
| SEIC | Head-and-shoulders bottom | 04/19/2024 | 05/01/2024 | IT Services | |
| SMTC | Flag, high and tight | 03/20/2024 | 05/09/2024 | Semiconductor Cap Equip. | |
| SHW | Double Bottom, Adam and Eve | 04/23/2024 | 05/01/2024 | Chemical (Basic) | |
| SHOP | Dead-cat bounce | 05/08/2024 | 05/08/2024 | E-Commerce | |
| SNPS | Double Bottom, Eve and Adam | 04/19/2024 | 05/02/2024 | Computer Software and Svcs | |
| TER | Pipe bottom | 04/15/2024 | 04/22/2024 | Semiconductor Cap Equip. | |
| TTD | Pipe bottom | 04/15/2024 | 04/22/2024 | Advertising | |
| TOL | Pipe bottom | 04/15/2024 | 04/22/2024 | Homebuilding | |
| TWLO | Pipe bottom | 04/15/2024 | 04/22/2024 | E-Commerce | |
| VECO | Pipe bottom | 04/15/2024 | 04/22/2024 | Precision Instrument | |
| VRTX | Triple bottom | 04/18/2024 | 05/07/2024 | Biotechnology | |
| VC | Double Bottom, Adam and Adam | 04/18/2024 | 04/25/2024 | Electronics | |
| WMT | Double Bottom, Adam and Adam | 04/23/2024 | 05/02/2024 | Retail Store | |
| WSC | Double Bottom, Adam and Eve | 04/22/2024 | 05/01/2024 | Industrial Services | |
| IGV | Double Bottom, Adam and Adam | 04/19/2024 | 05/01/2024 | Computer Software and Svcs | |
| ITB | Diamond bottom | 04/16/2024 | 05/02/2024 | Homebuilding |
![]()
Since I post this the night before, check how the futures are trading before market open. Large moves can affect the opening direction.
$ $ $
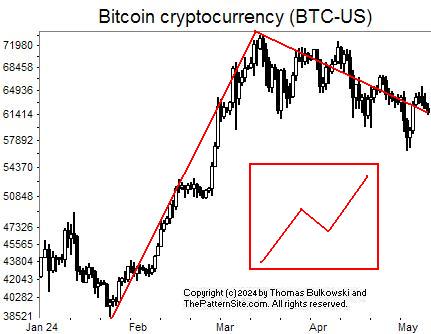
I show a picture of bitcon on the daily scale.
In cases like this, shown by the red line which follows price (not the inset), the security moves higher, retraces, and resumes the up move.
Now look at the inset (the boxed thing). This shows the pattern of what Elliott wavers call an simple ABC correction and those of us in the pattern world call a measured move up.
You can also call this (the currency's move, not the inset) a triple top (the three tallest peaks on the chart), but the downward move has been lackluster. So maybe we'll see the second leg of the measured move up pattern.
What does that mean? If the currency behaves as the pattern predicts, then look for a second straight-line run up. Based on how long the retrace has lasted, I'd expect the up move to begin soon.
$ $ $
Here's a symbol list of 132 chart and candlestick patterns (13 "investment grade" candle patterns) found in today's securities using my version of Patternz: ABM, AXDX, ADTN, AES, AKAM, AMED, AXP, AMWD, AMGN, APH, AON, ARW, AGO, ADSK, BMI, BCPC, BA, BR, CPB, CLS, CX, COR, CINF, CTAS, CLF, CL, CMCO, CMTL, GLW, COTY, XRAY, DDS, DOV, XOM, FFIV, FAST, GIS, GILD, GS, GPRO, GFF, GES, HQY, HSII, HNI, HUBG, ILMN, INCY, INFN, INTC, IBKR, TILE, INTU, KLAC, KSS, LZB, LRCX, LEG, LNC, LPLA, MHO, MCHX, MTRN, MRCY, MGEE, MCO, MYGN, NTAP, NEE, NOC, NUS, NTNX, OXY, OR, OUT, PYPL, PETS, PNW, PGR, PEG, RRC, RGA, RCKY, SBH, SAND, SAIC, SEIC, SMTC, SHOP, SKX, LUV, SWX, SWN, SXI, TFX, TER, TZOO, SLCA, UIS, UPS, VMI, WU, DDM, FXL, FXI, IAT, IYZ, MXI, EWK, EEM, EWQ, EWJ, EPP, EWS, EZA, EWY, EWP, EWL, EWU, PPA, XHB, XAR, UNG, USO, VHT. Click this link for details (pattern type, start and end dates).
For a list of small patterns (those a few days wide) click this link.
$ $ $
The following table shows where Fibonacci retrace values of the day's high-low range are plus pivot points, calculated on the Nasdaq composite, sorted by value. When several are near each other (small differences), the area might act as support or resistance.
-- Thomas Bulkowski, author: Invest for Two-Comma Wealth and Training "Miles" (#Ad) ![]()
![]()
| © 2024 ThePatternSite.com Metric | Value | Diff | Close (within 10% of the high-low range for the day)? |
| Monthly S2 | 14,737.53 | ||
| Weekly S2 | 15,374.63 | 637.11 | |
| Monthly S1 | 15,520.14 | 145.51 | |
| Weekly S1 | 15,838.70 | 318.55 | |
| Monthly Pivot | 16,005.40 | 166.70 | |
| Weekly Pivot | 16,021.70 | 16.31 | |
| Daily S2 | 16,174.58 | 152.88 | |
| Low | 16,226.07 | 51.49 | |
| Open | 16,226.07 | 0.00 | Yes! The Open is close to the Low. |
| Daily S1 | 16,238.67 | 12.60 | |
| 61.8% Down from Intraday High | 16,270.22 | 31.55 | |
| 50% Down from Intraday High | 16,283.86 | 13.64 | |
| Daily Pivot | 16,290.16 | 6.30 | Yes! The Daily Pivot is close to the 50% Down from Intraday High. |
| 38.2% Down from Intraday High | 16,297.50 | 7.34 | Yes! The 38.2% Down from Intraday High is close to the Daily Pivot. |
| Close | 16,302.76 | 5.26 | Yes! The Close is close to the 38.2% Down from Intraday High. |
| High | 16,341.65 | 38.89 | |
| Daily R1 | 16,354.25 | 12.60 | |
| Daily R2 | 16,405.74 | 51.49 | |
| Weekly R1 | 16,485.77 | 80.03 | |
| Weekly R2 | 16,668.77 | 183.01 | |
| Monthly R1 | 16,788.01 | 119.24 | |
| Monthly R2 | 17,273.27 | 485.25 |
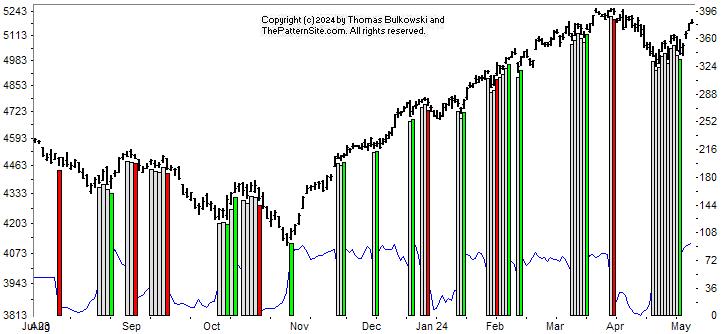
This is a picture of the chart pattern indicator on the daily scale. The indicator is the line chart below a chart of the S&P 500 composite.
As the chart shows, the most recent signal is bullish. That follows a string of neutral readings, which -- at one time -- I thought were an important bearish signal by themselves.
Maybe they say that the bullish transition is a reluctant one, that the bullish reading will struggle with overhead resistance soon.
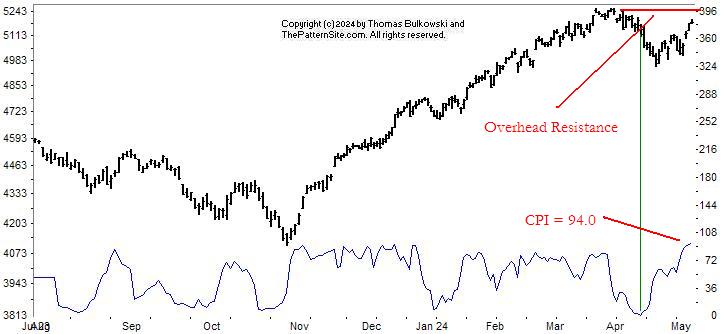
Here's the same chart with signals removed. I show the overhead resistance that I expect will cause some trouble in the near future.
The CPI is at 94 with 100 being the ceiling for the indicator. There's still room to grow, in other words. Having written that, the current signal is the highest the indicator has been since December 2023.
I'd urge caution adding to positions now. If we pierce that horizontal red line, then there's hope for additional gains. Otherwise, I expect the upward move to hit that resistance and collapse.
$ $ $
Here's a symbol list of 156 chart and candlestick patterns (13 "investment grade" candle patterns) found in today's securities using my version of Patternz: AXDX, ACN, ADTN, AES, ATSG, AA, ALGT, ALL, AMZN, AFG, AIG, AMWD, ADM, ADSK, AVNT, AXS, BCPC, BIIB, BA, BRC, BLDR, BG, CBT, CAL, CE, CINF, CTAS, CNO, CTSH, CMTL, CROX, DHR, DDS, DSGR, ^DJU, EMN, EVRG, EXPI, XOM, FAST, FIS, GNW, GFS, GOOGL, GES, HE, HSII, HUBG, HUM, IEX, ILMN, INCY, INFN, PODD, IBKR, JAZZ, KEYS, KSS, LRCX, LEG, LPLA, MHO, MKTX, MRK, MGEE, MU, MCO, ^IXIC, NTGR, NEU, NEE, NOC, NWPX, NOVT, OMCL, PFE, PINC, PFG, PGR, PRU, PEG, RRC, RJF, RGA, ROL, CRM, SCHW, SEIC, NOW, SLGN, SKX, SO, SWX, SWN, TDY, TPX, TER, TDG, TZOO, TWLO, VLO, V, WMT, WSO, WMB, WSM, WOLF, IYM, IAI, IHE, IDU, QQQ, IYH, IHF, IAT, IEV, MXI, IYF, EWA, EWO, EWK, EWQ, EWG, EWI, EWM, EWP, EWD, EWL, EWU, PHO, XLP, XLF, XLV, XHB, XLB, XLU, UNG, USO, VHT, VIS, VAW, MGK. Click this link for details (pattern type, start and end dates).
For a list of small patterns (those a few days wide) click this link.
-- Thomas Bulkowski, author: Invest for Two-Comma Wealth and Training "Miles" (#Ad) ![]()
![]()
$ $ $
I show another slider trading quiz featuring Rising wedge 1.
$ $ $
Here's a symbol list of 176 chart and candlestick patterns (13 "investment grade" candle patterns) found in today's securities using my version of Patternz: AYI, ADBE, AES, A, AKAM, ALB, AEO, AXP, AFG, AR, ATR, BCPC, BERY, BMRN, BA, BMY, BBW, BLDR, BG, CACI, CX, CHKP, CIEN, CTAS, CLF, CNA, CNO, CGNX, CMCO, CSGP, CRH, CCRN, CW, DECK, DSGR, DOV, DTE, EXP, EBAY, EME, WIRE, EQT, EVRG, FAST, FLS, FMC, FORM, FTNT, FNV, FDP, GD, GNW, GGG, THG, HIG, HE, HAYN, HL, HELE, HOV, HUM, HUN, IBP, IBKR, JBLU, KALU, KMT, KLAC, LZB, LH, LEG, L, MTSI, MGY, MCHX, MRK, MU, ^IXIC, NTAP, NEE, NWPX, NUS, NVDA, OMC, ON, OR, PKG, PYPL, PRFT, PFE, PRU, PHM, KWR, QCOM, DGX, REGN, RGA, RCKY, ROL, R, ^GSPC, SAND, SAIC, SEE, SMTC, SKX, SWN, SR, SRDX, TECH, TFX, TER, TTD, TMO, TOL, TWLO, UHAL, VECO, WAT, WSO, WWW, ZBRA, IAI, BOTZ, QQQ, IHF, IEV, MXI, ILF, SOXX, IYF, EWA, EWO, EWK, EWC, EWG, EIS, EWJ, EPP, EZA, EWY, EWD, EWT, PPA, DBA, PXJ, SSO, XLF, XLI, SPY, XAR, UNG, USO, SMH, VIS, VAW, MGK. Click this link for details (pattern type, start and end dates).
For a list of small patterns (those a few days wide) click this link.
$ $ $
The following table shows where Fibonacci retrace values of the day's high-low range are plus pivot points, calculated on the Dow industrials, sorted by value. When several are near each other (small differences), the area might act as support or resistance.
-- Thomas Bulkowski, author: Invest for Two-Comma Wealth and Training "Miles" (#Ad) ![]()
![]()
| © 2024 ThePatternSite.com Metric | Value | Diff | Close (within 10% of the high-low range for the day)? |
| Monthly S2 | 36,556.17 | ||
| Weekly S2 | 37,452.46 | 896.29 | |
| Monthly S1 | 37,704.22 | 251.75 | |
| Weekly S1 | 38,152.37 | 448.15 | |
| Weekly Pivot | 38,480.44 | 328.07 | |
| Daily S2 | 38,612.29 | 131.84 | |
| Low | 38,689.38 | 77.09 | |
| Daily S1 | 38,732.28 | 42.90 | |
| Monthly Pivot | 38,759.61 | 27.33 | |
| Open | 38,762.43 | 2.82 | Yes! The Open is close to the Monthly Pivot. |
| 61.8% Down from Intraday High | 38,764.67 | 2.24 | Yes! The 61.8% Down from Intraday High is close to the Open. |
| 50% Down from Intraday High | 38,787.93 | 23.26 | |
| Daily Pivot | 38,809.38 | 21.45 | |
| 38.2% Down from Intraday High | 38,811.18 | 1.80 | Yes! The 38.2% Down from Intraday High is close to the Daily Pivot. |
| Close | 38,852.27 | 41.09 | |
| High | 38,886.47 | 34.20 | |
| Daily R1 | 38,929.37 | 42.90 | |
| Daily R2 | 39,006.46 | 77.10 | |
| Weekly R1 | 39,180.35 | 173.88 | |
| Weekly R2 | 39,508.42 | 328.07 | |
| Monthly R1 | 39,907.66 | 399.24 | |
| Monthly R2 | 40,963.05 | 1,055.39 |
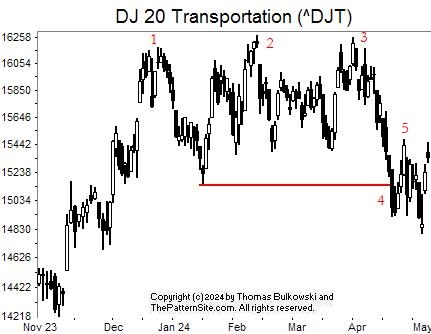
This is a chart of the Dow transports on the daily scale.
Notice the three peaks. I have numbered them for your viewing convenience. ![]()
It confirms as a valid triple top when the index closes below the red line, which happens at 4.
After confirmation, it means price is going down. However, it doesn't say for how long or how far. Indeed, we can see the index rebounding in the last three days.
See point 5? That's what's called a pullback, because price pulls back to the breakout price. In this case, it continued higher for a bit (to peak at 5) before turning back down.
Because the pullback has completed and price is now moving higher, I expect the drop from the triple top is over, but I could be wrong.
![]()
The following is a brief review of how the markets performed over time. The numbers refer to the close-to-close move in the Dow industrials.
No options expire this week.
![]()
The following is based on an SFO article in December 2004 by John Seekinger, titled, "Take a two-dimensional approach." He offers these tips.
| Index | S2 | S1 | Pivot | R1 | R2 |
| Dow Industrials (^DJI): Daily | 38,377 | 38,526 | 38,667 | 38,817 | 38,958 |
| Weekly | 37,394 | 38,035 | 38,422 | 39,063 | 39,450 |
| Monthly | 36,497 | 37,586 | 38,701 | 39,790 | 40,904 |
| S&P500 (^GSPC): Daily | 5,085 | 5,106 | 5,123 | 5,144 | 5,161 |
| Weekly | 4,965 | 5,046 | 5,093 | 5,174 | 5,221 |
| Monthly | 4,805 | 4,966 | 5,115 | 5,277 | 5,425 |
| Nasdaq (^IXIC): Daily | 16,007 | 16,082 | 16,143 | 16,218 | 16,279 |
| Weekly | 15,326 | 15,741 | 15,973 | 16,388 | 16,620 |
| Monthly | 14,689 | 15,423 | 15,957 | 16,690 | 17,224 |
Here are the formulas:
![]()
Earnings season is either underway or should be starting soon. The sessions could be more volatile.
Here's a symbol list of 203 chart and candlestick patterns (13 "investment grade" candle patterns) found in today's securities using my version of Patternz: ACIW, ADTN, AEIS, AES, A, ALB, AA, AMZN, AEO, AIG, AMGN, AMN, AAPL, AIZ, AVY, AVNT, AVA, AZTA, BAX, BMRN, BRKR, BBW, BLDR, CBT, CF, CHD, CIEN, CI, CNO, CGNX, CMCO, CAG, CSGP, CR, CROX, CSGS, CTS, XRAY, DSGR, ^DJT, ^DJI, EXP, EIX, EME, EVRG, EZPW, FDS, FICO, FLEX, FMC, FORM, FTNT, GD, GNW, GS, HBI, HLIT, HAYN, HQY, HSIC, HOV, IDXX, ILMN, INFN, IBP, PODD, IPI, ISRG, IRM, KBH, KMT, KLAC, KSS, LAMR, LEN, LLY, MTSI, MKTX, MTRN, MRK, MRCY, MGEE, MS, MOS, ^IXIC, NTGR, NEE, NVDA, OXY, ON, OTEX, OUT, OMI, PYPL, PINC, PHM, KWR, QCOM, RGA, RLI, ROL, ROST, RGLD, R, SAIA, SBH, SAND, SMG, SEE, SMTC, SCI, SWX, SRDX, TER, TTD, TMO, TOL, TREX, TWLO, UHAL, VECO, WAT, WERN, WLK, WWD, ZBRA, ITA, IYM, IAI, IYC, IYE, FDN, BOTZ, ICF, IAT, IYZ, IEV, ILF, SOXX, SLV, ITB, EWA, EWO, EWK, EWZ, ECH, EWG, EWJ, EWM, EPP, EZA, EWY, EWT, THD, EWU, IBB, DBA, PBE, PEJ, PXJ, PHO, ROBO, XLY, XLE, XLF, XLB, XAR, USO, SMH, VAW. Click this link for details (pattern type, start and end dates).
For a list of small patterns (those a few days wide) click this link.
The below industries were the best (rank 1) or worst performing of those I follow.
|
-- Thomas Bulkowski, author: Invest for Two-Comma Wealth and Training "Miles" (#Ad) ![]()
![]()
$ $ $
Here's a symbol list of 164 chart and candlestick patterns (13 "investment grade" candle patterns) found in today's securities using my version of Patternz: DDD, ABT, ADTN, AEIS, AES, A, AKAM, ALK, ALB, ALGT, ALL, AEE, AEO, AFG, AIG, AME, AON, APA, ARW, AVNT, AZTA, BAX, BZH, BERY, BIIB, BMY, BRKR, BLDR, CDAY, CF, CIEN, CI, CSCO, CLX, CGNX, CSGP, CCK, CSGS, XRAY, EXP, EBAY, ECL, EIX, EME, EZPW, FARO, FIS, FIVN, FORM, GPS, GNW, GPN, HLIT, HE, HP, HSIC, HOV, HWM, HUM, JBHT, IDXX, ILMN, INCY, IBP, TILE, IPI, IRM, K, KEYS, KLAC, LH, LLY, LNC, LMT, MTSI, M, MKTX, MA, MTRN, MTRX, MRK, META, MGEE, MCO, MYGN, NTGR, NTAP, NEE, NKE, NVDA, OXY, OLN, OMC, ON, OUT, PTEN, PAYX, PEG, PHM, QCOM, RTX, REGN, RGA, ROL, ROP, R, SBH, SMTC, SCI, TDC, TER, TTD, TMO, TOL, TRV, TWLO, UPS, VFC, VMI, VECO, MDRX, VRSN, V, WAT, WERN, WU, WOLF, WWW, ZBRA, ITA, IEZ, IHE, FXI, BOTZ, SOXX, SLV, EWO, EWK, EWZ, EWH, EWJ, EWM, EZA, TUR, DBA, PJP, XLF, USO, SMH. Click this link for details (pattern type, start and end dates).
For a list of small patterns (those a few days wide) click this link.
$ $ $
You can find setups based on a Fibonacci retrace by clicking on the link.
The following patterns were found manually, not using Patternz. Mr. Bulkowski has excluded any securities he owns from appearing in the list. However, he may add any of the securities listed to his portfolio at any time, just as you can.
In the table below, the red and green colors are based on the historical breakout direction for the associated chart pattern. If a high and tight flag appears, the start and end dates highlight the flagpole only and not the flag.
For details about the chart patterns, click here.
-- Thomas Bulkowski, author: Invest for Two-Comma Wealth and Training "Miles" (#Ad) ![]()
![]()
| Symbol | Chart Pattern | Bullish Bearish | Start | End | Industry |
| MMM | Triangle, symmetrical | 04/04/2024 | 04/29/2024 | Diversified Co. | |
| AES | Head-and-shoulders complex bottom | 02/13/2024 | 04/17/2024 | Electric Utility (East) | |
| APD | Triple bottom | 04/16/2024 | 04/30/2024 | Chemical (Diversified) | |
| AEO | Head-and-shoulders top | 03/21/2024 | 04/09/2024 | Apparel | |
| AMN | Triple bottom | 04/15/2024 | 04/25/2024 | Human Resources | |
| AXS | Double Bottom, Adam and Adam | 04/17/2024 | 04/26/2024 | Insurance (Prop/Casualty) | |
| BERY | Double Bottom, Eve and Adam | 04/16/2024 | 04/24/2024 | Packaging and Container | |
| BKNG | Triangle, descending | 03/15/2024 | 05/01/2024 | Internet | |
| CALM | Head-and-shoulders top | 03/22/2024 | 04/17/2024 | Food Processing | |
| CF | Double Top, Adam and Adam | 04/18/2024 | 04/29/2024 | Chemical (Basic) | |
| FANG | Double Top, Eve and Eve | 04/12/2024 | 04/26/2024 | Petroleum (Producing) | |
| ^DJI | Triangle, symmetrical | 04/17/2024 | 05/02/2024 | None | |
| EBAY | Broadening top, right-angled and descending | 03/14/2024 | 05/02/2024 | Internet | |
| EXPI | Ugly double bottom | 03/19/2024 | 04/10/2024 | E-Commerce | |
| EZPW | Double Top, Eve and Eve | 04/01/2024 | 04/24/2024 | Financial Services | |
| FLEX | Double Top, Adam and Adam | 04/04/2024 | 04/30/2024 | Electronics | |
| GME | Double Bottom, Adam and Adam | 04/16/2024 | 04/22/2024 | Retail (Special Lines) | |
| DHI | Diamond bottom | 04/19/2024 | 05/02/2024 | Homebuilding | |
| NSP | Double Top, Adam and Eve | 03/28/2024 | 04/23/2024 | Human Resources | |
| PODD | Double Bottom, Adam and Adam | 04/19/2024 | 04/25/2024 | Medical Supplies | |
| IPI | Triangle, symmetrical | 03/07/2024 | 05/02/2024 | Chemical (Diversified) | |
| JNJ | Double Bottom, Eve and Adam | 04/18/2024 | 04/30/2024 | Medical Supplies | |
| KALU | Double Bottom, Adam and Adam | 04/16/2024 | 04/25/2024 | Metals and Mining (Div.) | |
| LEG | Dead-cat bounce | 05/01/2024 | 05/01/2024 | Furn/Home Furnishings | |
| LEN | Diamond bottom | 04/16/2024 | 05/02/2024 | Homebuilding | |
| LLY | Multi-peaks | 02/08/2024 | 05/02/2024 | Drug | |
| RAMP | Pennant | 04/24/2024 | 05/02/2024 | Computer Software and Svcs | |
| LXU | Scallop, ascending | 04/04/2024 | 04/30/2024 | Building Materials | |
| MTDR | Head-and-shoulders complex top | 03/25/2024 | 04/24/2024 | Petroleum (Producing) | |
| MGEE | Double Bottom, Eve and Eve | 03/20/2024 | 04/16/2024 | Electric Utility (Central) | |
| NTGR | Head-and-shoulders top | 03/01/2024 | 05/01/2024 | Telecom. Equipment | |
| ON | Pipe bottom | 04/15/2024 | 04/22/2024 | Semiconductor | |
| OR | Double Top, Adam and Adam | 04/01/2024 | 04/12/2024 | Metals and Mining (Div.) | |
| OUT | Pipe bottom | 04/15/2024 | 04/22/2024 | Advertising | |
| PATK | Triple bottom | 04/18/2024 | 05/01/2024 | Retail Building Supply | |
| PFE | Double Bottom, Adam and Adam | 04/18/2024 | 04/26/2024 | Drug | |
| PCG | Triple bottom | 02/13/2024 | 04/16/2024 | Electric Utility (West) | |
| SAIA | Dead-cat bounce | 04/26/2024 | 04/26/2024 | Trucking/Transp. Leasing | |
| SLB | Double Top, Eve and Adam | 03/28/2024 | 04/08/2024 | Oilfield Svcs/Equipment | |
| SMTC | Pipe bottom | 04/15/2024 | 04/22/2024 | Semiconductor Cap Equip. | |
| SRDX | Triple bottom | 04/22/2024 | 04/30/2024 | Medical Supplies | |
| TECH | Double Bottom, Eve and Adam | 04/18/2024 | 04/25/2024 | Biotechnology | |
| TFX | Double Top, Adam and Adam | 04/23/2024 | 05/02/2024 | Diversified Co. | |
| TPX | Double Top, Eve and Eve | 03/13/2024 | 03/28/2024 | Furn/Home Furnishings | |
| TKR | Double Bottom, Eve and Adam | 04/16/2024 | 04/25/2024 | Metal Fabricating | |
| TG | Rectangle top | 03/27/2024 | 05/02/2024 | Chemical (Specialty) | |
| VMI | Double Bottom, Adam and Adam | 03/05/2024 | 05/01/2024 | Metal Fabricating | |
| VEEV | Diamond bottom | 04/18/2024 | 05/02/2024 | Healthcare Information | |
| WOLF | Dead-cat bounce | 05/02/2024 | 05/02/2024 | Semiconductor | |
| ZBRA | Pipe bottom | 04/15/2024 | 04/22/2024 | Computers and Peripherals | |
| IHI | Triangle, descending | 03/01/2024 | 04/11/2024 | Medical Supplies |
![]()
Since I post this the night before, check how the futures are trading before market open. Large moves can affect the opening direction.
$ $ $
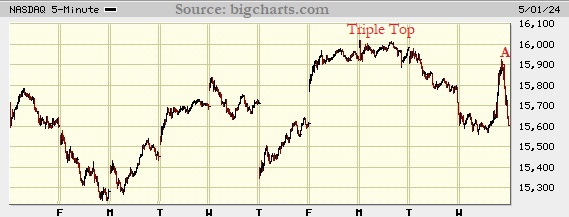
I show a picture of the Nasdaq composite on the 5-minute scale.
A triple top appeared earlier in the week. It's hard to see the three peaks on this chart, but I've identified their location. After the pattern confirmed (meaning price closed below the lowest valley between the three peaks), the Nasdaq dropped substantially.
Today (Wednesday), at A, the index responded to the FED meeting. It climbed to A and then plummeted. That's about 300 points in about a half hour. I'd like to suggest that the strength of the decline suggests price will gap open lower on Thursday or just continue down, but there could be a snap-back rally. I don't know which way it'll go.
$ $ $
Here's a symbol list of 191 chart and candlestick patterns (13 "investment grade" candle patterns) found in today's securities using my version of Patternz: ANF, AEIS, AMD, AES, AFL, A, ALB, ALGT, DOX, AEE, AEO, AEP, AFG, AMWD, APA, AMAT, ARCB, ANET, AWI, ASH, ADP, AVNT, AVA, AZTA, BZH, BFH, BLDR, CALM, COR, CENX, CDAY, CF, CIEN, CNX, CGNX, GLW, CSGP, CROX, CTS, DVN, DRQ, DUK, EXP, ECL, EIX, EME, EQT, EL, EVH, EXC, FIS, FE, FLEX, FORM, FTNT, FWRD, GPN, GFS, HE, HP, HSIC, HON, HOV, HUM, IDXX, ILMN, INFN, IBP, IPI, JKHY, JNJ, KMT, KLAC, LRCX, LEG, MTSI, M, MANH, MA, MTDR, MTRN, MRCY, MGEE, MUR, MYGN, NTGR, NTAP, NEE, NKE, NOVT, NTNX, NVDA, OXY, ON, OUT, OMI, PCG, PNW, PLXS, PPG, PRU, PHM, PSTG, QCOM, RGA, RCKY, ROL, R, SLB, SMG, SRE, SMTC, SHOP, SO, SWN, SNPS, TECH, TDY, TER, TTD, TMO, TOL, TZOO, TWLO, UIS, UNM, VFC, VECO, MDRX, V, VC, WAT, WU, WLK, WOLF, WDAY, ZBRA, IYC, IYE, FTEC, QTEC, FXL, FXI, BOTZ, IYH, MXI, ILF, SOXX, EWO, EWK, EWG, EWI, EWJ, EZA, EWP, EWL, EWT, QLD, DBA, PBE, PXJ, XLY, XLE, XLF, GLD, XLB, XRT, USO, SMH, VHT, VAW. Click this link for details (pattern type, start and end dates).
For a list of small patterns (those a few days wide) click this link.
$ $ $
The following table shows where Fibonacci retrace values of the day's high-low range are plus pivot points, calculated on the Nasdaq composite, sorted by value. When several are near each other (small differences), the area might act as support or resistance.
-- Thomas Bulkowski, author: Invest for Two-Comma Wealth and Training "Miles" (#Ad) ![]()
![]()
| © 2024 ThePatternSite.com Metric | Value | Diff | Close (within 10% of the high-low range for the day)? |
| Monthly S2 | 14,505.10 | ||
| Weekly S2 | 14,902.04 | 396.94 | |
| Monthly S1 | 15,055.29 | 153.25 | |
| Weekly S1 | 15,253.76 | 198.47 | |
| Daily S2 | 15,327.87 | 74.11 | |
| Daily S1 | 15,466.67 | 138.81 | |
| Low | 15,557.64 | 90.97 | |
| Close | 15,605.48 | 47.84 | |
| Weekly Pivot | 15,617.38 | 11.90 | Yes! The Weekly Pivot is close to the Close. |
| Open | 15,646.09 | 28.71 | Yes! The Open is close to the Weekly Pivot. |
| Daily Pivot | 15,696.45 | 50.36 | |
| 61.8% Down from Intraday High | 15,698.44 | 1.99 | Yes! The 61.8% Down from Intraday High is close to the Daily Pivot. |
| 50% Down from Intraday High | 15,741.93 | 43.49 | |
| Monthly Pivot | 15,772.97 | 31.04 | Yes! The Monthly Pivot is close to the 50% Down from Intraday High. |
| 38.2% Down from Intraday High | 15,785.42 | 12.45 | Yes! The 38.2% Down from Intraday High is close to the Monthly Pivot. |
| Daily R1 | 15,835.25 | 49.83 | |
| High | 15,926.22 | 90.97 | |
| Weekly R1 | 15,969.10 | 42.88 | |
| Daily R2 | 16,065.03 | 95.93 | |
| Monthly R1 | 16,323.16 | 258.13 | |
| Weekly R2 | 16,332.72 | 9.56 | Yes! The Weekly R2 is close to the Monthly R1. |
| Monthly R2 | 17,040.84 | 708.12 |
Here's the updated 2024 market forecast, presented in slider format.
$ $ $
Here's a symbol list of 202 chart and candlestick patterns (13 "investment grade" candle patterns) found in today's securities using my version of Patternz: MMM, ANF, ACIW, AEIS, AMD, AES, A, ALRM, ALB, ALGT, DOX, AEO, AEL, AMWD, AMAT, ARCB, ACGL, ADM, ANET, AVA, AZTA, BCPC, BZH, BKH, BRKR, BLDR, CALM, CX, CDAY, CF, CIEN, CI, CINF, CTAS, CGNX, GLW, CSGP, CROX, CCRN, CTS, CW, ^DJI, EXP, ECL, EIX, ELV, EME, WIRE, EQT, EZPW, FFIV, FARO, FIS, FORM, FTV, FWRD, FDP, GFS, GMS, GOOGL, GGG, HE, HQY, HL, HSIC, HON, HOV, HUM, HURC, IDXX, ITW, ILMN, IBP, IBKR, JKHY, JNJ, KELYA, KMT, KLAC, KLIC, LRCX, LDOS, LEN, LLY, LPLA, LXU, MTSI, MGY, MRO, MCHX, MRK, MLKN, MUR, ^IXIC, NOV, NFLX, NTAP, NJR, NOVT, NUS, NTNX, NVDA, OXY, OGE, ON, OUT, OMI, PINC, PHM, PSTG, QCOM, RMBS, RRC, RNG, RCKY, ROL, R, SIGI, SMTC, SHW, SKYW, SWN, SR, SSYS, SUM, SRDX, SNPS, TER, TTD, TMO, TKR, TOL, RIG, TZOO, TREX, TWLO, UNH, VECO, VMC, WAT, WMB, WOLF, WWW, WWD, WDAY, ZBRA, ITA, IYM, IYC, IHE, FTEC, FDN, QTEC, FXL, BOTZ, QQQ, IHF, IAT, IXN, SOXX, SLV, IGE, IEO, ITB, EWO, EWK, ECH, EWJ, EWW, EZA, EWT, QLD, DBA, SSO, ROBO, XLY, GLD, XHB, XLK, SMH, VIS, MGK, VONG. Click this link for details (pattern type, start and end dates).
For a list of small patterns (those a few days wide) click this link.
-- Thomas Bulkowski, author: Invest for Two-Comma Wealth and Training "Miles" (#Ad) ![]()
![]()
Support this site! Clicking any of the books (below) takes you to
Amazon.com If you buy ANYTHING while there, they pay for the referral.
Legal notice for paid links: "As an Amazon Associate I earn from qualifying purchases."
|
My Stock Market Books
|
My Novels
|