
As of 04/24/2024
Indus: 38,461 -42.77 -0.1%
Trans: 15,078 -358.61 -2.3%
Utils: 893 +6.79 +0.8%
Nasdaq: 15,713 +16.11 +0.1%
S&P 500: 5,072 +1.08 +0.0%
|
YTD
+2.0%
-5.2%
+1.3%
+4.7%
+6.3%
|
|
As of 04/24/2024
Indus: 38,461 -42.77 -0.1%
Trans: 15,078 -358.61 -2.3%
Utils: 893 +6.79 +0.8%
Nasdaq: 15,713 +16.11 +0.1%
S&P 500: 5,072 +1.08 +0.0%
|
YTD
+2.0%
-5.2%
+1.3%
+4.7%
+6.3%
| |
|
| ||
Since I post this the night before, check how the futures are trading before market open. Large moves can affect the opening direction.
$ $ $
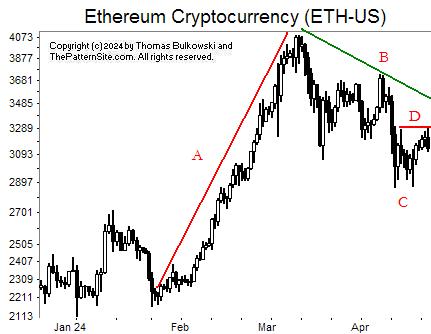
I show a picture of Ethereum on the daily scale.
Let's go through it by the letters.
At A, we see a strong uptrend, what I call a straight-line run up. There are few pauses along the way in a breath-taking rise.
At B, we see a messy retrace. Price can't decide on a direction so it falls and retraces. Rinse. Repeat.
At C, we see a potential double bottom. It hasn't confirmed as a valid double bottom because the currency hasn't closed above line D, which is the highest peak between the two bottoms. If the double bottom confirms, then look for the currency to rise. Until then, there's a substantial risk that it'll tumble (like 44% or something like that).
$ $ $
Here's a symbol list of 104 chart and candlestick patterns (13 "investment grade" candle patterns) found in today's securities using my version of Patternz: ANF, AFL, AMZN, AEE, AEO, AEL, AME, AMN, APH, ANIK, APA, ATO, BSET, BSX, BRC, BMY, CACI, CDNS, CPB, CNP, CHD, CINF, CLF, CMTL, COTY, CR, CCK, DECK, XRAY, DFS, ECL, EL, EG, EVH, FAST, FE, GME, GIS, HQY, HP, HUM, JBHT, HURC, IDA, NSP, JBLU, K, LDOS, LLY, LPLA, MANH, MCHX, MAS, MGEE, MS, NWPX, NUS, NVDA, OGE, OLN, OMC, ASGN, ON, OXM, PDCO, PCG, PG, PEG, PSTG, RL, RGA, RCKY, RGLD, SCCO, TDY, TXT, UGI, UNM, VEEV, WRB, WSO, WU, WWW, WDAY, ZBRA, ITA, IHE, FXI, EWK, EWH, EWM, PHO, XLB. Click this link for details (pattern type, start and end dates).
For a list of small patterns (those a few days wide) click this link.
$ $ $
The following table shows where Fibonacci retrace values of the day's high-low range are plus pivot points, calculated on the Nasdaq composite, sorted by value. When several are near each other (small differences), the area might act as support or resistance.
-- Thomas Bulkowski, author: Invest for Two-Comma Wealth (Ad)
![]()
| © 2024 ThePatternSite.com Metric | Value | Diff | Close (within 10% of the high-low range for the day)? |
| Monthly S2 | 14,508.72 | ||
| Weekly S2 | 14,671.11 | 162.39 | |
| Monthly S1 | 15,110.73 | 439.62 | |
| Weekly S1 | 15,191.93 | 81.20 | |
| Daily S2 | 15,524.17 | 332.24 | |
| Daily S1 | 15,618.46 | 94.29 | |
| Low | 15,634.44 | 15.98 | Yes! The Low is close to the Daily S1. |
| 61.8% Down from Intraday High | 15,712.58 | 78.14 | |
| Close | 15,712.75 | 0.17 | Yes! The Close is close to the 61.8% Down from Intraday High. |
| Daily Pivot | 15,728.73 | 15.98 | Yes! The Daily Pivot is close to the Close. |
| 50% Down from Intraday High | 15,736.72 | 7.99 | Yes! The 50% Down from Intraday High is close to the Daily Pivot. |
| Weekly Pivot | 15,743.60 | 6.88 | Yes! The Weekly Pivot is close to the 50% Down from Intraday High. |
| 38.2% Down from Intraday High | 15,760.86 | 17.26 | Yes! The 38.2% Down from Intraday High is close to the Weekly Pivot. |
| Open | 15,805.60 | 44.74 | |
| Daily R1 | 15,823.02 | 17.42 | Yes! The Daily R1 is close to the Open. |
| Monthly Pivot | 15,824.80 | 1.78 | Yes! The Monthly Pivot is close to the Daily R1. |
| High | 15,839.00 | 14.20 | Yes! The High is close to the Monthly Pivot. |
| Daily R2 | 15,933.29 | 94.29 | |
| Weekly R1 | 16,264.42 | 331.13 | |
| Monthly R1 | 16,426.81 | 162.39 | |
| Weekly R2 | 16,816.09 | 389.28 | |
| Monthly R2 | 17,140.88 | 324.79 |
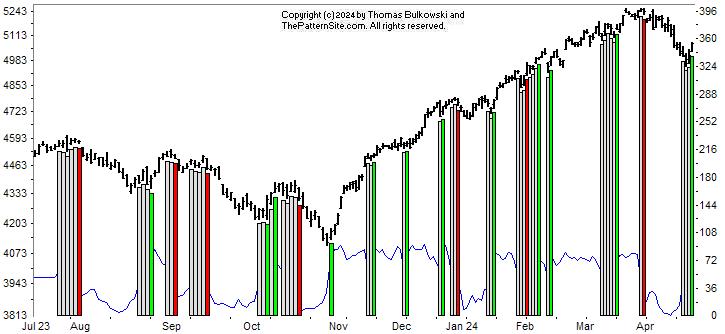
This is a picture of the chart pattern indicator on the daily scale. The indicator is the line chart below a chart of the S&P 500 composite.
The CPI turned bullish today (Tuesday, after the close). The vertical green bar on the far right of the chart shows this. Two bands of neutral signal preceded the green bar.
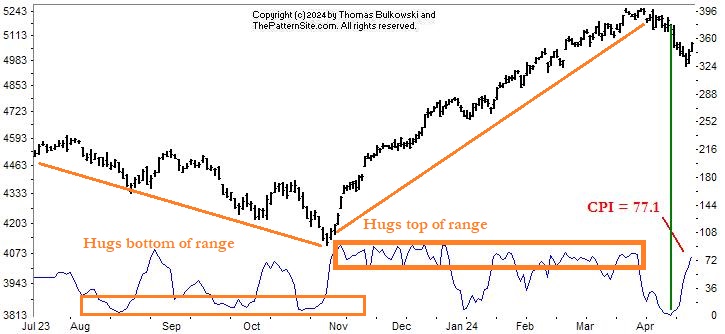
This chart shows how the CPI has changed over time. The thin green line shows the timing of the CPI reaching bottom (bearish) before heading higher.
A reading of 35 is the separator between bearish and neutral. Sixty-five is the threshold to turn a neutral signal bullish. Currently, the CPI is 77.1.
Signals can change for up to a week, so that's a factor. My guess is that yes, the S&P 500 has turned bullish, that the retrace is over.
Notice that from November to March, how the CPI hugged the upper portion of the 0 to 100 range. Compare that to the July to November line, where it hugged zero (the bottom of the range).
$ $ $
Here's a symbol list of 116 chart and candlestick patterns (13 "investment grade" candle patterns) found in today's securities using my version of Patternz: ABM, AXDX, ACIW, AFL, ALL, AEE, AEL, AFG, APA, ASH, BAX, BBY, BMRN, BA, BOOT, BFH, BMY, BRKR, CACI, CNP, CI, CINF, CLF, CNA, CL, CMCO, COTY, CRH, FANG, DFS, D, DUK, EIX, EL, EG, FDS, FICO, FISV, FNV, GIS, HBI, HE, HQY, HOLX, HUBG, HURC, JAZZ, JBLU, KELYA, KMB, LZB, LANC, L, MCHX, MTRN, MRK, MGEE, MS, MLI, NFG, NUS, ASGN, OR, OXM, PKG, PANW, PCG, POR, PPL, PG, QTWO, DGX, RLI, SAND, SRE, SHW, SO, SCCO, SNPS, TMO, UHAL, VFC, VMI, VMC, WRB, WMT, WU, WWW, ZBRA, ITA, IYK, FXL, FXI, IYF, EWO, EWK, EWG, EWH, EWI, EWM, EWS, EWP, EWL, THD, PBE, PHO, XLP. Click this link for details (pattern type, start and end dates).
For a list of small patterns (those a few days wide) click this link.
-- Thomas Bulkowski, author: Invest for Two-Comma Wealth (Ad)
![]()
$ $ $
I show another slider trading quiz featuring head-and-shoulders, complex bottoms.
$ $ $
Here's a symbol list of 104 chart and candlestick patterns (13 "investment grade" candle patterns) found in today's securities using my version of Patternz: ALB, ALL, AMZN, AEE, APA, ACGL, AVY, BECN, BBY, BMRN, CBT, CACI, CLS, CNP, CLNE, CNA, GLW, CSGP, DSGR, EVRG, FAST, FORM, FDP, FRD, GGG, HL, HSII, HWM, HURC, JKHY, JAZZ, JBLU, K, KMT, KMB, KSS, KLIC, LHX, LZB, LAMR, LEG, RAMP, LPLA, M, MCHX, MAS, MTRX, MRCY, MU, MUR, NFG, NOV, NKE, NWPX, ASGN, OTEX, POR, PG, DGX, NOW, STR, SKX, SXI, SCS, SRDX, TPR, TGT, TKR, RIG, UNM, VLO, WLK, WOLF, WWW, IEZ, FDN, FXI, BOTZ, IYZ, IXC, IGE, IYF, EWK, ECH, EWI, EWM, EWS, EWL, EWT, EWU, XRT. Click this link for details (pattern type, start and end dates).
For a list of small patterns (those a few days wide) click this link.
$ $ $
The following table shows where Fibonacci retrace values of the day's high-low range are plus pivot points, calculated on the Dow industrials, sorted by value. When several are near each other (small differences), the area might act as support or resistance.
-- Thomas Bulkowski, author: Invest for Two-Comma Wealth (Ad)
![]()
| © 2024 ThePatternSite.com Metric | Value | Diff | Close (within 10% of the high-low range for the day)? |
| Monthly S2 | 36,302.71 | ||
| Monthly S1 | 37,271.34 | 968.64 | |
| Weekly S2 | 37,304.20 | 32.86 | Yes! The Weekly S2 is close to the Monthly S1. |
| Daily S2 | 37,761.98 | 457.78 | |
| Weekly S1 | 37,772.09 | 10.11 | Yes! The Weekly S1 is close to the Daily S2. |
| Low | 37,985.07 | 212.98 | |
| Daily S1 | 38,000.98 | 15.91 | Yes! The Daily S1 is close to the Low. |
| Weekly Pivot | 38,079.45 | 78.47 | |
| Open | 38,116.89 | 37.44 | Yes! The Open is close to the Weekly Pivot. |
| 61.8% Down from Intraday High | 38,161.59 | 44.70 | Yes! The 61.8% Down from Intraday High is close to the Open. |
| 50% Down from Intraday High | 38,216.11 | 54.52 | |
| Daily Pivot | 38,224.07 | 7.96 | Yes! The Daily Pivot is close to the 50% Down from Intraday High. |
| Close | 38,239.98 | 15.91 | Yes! The Close is close to the Daily Pivot. |
| 38.2% Down from Intraday High | 38,270.64 | 30.66 | Yes! The 38.2% Down from Intraday High is close to the Close. |
| High | 38,447.16 | 176.52 | |
| Daily R1 | 38,463.07 | 15.91 | Yes! The Daily R1 is close to the High. |
| Weekly R1 | 38,547.34 | 84.27 | |
| Monthly Pivot | 38,580.20 | 32.86 | Yes! The Monthly Pivot is close to the Weekly R1. |
| Daily R2 | 38,686.16 | 105.96 | |
| Weekly R2 | 38,854.70 | 168.54 | |
| Monthly R1 | 39,548.83 | 694.13 | |
| Monthly R2 | 40,857.69 | 1,308.86 |
Support this site! Clicking any of the books (below) takes you to
Amazon.com If you buy ANYTHING while there, they pay for the referral.
Legal notice for paid links: "As an Amazon Associate I earn from qualifying purchases."
|
My Stock Market Books
|
My Novels
|

